F R O N T I E R L E T T E R
Open Access
Advective diffusion of volcanic plume
captured by dense GNSS network around
Sakurajima volcano: a case study of the
vulcanian eruption on July 24, 2012
Yusaku Ohta
1*and Masato Iguchi
2Abstract
Data from a dense GNSS network were used to investigate the temporal and spatial development of a volcanic plume during the eruptive event at Sakurajima volcano in Japan on July 24, 2012. We extracted the post-fit phase residuals (PPR) of ionosphere-free linear combinations for each satellite based on the precise point positioning (PPP) approach. Temporal and spatial PPR anomalies clearly detected the movement of the volcanic plume. The maximum height of the crossing points of anomalous PPR paths was determined to be approximately 4000 m. We also compared the estimated wet zenith tropospheric delay with the estimated PPR anomalies, which suggested that we might successfully extract the PPR anomalies caused by the eruptive event. We then compared the PPR with the signal-to-noise ratio (SNR) anomalies. Only the path passing just above the crater showed significant change in the SNR value, suggesting that the volcanic ash and the water vapor within the volcanic plume became separated after reaching a high altitude because of ash fall during the plume’s lateral movement. Each of the two observables might reflect different characteristics of the water vapor and volcanic ash.
Keywords:Volcanic plume; GNSS data; Post-fit phase residual; Signal-to-noise ratio
Correspondence/Findings Introduction
A volcanic explosion is one of the largest energy-release phenomena on earth. The contents of an eruptive column depend largely on the type of eruption. For example, vulcanian eruptions usually eject large amounts of rock mass, tephra, and volcanic ash. Ash fall from such events can seriously affect the structural integrity of buildings in addition to disrupting land and air traffic. Therefore, the monitoring and prediction of ash fall is very important.
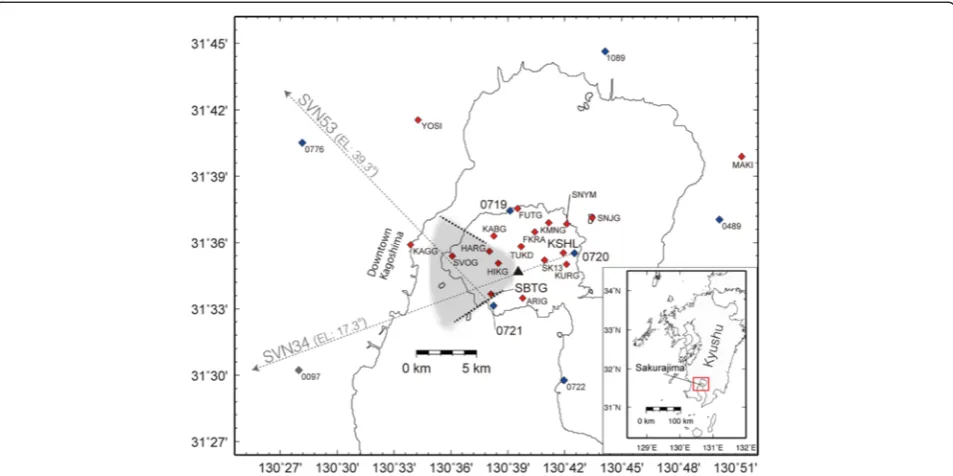
Sakurajima is one of the most active volcanoes in the world. It is located about 10 km east of downtown Kagoshima, in the most southern part of the island of Kyushu in Japan (Fig. 1). Since 1955, the volcanic eruptions from Sakurajima have occurred mainly from
the Minamidake and Showa craters. The Showa crater is located east of Minamidake, which is the summit crater of the central cone. The region neighboring Sakurajima volcano, including downtown Kagoshima, frequently ex-periences ash fall from the frequent vulcanian eruptions.
Several researchers have investigated the applicability of meteorological radar to the monitoring of the spatiotem-poral distribution of eruption clouds, including the ash (e.g., Rose et al. 1995; Lacasse et al. 2004; Marzano et al. 2006). Lacasse et al. (2004) investigated the first 12 h of development of the Hekla volcano (Iceland) eruption event in 2000 using a C-band radar located >100 km west of the volcano. One advantage of the C-band radar is its long range (approximately 200 km); however, it has difficulty in distinguishing volcanic ash from meteorological phenom-ena such as rain, snow, and clouds. Global Navigation Satellite System (GNSS) data provide a useful alternative to meteorological radar for detecting volcanic plumes. Houlié et al. (2005) suggested the possibility of detecting and mapping the temperature of volcanic plumes using * Correspondence:[email protected]
1Research Center for Prediction of Earthquakes and Volcanic Eruptions,
Graduate School of Science, Tohoku University, 6-6 Aza-Aoba, Aramaki, Aoba-ku, Sendai 980-8578, Japan
Full list of author information is available at the end of the article
© 2015 Ohta and Iguchi.Open AccessThis article is distributed under the terms of the Creative Commons Attribution 4.0 International License (http://creativecommons.org/licenses/by/4.0/), which permits unrestricted use, distribution, and reproduction in any medium, provided you give appropriate credit to the original author(s) and the source, provide a link to the Creative Commons license, and indicate if changes were made.
Global Positioning System (GPS) data, based on an analysis of the eruption event at Miyakejima volcano (Japan) on August 18, 2000. Grapenthin et al. (2013) found that large, short-term positioning offsets of sub-daily kinematic GNSS-positioning solutions correlated with large explosive events at the Redoubt volcano, SW of Anchorage in Alaska. Based on the phase residuals of the GNSS data, their research indicated that these offsets might be related to individual plumes. These previous studies used the post-fit phase residuals (PPR) of GPS signals between ground stations and GPS satellites after the application of basic GPS data processing for daily or sub-daily coordinate estimation. Larson (2013) investigated a new method for detecting volcanic plumes based on the signal-to-noise ratio (SNR) data of GPS receivers, which correspond to the carrier-to-noise density ratio (C/N0), i.e., the ratio of the signal-to-noise power spectral density. She applied this method, based on the SNR data, to the eruptions of the Okmok and Redoubt volcanoes (Alaska) in 2008 and 2009, respectively. This method has considerable advantage com-pared with PPR because it is possible to obtain the SNR data directly from the GPS receivers without the need for any processing. These two approaches for the detection of volcanic eruptive events were applied independently from each other in the previous studies and a quantitative com-parison of these two different approaches has not been attempted.
In this study, using data from a dense GNSS network, we investigated the spatiotemporal development of the volcanic plume ejected by the vulcanian eruption from Minamidake crater on July 24, 2012. In addition to PPR data, we used SNR information logged at GEONET sta-tions, making this the first research to use both observables for the detection of the volcanic plume and for the analysis of its advective diffusion.
GPS data and analysis
The Geographical Information Authority of Japan (GSI) established GEONET, a nationwide GNSS network com-posed of more than 1200 stations. However, there are in-sufficient numbers of GEONET stations for monitoring volcanic activity near the Sakurajima volcano because of the area’s mountainous topography. Thus, to monitor the crustal deformation associated with volcanic activity, Kyoto and Tohoku universities jointly operate a dense continuous GPS network in and around Sakurajima volcano. Figure 1 shows the distribution of GNSS stations used for this study. The GNSS data were sampled at 1- or 30-s intervals, depending on the situation of each station, e.g., the type of GNSS receiver and the telemetry system. All the stations record GPS dual-frequency data. Data from the universities network are telemetered via a telephone line or broadband Internet to the Sakurajima Volcano Research Center of Kyoto University.
On July 24, 2012, DOY (day of year) 206 at 19:15 local time (JST), a large typical vulcanian eruptive event occurred at Minamidake crater. In 2012, 883 explosive eruptions oc-curred at Showa crater, whereas only 2 explosive eruptions occurred at Minamidake crater. Although there have clearly been fewer eruptions at Minamidake crater, their scale has been larger than the typical explosive eruptions from Showa crater. In fact, the July 24, 2012 event was one of the largest eruptive events of the Sakurajima volcano in the past few years and therefore, it was selected as the target event for this study.
Based on field surveys of the ash fall, Iguchi (2013) estimated that the amount of volcanic ash ejected by this event was 250,000 tons, placing this eruptive event in the VEI = 1 (volcanic explosivity index). The ash fall was concentrated mainly over the western part of Sakurajima Island (Fig. 1). On the day of the event, the weather around Sakurajima was cloudy and so the Japan Meteorological Agency did not publish an official maximum plume height for this eruption. However, based on an Internet video clip taken in Kirishima, located 20 km northeast of the volcano, Iguchi (2013) was able to estimate a possible maximum plume height of 8000 m.
The GNSS data processing package GIPSY/OASIS II (e.g., Lichten and Border 1987) version 6.3 was used to process the GNSS data. We only used GPS satellites in this study. Precise point positioning (PPP) was applied as the processing strategy. We used the Jet Propulsion Laboratory final products (known as flinnR) for the precise ephemerides and clock information of the GNSS satellites. We used the absolute antenna calibration table provided by the International GNSS Service to correct the phase center variations of ground stations and GNSS satellites. Carrier phase ambiguities were resolved using the single-receiver ambiguity resolution technique (Bertiger et al. 2010). We estimated the daily station coordinates and the wet zenith tropospheric delay (WZTD) and its gradient at all process-ing epochs (every 30 s), under the assumption of a random walk stochastic model with an assumed process noise (5.0 × 10⁻⁸km s-1/2for WZTD and 5.0 × 10⁻⁹km s-1/2 for its gradient). We used the GPT2 model (Lagler et al. 2013) as a mapping function for the tropospheric parameter estimation. We also applied a second-order ionosphere correction (Kedar et al. 2003) deduced from the total elec-tron content information provided by the International GNSS Service as IONEX files. Finally, we calculated the PPR of the ionosphere-free linear combination (LC) between each station and the GNSS satellites, for every 30 s, based on the estimated daily coordinate value for each station. To avoid disturbance of the PPR by multi-paths for satellites with low elevation angles, we defined an elevation cutoff angle of 5° as part of the processing. However, we later adopt a higher elevation cutoff angle of 17° because several GPS stations had high PPR noise levels
at the lower elevation angle. Multipath errors are highly repeatable from day to day (e.g., Choi et al. 2004; Larson et al. 2007) with a sidereal period (23 h 56 min 4 s). Thus, sidereal filtering is useful for increasing the SNR of the PPR time series. However, to simplify the interpretation of the PPR time series, we did not apply sidereal filtering to the PPR time series in this study.
We used the SNR data of three GEONET stations for the discussion. As mentioned above, only GEONET stations log the SNR information, and therefore, we only used the three GEONET stations on Sakurajima Island for the SNR data processing. These GEONET stations are equipped with the same GNSS receiver (TOPCON NET-G3). The SNR data value strongly depends on the elevation angle, and the SNR value may oscillate at low elevation angles (<25°) because of ground reflections of the GPS signal (Larson 2013) with sidereal shifting. Thus, taking the sidereal shift of the SNR data into consideration, we subtracted the SNR data of the day prior to the eruption from the data of the day of the eruption, assuming pure sidereal shifting. After this processing step, we obtained the change in the SNR value relative to the steady state. It should be noted that significant anomalies did not appear in either the PPR or the SNR time series on the day before or the actual day of the eruption.
Results
Noise level of PPR
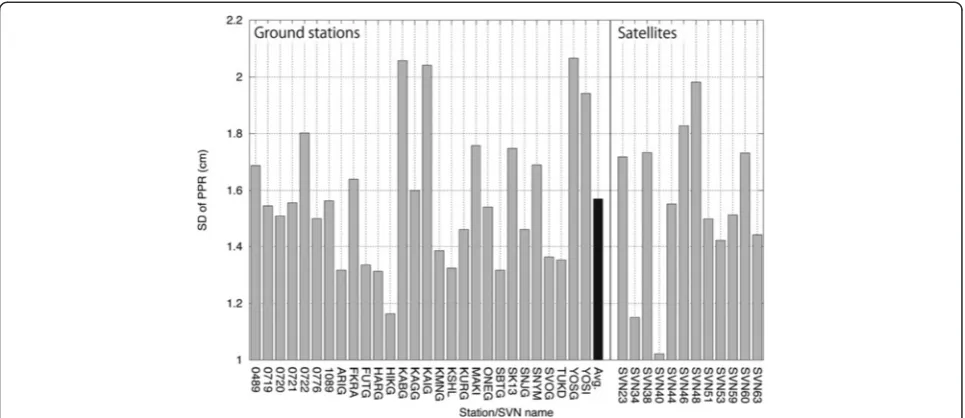
For the assessment of the noise level of the PPR data, we checked the steady-state value of the PPR data based on DOY 205 2012, i.e., one day prior to the studied eruptive event. Figure 2 shows the daily standard deviation (SD) of the PPR on DOY 205. We calculated the SD of each satellite and station pair. It is clear that most of the ground stations have SD values of <2.0 cm. Some stations (e.g., KABG) showed relatively large (>2.0 cm) SD values, which might have been caused by poor visibility because of the high vegetation around the stations. The result for each satellite and ground station pair shows a similar tendency, i.e., no satellite generates a large SD value. Thus, we used all visible satellites in this study. The calculated averaged SD value of all the ground stations was 1.57 cm (Fig. 2). Based on this value, we defined a threshold PPR value of 3.14 cm (95 % confidence level) for constructing Fig. 4.
Eruptive event at Minamidake crater on July 24, 2012 Figure 3 shows examples of the obtained PPR sky plots and time series of specific pairs of satellites and ground stations, both on the day of the eruptive event (DOY 206) and 1 day before the event (DOY 205). Figure 3a shows the result for station SBTG, which is located on the southwestern flank of Sakurajima Island (Fig. 1). The obtained PPR sky plot clearly shows positive anomalies for several satellites, such as Space Vehicle Number (SVN) 53,
which moved in a northwestward direction from SBTG. The positive PPR should indicate the extra atmospheric path delay between the satellite and the ground station. Figure 3b shows the PPR time series between station SBTG and satellite SVN53. Positive PPR anomalies clearly appear about 12 min after the onset of the eruption, and they continue for 30 min. Figure 3c, d shows the results for station KSHL, which is located on the eastern flank (Fig. 1). The characteristic large positive anomalies appear at SVN34 just after the eruption, which is located roughly to the west-southwest (Fig. 3c). The impulsive anomalies reach ~24 cm at 5 min after the onset and then decreased gradually for more than 30 min.
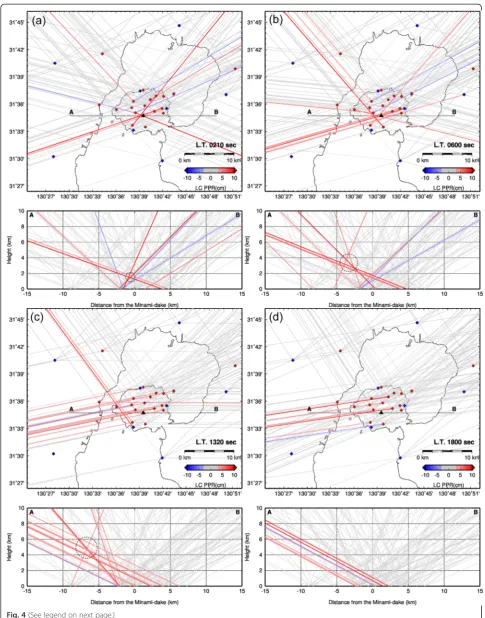
Figures 4 and S1 show the spatial and temporal develop-ment of the PPR anomalies deduced from each satellite and ground station pair. An additional movie file shows the spatial and temporal development of the PPR anomalies in more detail (see Additional file 1). For clarity, we colored the PPR anomalies of less than ±3.14 cm in gray, based on the assessment of the PPR noise level described in the pre-vious section. In the lower panels, we also show the cross section along line A–B in the map views. At 210 s after the onset of the eruption, large positive PPR anomalies appear in several satellite–station pairs. In particular, the paths of the larger PPR anomalies to stations KSHL, 0720, HIKG, and SBTG cross one another >1.5 km above the point approximately 1 km west of Minamidake crater. By 600 s after the onset, the intersections of the PPR anomalies can be seen to have moved westward relative to their locations 210 s after the eruption, and their heights to have reached >3–4 km. At 1320 s after the eruption, most stations on the island detected clear PPR anomalies in the
westward direction. Furthermore, several stations in the southern part of the island (e.g., ARIG, SBTG) detected PPR anomalies in the northwestern direction with high elevation angles. These results strongly sug-gest that the origin of the anomalous PPRs is located in the western part of Sakurajima Island. Finally, the PPR anomalies are only detected in the westward dir-ection 1800 s after the onset of the eruption.
Throughout all the snapshots, positive PPR anomalies are dominant. If the phase ambiguity is estimated at a higher value than the real value, a negative PPR value could also indicate a phase delay. The obtained negative PPR anomalies, however, changed within a short period (Additional file 2: Figure S1 and Additional file 1). If the wrong phase ambiguity estimation was the cause of the negative PPR, the negative PPR anomalies should remain in the long term. Thus, we concluded that the estimated negative PPR anomalies might be short-term noise such as multipath effects.
Based on field observations, Iguchi (2013) established the distribution of the volcanic ash fall across the island. He suggested that the area of ash fall was relatively small and concentrated over the western part of Sakurajima Island (see also Fig. 1). In the summer, the wind direction over the Sakurajima volcano is typically from the east. The actual direction and strength of the wind at 1892 m (geopotential height) at 21:00 JST on July 24, 2012 in Kagoshima, as recorded by the Japan Meteorological Agency, was 099° (from ESE to WNW) and 7 m s−1, respectively. Thus, the ash fall distribution was concentrated over the western part of the island. Our results suggest that the source of the PPR anomalies moved westward from the Minamidake crater.
This is generally consistent with the ash fall distribution based on the field surveys. However, the PPR anomalies might not only reflect the presence of volcanic ash but also volcanic gases, with abundant water vapor. In the next sec-tion, we discuss what is captured by the PPR anomalies.
Discussion
As highlighted in the introduction, C-band radar has difficulty distinguishing volcanic plumes from various meteorological phenomena. GPS also uses microwave (L-band) frequencies and thus, the GPS PPR time series might be correlated with weather conditions, such as inhomogeneous water vapor distributions. For the assessment of the PPR anomalies, we compared the
estimated WZTD and PPR anomalies. For the WZTD estimation, we used all the visible satellites.
Figure 3b and d shows examples of the estimated WZTD time series for stations SBTG and KSHL, respectively. It is clear there is no significant change in WZTD at KSHL im-mediately after the onset of the eruption (Fig. 3d). Both the PPR and the WZTD might reflect the path delay between the ground station and the satellite. Thus, it is difficult to separate completely the PPR from the WZTD in the GNSS data processing. In this study, we adopted a relatively small process noise value (5.0 × 10⁻⁸ km s-1/2) for the WZTD estimation in the processing. With such a small value, the estimated WZTD time series could not reproduce the short wavelength change of tropospheric delay.
Fig. 3Obtained post-fit phase residual (PPR) anomalies.aSky plot of PPR anomalies for station SBTG for the period from 1 h before and 1 h after the onset of the eruption on July 24, 2012 at the Minamidake crater.Blueandred colorsdenote negative and positive PPR anomalies, respectively. Positive PPR values might reflect the phase delay in the slant path between the station and the satellite.bTime series of PPR anomalies for the station SBTG relative to satellite SVN53 for the period from 0.2 h before to 1 h after the onset of the eruptive event.Solidanddashed linesdenote the day of the eruptive event (DOY 206) and 1 day before the eruptive event (DOY 205) at the Minamidake crater, respectively. Thehorizontal axisrepresents the lapsed time from the eruption onset. The corresponding trace of SVN53 is represented ina.Dashed blue linesdenote the estimated wet zenith tropospheric delay (WZTD) time series;candddenote the sky plot of the PPR anomalies for KSHL and the time series of PPR anomalies and WZTD values for station KSHL relative to SVN34, respectively
Furthermore, there was no drastic change in the weather on that day in and around Sakurajima Island, just after the onset of the eruption. Therefore, we might successfully extract the PPR anomalies caused by the eruptive event in this study. This problem must be resolved if GNSS data are to be used to monitor volcanic plumes in real time.
As described in the introduction, Iguchi (2013) highlighted that the maximum plume height for this event might have reached 8000 m. We could not con-firm this height using the PPR anomalies, even though several paths were located at that specific altitude. It is difficult to determine the exact reason for this inconsist-ency; however, one plausible reason is the sensitivity of the PPR. The density of water vapor and/or volcanic ash should be lower at higher altitudes compared with lower altitudes, but the PPR anomalies are not sensitive within the noise level (±3.14 cm) based on the noise assessment in the previous section. In any case, further case studies using visible light cameras and/or other sensors, including weather radar, will be needed to understand the reasons for this inconsistency. Furthermore, volcanic gas contains not only the water vapor but also other components such as sulfur dioxide (SO2). The measurement of these gas fluxes by other sensors such as spectrometer (e.g., Mori and Kato, 2013) and comparison with GNSS PPR data will also be important to understand the detailed phys-ical meaning of the PPR anomalies. Unfortunately, such comparative studies are beyond the scope of this study.
As described in Section 2, several GNSS stations re-corded not only the phase data but also the SNR values. Figure 5 shows the time series of SNR values relative to the day before the eruption for station 0720 and satellite SVN34, and for station 0721 and satellite SVN53. The slant-path direction between these ground stations and the satellites at the onset time of the eruption are shown in Fig. 1. It can be seen that the decrease in SNR appeared just after the onset time for the 0720–SVN34 pair. This path direction is located almost directly above the Min-amidake crater, with a 17.3° elevation angle (Fig. 1) at the onset time of the eruption. Just above the Minami-dake crater, the path reached 1500 m, which is slightly higher than the summit height (1117 m). The correspond-ing PPR values are clearly positive immediately after the event relative to SVN34. The two time series, however,
show different durations. The negative value in the SNR time series continued for 20 min after the onset. In con-trast, the PPR time series had a similar peak around 10 min after the onset, but its duration was longer compared with the negative values in the SNR time series (Fig. 5a). Furthermore, it is notable that the 0721–SVN53 pair showed no significant decrease in SNR value throughout the time series, even though the positive PPR anomaly clearly appeared 10 min after the eruption. This path crossed the western part of the island (Fig. 1) with a relatively high elevation angle (39.3°) at the onset time of the eruption. At the western end of the island, this path reached around 4000 m. Furthermore, no other paths captured any significant SNR anomaly (Fig. 6). Thus, the reason for this discrepancy between the PPR and SNR data remains to be discussed.
The PPR anomalies could be explained by the saturated water vapor and the small increase of temperature within the volcanic plume, which is only an increase of several tens of Kelvin (Houlié et al. 2005). In contrast, the SNR data might be influenced little by the water vapor distribu-tion compared with the PPR value. The SNR value might be influenced more by the volcanic ash acting as an obstacle between the satellite and the ground station. Based on these assumed conditions, we can suggest a hypothesis for this eruptive event. During the eruption, ash fall was concentrated mainly over the western part of the island (Iguchi 2013). Our PPR analysis also suggests that the volcanic plume moved westward (e.g., Fig. 4). The PPR and SNR time series of the path just above the Minamidake crater, with a low elevation angle, showed positive and negative anomalies, respectively (Fig. 5a). However, the SNR time series of the path over the western part of the island, with a high elevation angle (Fig. 5b), showed less significant change compared with the PPR time series. As described previously, this path reached a height of ~4000 m over the western end of the island.
This suggests that the volcanic ash and water vapor within the volcanic plume were separated from each other after the plume reached high altitude because of ash fall and westward advective diffusion. Water vapor could retain sufficient density and volume at high alti-tude (~4000 m) to be detected as a PPR anomaly, as
(See figure on previous page.)
Fig. 4Snapshots of the spatial and temporal distributions of post-fit phase residual (PPR) anomalies for the eruptive event at Sakurajima volcano on July 24, 2012, using data from the lapsed times (L.T., measured from the onset time of the eruptive event) shown in thebottom rightof each top panel. Each top panel shows a map view of the spatial distribution using each station and satellite pair.Solid colored linesshow the slant paths between each GNSS station and satellite pair projected onto a plane.Solid colored linesdenote positive and negative PPR anomaly values. TheDashed A–B lineshows the location of the vertical cross sections shown in each bottom panel. Asmall black trianglerepresents the location of the Minamidake crater. Each bottom panel shows the vertical cross section along line A–B in the top panels. The origin of the horizontal axis adjusts the location of the Minamidake crater shown in thetop panels. Dashed circlesdenote the possible maximum crossing point of anomalous PPR paths in each time step
Fig. 6L1 frequency signal-to-noise ratio (SNR) (S1) time series relative to the previous day at stations 0719, 0720, and 0721 in each satellite. The SNR data of the day before the eruption day were subtracted from the data of the day of the eruption to account for pure sidereal shifting
shown in Fig. 5b, which was clearly larger than the noise level. Conversely, the volcanic ash could not maintain sufficient density and volume at high altitude because of ash fall over the western part of the island. The SD of the SNR time series was <1 dB (e.g., Figs. 5 and 6) at the high elevation angle, and there was no detectable anomaly in the high altitude that exceeded the value of the SNR. This could have resulted in the observed discrepancy between the PPR and the SNR time series (Fig. 5b).
As described in the introduction, ash fall can seriously affect human activity. Thus, the monitoring and predic-tion of ash fall is very important. Unfortunately, visible light cameras cannot be used to observe eruptions that occur at night and/or when skies are cloudy. Recently, the GSI and Tohoku University have developed a nationwide (>1200 sites) real-time crustal deformation monitoring sys-tem, based on kinematic GNSS analysis, to determine the coseismic fault model of large earthquakes (e.g., Ohta et al. 2012, 2015; Kawamoto et al. 2015). Recently, the precision and accuracy of real-time satellite orbit/clock information has reached sufficient levels for the detection of coseismic displacements of just a few centimeters (e.g., Daud et al., 2008; Ohta et al., 2012). With this level of precision, the use of PPR values might be applicable for monitoring volcanic plumes. Of course, we can obtain SNR data directly from the GPS receivers without any processing. The availability of a real-time GNSS processing and monitoring system would complement the role of visible light cameras, weather radar, and other sensors in monitoring volcanic plumes.
Conclusions
In this study, we used GNSS data to investigate the advective diffusion of a volcanic plume from an eruptive event of Sakurajima volcano on July 24, 2012. Temporal and spatial PPR anomalies clearly showed the move-ment of the volcanic plume after the onset of the eruption. The crossing points of anomalous PPR paths
reached 3–4 km. We also compared the PPR and SNR
anomalies at GEONET stations and found that only one path, passing directly above the crater, detected any significant change in the SNR value, which sug-gested that the volcanic plume (including volcanic ash and gases such as water vapor) separated after the eruption because of ash fall during the plume’s west-ward movement. Our results suggest that each observ-able might reflect different information regarding the characteristics of the water vapor and volcanic ash. For a more quantitative assessment of volcanic plume detection based on GNSS data, particularly regarding its physical meaning, deeper understanding of the ad-vantages and disadad-vantages of each sensor is critical.
Additional files
Additional file 1:Movie (30-s intervals) of spatial distribution of ionosphere-free linear combination post-fit phase residual anomalies.
Other symbols are the same as in Fig. 4. (MP4 7 kb)
Additional file 2: Figure S1.Minute-by-minute snapshots of spatial distribution of ionosphere-free linear combination post-fit phase residual anomalies using the data in the lapsed times (L.T. measured from the onset time of eruptive event) shown at the bottom right of each top panel until 1740 s after the onset of the eruptive event. Other symbols are the same as in Fig. 4. (DOC 7 kb)
Abbreviations
DOY:Day of year; GEONET: GNSS Earth Observation Network System; GNSS: Global Navigation Satellite System; GPS: Global Positioning System; LC: ionosphere-free linear combination; PPP: precise point positioning; PPR: post-fit phase residuals; PRN: pseudo random noise; SNR: signal-to-noise ratio; SVN: space vehicle number; WZTD: wet zenith tropospheric delay.
Competing interests
The authors declare that they have no competing interests.
Authors’contributions
YO designed the study and analyzed the GNSS data. MI and YO observed the GNSS data. YO and MI drafted the manuscript. Both authors read and approved the final manuscript.
Acknowledgements
We gratefully thank the staff of the Sakurajima Volcano Research Center of Kyoto University, and Dr. Sadato Ueki and Dr. Tomotsugu Demachi at Tohoku University, for maintaining the continuous GNSS stations. We are also grateful to the GSI for providing the GEONET GNSS data and to the Jet Propulsion Laboratory for providing high-quality precise ephemerides and clock information. We thank Prof. Kristine M. Larson for providing“RinexSNR” code to extract the SNR data from RINEX files. We would like to thank Prof. Kosuke Heki, an anonymous reviewer, and the associate editor for their many constructive comments on the manuscript. This study was partly supported by the Ministry of Education, Culture, Sports, Science, and Technology (MEXT) of Japan, under its Earthquake and Volcano Hazards Observation and Research Program. This work was also supported by Japan Society for the Promotion of Science (JSPS) KAKENHI Grant Number 15H03713. We would like to thank Editage (www.editage.jp) for the English language editing.
Author details
1Research Center for Prediction of Earthquakes and Volcanic Eruptions,
Graduate School of Science, Tohoku University, 6-6 Aza-Aoba, Aramaki, Aoba-ku, Sendai 980-8578, Japan.2Disaster Prevention Research Institute, Kyoto University, 1722-19, Sakurajima-Yokoyama-cho, Kagoshima 891-1419, Japan.
Received: 12 May 2015 Accepted: 3 September 2015
References
Bertiger W, Desai SD, Haines B, Harvey N, Moore AW, Owen S, Weiss JP (2010) Single-receiver phase ambiguity resolution with GPS data. J Geophys Res 84:327–337. doi:10.1007/s00190-010-0371-9
Choi K, Bilich A, Larson K, Axelarad P (2004) Modified sidereal filtering: Implications for high-rate GPS positioning. Geophys Res Lett 31:L22608 Daud M, Sagiya T, Kimata F, Kato T (2008) Long-baseline quasi-real time
kinematic GPS data analysis for early tsunami warning. Earth Planets Space 60(12):1191–1195
Grapenthin R, Freymueller JT, Kaufman AM (2013) Geodetic observations during the 2009 eruption of Redoubt Volcano, Alaska. J Volcanol Geotherm Res 259:115–132. doi:10.1016/j.jvolgeores.2012.04.021
Houlié N, Briole P, Nercessian A, Murakami M (2005) Sounding the plume of the 18 August 2000 eruption of Miyakejima volcano (Japan) using GPS. Geophys Res Lett 32(5):2–5. doi:10.1029/2004GL021728
Iguchi M (2013) Eruptive activity of Sakurajima volcano during the period from July 2011 to June 2012. http://www.svo.dpri.kyoto-u.ac.jp/H24sakura/01iguchi.pdf (Japanese with English abstract).
Kawamoto S, Miyagawa K, Yahagi T, Todoroki M, Nishimura T, Ohta Y, Hino R, Miura S (2015) Development and assessment of real-time fault model estimation routines in the GEONET real-time processing system, International Association of Geodesy Symposia, doi:10.1007/1345_2015_49
Kedar S, Hajj GA, Wilson BD, Heflin MB (2003) The effect of the second order GPS ionospheric correction on receiver positions. Geophys Res Lett 30(16):1–4. doi:10.1029/2003GL017639
Lacasse C, Karlsdóttir S, Larsen G, Soosalu H, Rose WI, Ernst GGJ (2004) Weather radar observations of the Hekla 2000 eruption cloud, Iceland. Bull Volcanol 66:457–473. doi:10.1007/s00445-003-0329-3
Lagler K, Schindelegger M, Böhm J, Krásná H, Nilsson T (2013) GPT2: Empirical slant delay model for radio space geodetic techniques. Geophys Res Lett 40(6):1069–1073. doi:10.1002/grl.50288
Larson KM, Bilich A, Axelrad P (2007) Improving the precision of high-rate GPS. J Geophys Res 112:B05422. doi:10.1029/2006JB004367
Larson KM (2013) A new way to detect volcanic plumes. Geophys Res Lett 40(11):2657–2660. doi:10.1002/grl.50556
Lichten SM, Border JS (1987) Strategies for high precision global positioning system orbit determination. J Geophys Res 92(B12):12751–12762 Marzano FS, Barbieri S, Vulpiani G, Rose WI (2006) Volcanic ash cloud retrieval by
ground-based microwave weather radar. IEEE Trans Geosci Remote Sens 44(11):3235–3245. doi:10.1109/TGRS.2006.879116
Mori T, Kato K (2013) Sulfur dioxide emissions during the 2011 eruption of Shinmoedake volcano, Japan. Earth Planets Space 65(6):573–580. doi:10.5047/ eps.2013.04.005
Ohta Y, Kobayashi T, Tsushima H, Miura S, Hino R, Takasu T, Fujimoto H, Iinuma T, Tachibana K, Demachi T, Sato T, Ohzono M, Umino N (2012) Quasi real-time fault model estimation for near-field tsunami forecasting based on RTK-GPS analysis: Application to the 2011 Tohoku-Oki Earthquake (Mw 9.0). J Geophys Res 117:B0231116. doi:10.1029/2011JB008750
Ohta Y., Kobayashi T, Hino R, Demachi T, Miura S (2015), Rapid coseismic fault determination of consecutive large interplate earthquakes: The 2011 Tohoku-Oki sequence, International Association of Geodesy Symposia, doi:10.1007/ 1345_2015_109
Rose WI, Kostinski AB, Kelley L (1995) Real time C-band radar observations of 1992 eruption clouds from Crater Peak/Spurr Volcano. U. S. Geological Survey Bulletin, Alaska, p 2139
Submit your manuscript to a
journal and benefi t from:
7Convenient online submission 7Rigorous peer review
7Immediate publication on acceptance 7Open access: articles freely available online 7High visibility within the fi eld
7Retaining the copyright to your article