Design & Development of Simulated Approaches to
Stabilize Request Queues, Reduce Average Deficit and
ensure Quality of Service
Veeraboina Jagadeesh
1; Ch.Sirlakshmi
2& Prof.Dr.G.Manoj Someswar
31
M.Tech.(CSE) from Narasimha Reddy Engineering College, Affiliated to JNTUH, Hyderabad,
Telangana, India
2
M.Tech. (CSE), Assistant Professor, Department of CSE, Narasimha Reddy Engineering College,
Affiliated to JNTUH, Hyderabad, Telangana, India
3
B.Tech., M.S.(USA), M.C.A., Ph.D., Principal & Professor, Department Of CSE, Anwar-ul-uloom
College of Engineering & Technology, Affiliated to JNTUH, Vikarabad, Telangana, India
ABSTRACT:
The rapid growth of wireless content access implies the need for content placement and scheduling
at wireless base stations. We study a system under which users are divided into clusters based on their
channel conditions and their requests are represented by different queues at logical front ends. Requests
might be elastic (implying no hard delay constraint) or inelastic (requiring that a delay target be met).
Correspondingly, we have requested queues that indicate the number of elastic requests and deficit
queues that indicate the deficit in inelastic service. Caches are of finite size and can be refreshed
periodically from a media vault. We consider two cost models that correspond to inelastic requests for
streaming stored content and real-time streaming of events, respectively. We design probably optimal
policies that stabilize the request queues (hence ensuring finite delays) and reduce average deficit to zero
[hence ensuring that the quality-of-service (QoS) target is met] at small cost. We illustrate our approach
through simulations.
Keywords:
Mean Time Between Failures; Server Based Networks; Ethernet Network; Elastic Traffic
Module; Cellular Base Stations; Unified Modeling Language
INTRODUCTION
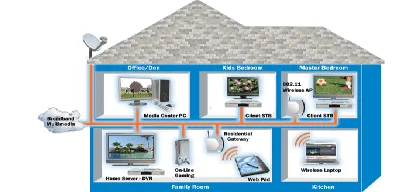
Networking is the word basically relating to computers and their connectivity. It is very often used in the world of computers and their use in different connections. The term networking implies the link between two or more computers and their devices, with the vital purpose of sharing the data stored in the computers, with each other. The networks between the computing devices are very common these days due to the launch of various hardware and computer software
which aid in making the activity much more convenient to build and use.
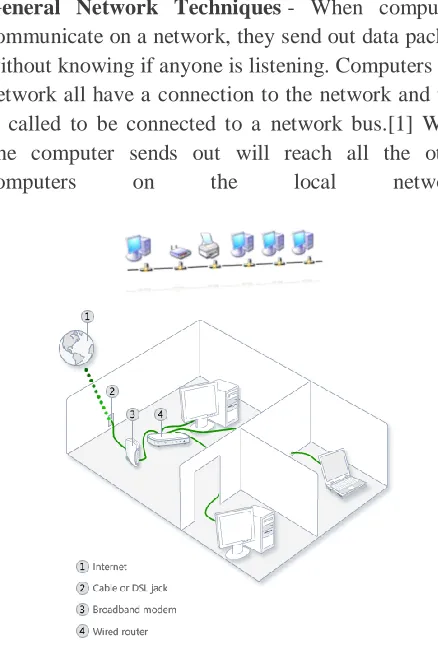
Conference Chair:Prof.Dr.G.ManojSomeswar, Director General, Global Research Academy, Hyderabad, General Network Techniques - When computers
communicate on a network, they send out data packets without knowing if anyone is listening. Computers in a network all have a connection to the network and that is called to be connected to a network bus.[1] What one computer sends out will reach all the other computers on the local network.
Figure 2: Diagrams show the clear idea about the networking functions
For the different computers to be able to distinguish between each other, every computer has a unique ID called MAC-address (Media Access Control Address). This address is not only unique on your network but unique for all devices that can be hooked up to a network. The MAC-address is tied to the hardware and has nothing to do with IP-addresses. Since all computers on the network receives everything that is sent out from all other computers the MAC-addresses is primarily used by the computers to filter out incoming network traffic that is addressed to the individual computer.
When a computer communicates with another computer on the network, it sends out both the other computers MAC-address and the MAC-address of its own.[2] In that way the receiving computer will not
only recognize that this packet is for me but also, who sent this data packet so a return response can be sent to the sender.
On an Ethernet network as described here, all computers hear all network traffic since they are connected to the same bus. This network structure is called multi-drop.
One problem with this network structure is that when you have, let say ten (10) computers on a network and they communicate frequently and due to that they sends out there data packets randomly, collisions occur when two or more computers sends data at the same time. When that happens data gets corrupted and has to be resent. On a network that is heavy loaded even the resent packets collide with other packets and have to be resent again. In reality this soon becomes a bandwidth problem. If several computers communicate with each other at high speed they may not be able to utilize more than 25% of the total network bandwidth since the rest of the bandwidth is used for resending previously corrupted packets. The way to minimize this problem is to use network switches.
Characteristics of Networking:
The following characteristics should be considered in network design and ongoing maintenance:
1) Availabilityis typically measured in a percentage based on the number of minutes that exist in a year. Therefore, uptime would be the number of minutes the network is available divided by the number of minutes in a year.[3]
2) Cost includes the cost of the network components, their installation, and their ongoing maintenance.
4) Securityincludes the protection of the network components and the data they contain and/or the data transmitted between them.
5) Speed includes how fast data is transmitted between network end points (the data rate). 6) Scalability defines how well the network can
adapt to new growth, including new users, applications, and network components.
7) Topology describes the physical cabling layout and the logical way data moves between components.
Types of Networks:
Organizations of different structures, sizes, and budgets need different types of networks. Networks can be divided into one of two categories:
peer-to-peer
server-based networks
1. Peer-to-Peer Network:
A peer-to-peer network has no dedicated servers; instead, a number of workstations are connected together for the purpose of sharing information or devices.[4] Peer-to-peer networks are designed to satisfy the networking needs of home networks or of small companies that do not want to spend a lot of money on a dedicated server but still want to have the capability to share information or devices like in school, college, cyber cafe
2. Server-Based Networks:
In server-based network data files that will be used by all of the users are stored on the one server. With a server-based network, the network server stores a list of users who may use network resources and
usually holds the resources as well.
This will help by giving you a central point to set up permissions on the data files, and it will give you a central point from which to back up all of the data in case data loss should occur.
Network Communications:
Computer networks use signals to transmit data, and protocols are the languages computers use to communicate.[5]
Protocols provide a variety of communications services to the computers on the network.
Local area networks connect computers using a shared, half-duplex, baseband medium, and wide area networks link distant networks.[6]
Enterprise networks often consist of clients and servers on horizontal segments connected by a common backbone, while peer-to-peer networks consist of a small number of computers on a single LAN.
Advantages of Networking: 1. Easy Communication:
It is very easy to communicate through a network. People can communicate efficiently using a network with a group of people. They can enjoy the benefit of emails, instant messaging, telephony, video conferencing, chat rooms, etc.[7]
2. Ability to Share Files, Data and Information:
This is one of the major advantages of networking computers. People can find and share information and data because of networking. This is beneficial for large organizations to maintain their data in an organized manner and facilitate access for desired people.
3. Sharing Hardware:
Another important advantage of networking is the ability to share hardware. For an example, a printer can be shared among the users in a network so that there’s no need to have individual printers for each and every computer in the company. This will significantly reduce the cost of purchasing hardware.
4. Sharing Software:
Users can share software within the network easily. Networkable versions of software are available at considerable savings compared to individually licensed version of the same software. Therefore large companies can reduce the cost of buying software by networking their computers.
5. Security:
Conference Chair:Prof.Dr.G.ManojSomeswar, Director General, Global Research Academy, Hyderabad, accessed by the authorized users. This is another
important advantage of networking when there are concerns about security issues. Also each and every user has their own set of privileges to prevent those accessing restricted files and programs.[8]
6. Speed:
Sharing and transferring files within networks is very rapid, depending on the type of network. This will save time while maintaining the integrity of files.
INPUT DESIGN
The input design is the link between the information system and the user. It comprises the developing specification and procedures for data preparation and those steps are necessary to put transaction data in to a usable form for processing can be achieved by inspecting the computer to read data from a written or printed document or it can occur by having people keying the data directly into the system. The design of input focuses on controlling the amount of input required, controlling the errors, avoiding delay, avoiding extra steps and keeping the process simple. The input is designed in such a way so that it provides security and ease of use with retaining the privacy. Input Design considered the following things:
What data should be given as input? How the data should be arranged or coded? The dialog to guide the operating personnel
in providing input.
Methods for preparing input validations and steps to follow when error occur.
OBJECTIVES
1.Input Design is the process of converting a user-oriented description of the input into a computer-based system. This design is important to avoid errors in the data input process and show the correct direction to the management for getting correct information from the computerized system.
2.It is achieved by creating user-friendly screens for the data entry to handle large volume of data. The goal of designing input is to make data entry easier and to be free from errors. The data entry screen
is designed in such a way that all the data manipulates can be performed. It also provides record viewing facilities.
3.When the data is entered it will check for its validity. Data can be entered with the help of screens. Appropriate messages are provided as when needed so that the user will not be in maize of instant. Thus the objective of input design is to create an input layout that is easy to follow.
OUTPUT DESIGN
A quality output is one, which meets the requirements of the end user and presents the information clearly. In any system results of processing are communicated to the users and to other system through outputs. In output design it is determined how the information is to be displaced for immediate need and also the hard copy output. It is the most important and direct source information to the user. Efficient and intelligent output design improves the system’s relationship to help user decision-making. 1. Designing computer output should proceed in an organized, well thought out manner; the right output must be developed while ensuring that each output element is designed so that people will find the system can use easily and effectively. When analysis design computer output, they should Identify the specific output that is needed to meet the requirements.
2.Select methods for presenting information. 3.Create document, report, or other formats that contain information produced by the system.
The output form of an information system should accomplish one or more of the following objectives.
Convey information about past activities, current status or projections of the
Future.
Signal important events, opportunities, problems, or warnings.
IMPLEMENTATION MODULES:
Creating System Model
Content Caching System Module Elastic Traffic Module
Inelastic Traffic Module
MODULES DESCRIPTION: Creating System Model
In this module, we create the System model, with Socket programming technique
Create Wireless Nodes (Base Stations) with Cache
Media Vault
There are multiple cellular base stations
(BSs), each of which has a cache in which to store content.
Users can make two kinds of requests, namely: 1) elastic requests that have no delay constraints, and 2) inelastic requests that have a hard delay constraint.
Content Caching System Module
In this module we design Scheduling
methodology that is what is to be broadcasted from caches. In this module we also develop Content caching methodology, which is what to be loaded in caches.
The content of the caches can be periodically refreshed through accessing a media vault. We divide users into different clusters, with the idea that all users in each cluster are geographically close such that they have statistically similar channel conditions and are able to access the same base stations. Note that multiple clusters could be present in the same cell based on the dissimilarity of their channel conditions to different base stations. The requests made by each cluster are aggregated at a logical entity that we call a front end (FE) associated with that cluster. The front end could be running on any of the devices in the
cluster or at a base station, and its purpose is to keep track of the requests associated with the users of that cluster.
Elastic Traffic Module
In this module, we develop elastic traffic module, where there should be No delay constraint.
Stored in Request Queues at frontends.
Elastic requests are stored in a request queue
at each front end, with each type of request occupying a particular queue. Here, the objective is to stabilize the queue, so as to have finite delays.
Inelastic Traffic Module
In this module, we develop Inelastic traffic module for Hard Delay Constraint.
Drop if not served by the deadline. Need a minimum delivery ratio.
For inelastic requests, we adopt the model proposed wherein users request chunks of content that have a strict deadline, and the request is dropped if the deadline cannot be met.
SYSTEM ANALYSIS EXISTING SYSTEM:
Conference Chair:Prof.Dr.G.ManojSomeswar, Director General, Global Research Academy, Hyderabad, to satisfy multiple users simultaneously. There are
multiple cellular base stations (BSs), each of which has a cache in which to store content. The content of the caches can be periodically refreshed through accessing a media vault. We divide users into different clusters, with the idea that all users in each cluster are geographically close such that they have statistically similar channel conditions and are able to access the same base stations. Note that multiple clusters could be present in the same cell based on the dissimilarity of their channel conditions to different base stations. The requests made by each cluster are aggregated at a logical entity that we call a front end (FE) associated with that cluster.[10]
DISADVANTAGES OF EXISTING SYSTEM:
The wireless network between the caches to the users has finite capacity. Refreshing content in the caches from
the media vault incurs a cost.
PROPOSED SYSTEM:
In this research paper, we develop algorithms for content distribution with elastic and inelastic requests. We use a request queue to implicitly determine the popularity of elastic content. Similarly, the deficit queue determines the necessary service for inelastic requests. Content may be refreshed periodically at caches. We study two different kinds of cost models, each of which is appropriate for a different content distribution scenario. The first is the case of file distribution (elastic) along with streaming of stored content (inelastic), where we model cost in terms of the frequency with which caches are refreshed. The second is the case of streaming of content that is generated in real-time, where content expires after a certain time, and the cost of placement of each packet in the cache is considered.
ADVANTAGES OF PROPOSED SYSTEM:
It stabilizes the system load within the capacity region.
Minimizes the average expected cost while stabilizing the deficit queues
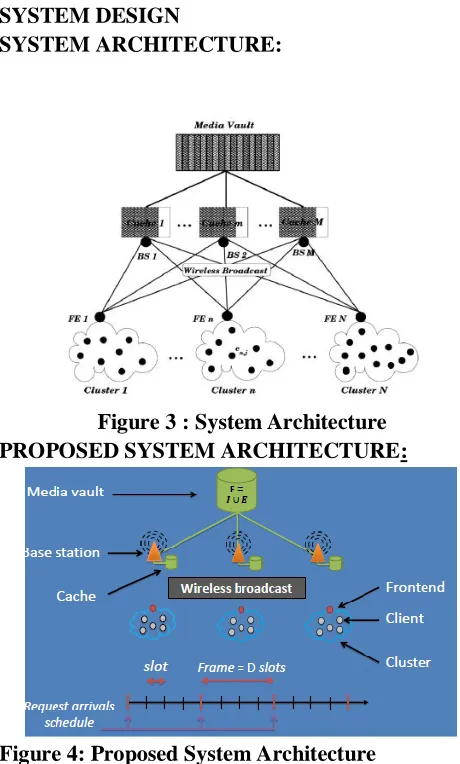
SYSTEM DESIGN
SYSTEM ARCHITECTURE:
Figure 3 : System Architecture PROPOSED SYSTEM ARCHITECTURE:
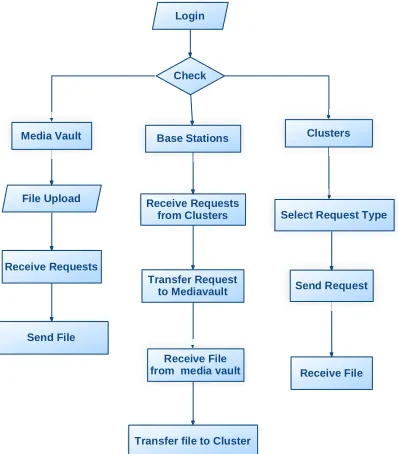
Figure 4: Proposed System Architecture DATA FLOW DIAGRAM:
1. The DFD is also called as bubble chart. It is a simple graphical formalism that can be used to represent a system in terms of input data to the system, various processing carried out on this data, and the output data is generated by this system.[11]
2. The data flow diagram (DFD) is one of the most important modeling tools. It is used to
model the system components. These
3. DFD shows how the information moves through the system and how it is modified by a series of transformations. It is a graphical technique that depicts information flow and the transformations that are applied as data moves from input to output.[12]
4. DFD is also known as bubble chart. A DFD may be used to represent a system at any level of abstraction. DFD may be partitioned into levels that represent increasing information flow and functional detail.
Receive Requests
Receive Requests from Clusters
Transfer Request to Mediavault File Upload
Send File
Login
Check
Base Stations
Media Vault
Receive File
from media vault Receive File Clusters
Transfer file to Cluster
Select Request Type
Send Request
Figure 5: Data Flow diagram UML DIAGRAMS
UML stands for Unified Modeling Language. UML is a standardized general-purpose modeling language in the field of object-oriented software engineering. The standard is managed, and was created by the Object Management Group. [13]
The goal is for UML to become a common language for creating models of object oriented computer software. In its current form UML is comprised of two major components: a Meta-model and a notation. In the future, some form of method or
process may also be added to; or associated with UML.
The Unified Modeling Language is a standard language for specifying, Visualization, Constructing and documenting the artifacts of software system, as well as for business modeling and other non-software systems.
The UML represents a collection of best engineering practices that have proven successful in the modeling of large and complex systems.[14]
The UML is a very important part of developing objects oriented software and the software development process. The UML uses mostly graphical notations to express the design of software projects.
GOALS:
The Primary goals in the design of the UML are as follows:
1. Provide users a ready-to-use, expressive visual modeling Language so that they can develop and exchange meaningful models.
2. Provide extendibility and specialization mechanisms to extend the core concepts. 3. Be independent of particular programming
languages and development process.
4. Provide a formal basis for understanding the modeling language.
5. Encourage the growth of OO tools market. 6. Support higher level development concepts
such as collaborations, frameworks, patterns and components.
7. Integrate best practices.
USE CASE DIAGRAM:
Conference Chair:Prof.Dr.G.ManojSomeswar, Director General, Global Research Academy, Hyderabad, actors in the system can be depicted.[15]
Media Vault
Clusters
Base Stations
File Upload
Send File Request
Transfer request to Media vault
Recieve Request
Send File
Recieve File IP Address
Transfer File to Clusters Register
Figure 6: Use Case Diagram CLASS DIAGRAM:
In software engineering, a class diagram in the Unified Modeling Language (UML) is a type of static structure diagram that describes the structure of a system by showing the system's classes, their attributes, operations (or methods), and the relationships among the classes.
. It explains which class contains information.
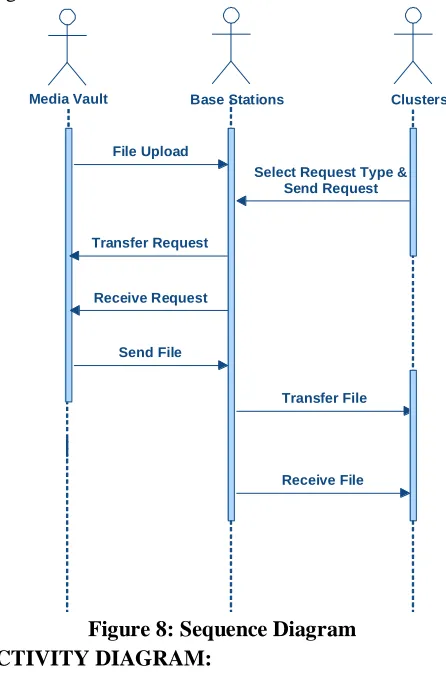
Figure 7: Class Diagram SEQUENCE DIAGRAM:
A sequence diagram in Unified Modeling Language (UML) is a kind of interaction diagram that shows how processes operate with one another and in what order.[16] It is a construct of a Message Sequence Chart. Sequence diagrams are sometimes
called event diagrams, event scenarios, and timing diagrams.
Media Vault
File Upload
Base Stations Clusters
Select Request Type & Send Request
Transfer Request
Receive Request
Send File
Transfer File
Receive File
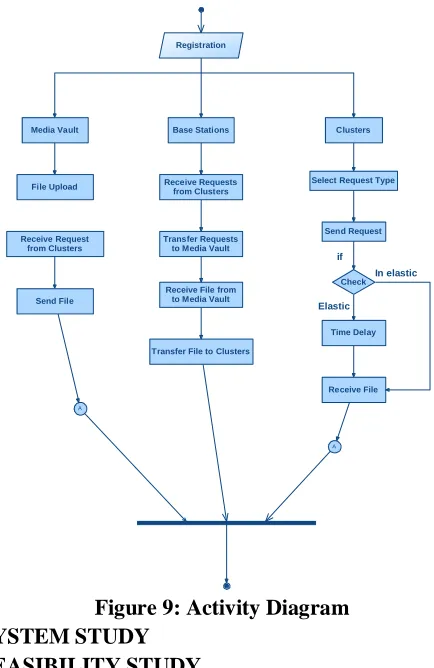
Figure 8: Sequence Diagram ACTIVITY DIAGRAM:
Activity diagrams are graphical
A
A Registration
Receive Request from Clusters
Select Request Type File Upload
Clusters Media Vault
Send File
Base Stations
Receive Requests from Clusters
Transfer Requests to Media Vault
Receive File from to Media Vault
Transfer File to Clusters
Check
Time Delay Send Request
Receive File
if
In elastic
Elastic
Figure 9: Activity Diagram SYSTEM STUDY
FEASIBILITY STUDY
The feasibility of the project is analyzed in this phase and business proposal is put forth with a very general plan for the project and some cost estimates. During system analysis the feasibility study of the proposed system is to be carried out. This is to ensure that the proposed system is not a burden to the company. For feasibility analysis, some understanding of the major requirements for the system is essential.
Three key considerations involved in the feasibility analysis are
ECONOMIC FEASIBILITY
TECHNICAL FEASIBILITY
SOCIAL FEASIBILITY
ECONOMIC FEASIBILITY
This research study is carried out to check the economic impact that the system will have on the organization. The amount of fund that the company can pour into the research and development of the
system is limited. The expenditures must be justified.Thus the developed system as well within the budget and this was achieved because most of the technologies used are freely available. Only the customized products had to be purchased.
TECHNICAL FEASIBILITY
This research study is carried out to check the technical feasibility, that is, the technical requirements of the system. Any system developed must not have a high demand on the available technical resources. This will lead to high demands on the available technical resources. This will lead to high demands being placed on the client. The developed system must have a modest requirement, as only minimal or null changes are required for implementing this system.
SOCIAL FEASIBILITY
The aspect of study is to check the level of acceptance of the system by the user. This includes the process of training the user to use the system efficiently. The user must not feel threatened by the system, instead must accept it as a necessity. The level of acceptance by the users solely depends on the methods that are employed to educate the user about the system and to make him familiar with it. His level of confidence must be raised so that he is also able to make some constructive criticism, which is welcomed, as he is the final user of the system.
SYSTEM TESTING
Conference Chair:Prof.Dr.G.ManojSomeswar, Director General, Global Research Academy, Hyderabad,
TYPES OF TESTS Unit testing
Unit testing involves the design of test cases that validate that the internal program logic is functioning properly, and that program inputs produce valid outputs. All decision branches and internal code flow should be validated. It is the testing of individual software units of the application .it is done after the completion of an individual unit before integration. This is a structural testing, that relies on knowledge of its construction and is invasive. Unit tests perform basic tests at component level and test a specific business process, application, and/or system configuration. Unit tests ensure that each unique path of a business process performs accurately to the documented specifications and contains clearly defined inputs and expected results.
Integration testing
Integration tests are designed to test integrated software components to determine if they actually run as one program. Testing is event driven and is more concerned with the basic outcome of screens or fields. Integration tests demonstrate that although the components were individually satisfaction, as shown by successfully unit testing, the combination of components is correct and consistent. Integration testing is specifically aimed at exposing the problems that arise from the combination of components.
Functional test
Functional tests provide systematic
demonstrations that functions tested are available as specified by the business and technical requirements, system documentation, and user manuals.
Functional testing is centered on the following items: Valid Input : identified classes of valid input must be accepted.
Invalid Input : identified classes of invalid input must be rejected.
Functions : identified functions must be exercised.
Output : identified classes of application outputs must be exercised.
Systems/Procedures: interfacing systems or procedures must be invoked.
Organization and preparation of functional tests is focused on requirements, key functions, or special test cases. In addition, systematic coverage pertaining to identify Business process flows; data fields, predefined processes, and successive processes must be considered for testing. Before functional testing is complete, additional tests are identified and the effective value of current tests is determined.
System Test
System testing ensures that the entire integrated software system meets requirements. It tests a configuration to ensure known and predictable results. An example of system testing is the configuration oriented system integration test. System testing is based on process descriptions and flows, emphasizing pre-driven process links and integration points.
White Box Testing
White Box Testing is a testing in which in which the software tester has knowledge of the inner workings, structure and language of the software, or at least its purpose. It is purpose. It is used to test areas that cannot be reached from a black box level.
Black Box Testing
Unit Testing:
Unit testing is usually conducted as part of a combined code and unit test phase of the software lifecycle, although it is not uncommon for coding and unit testing to be conducted as two distinct phases.
Test strategy and approach
Field testing will be performed manually and functional tests will be written in detail.
Test objectives
All field entries must work properly.
Pages must be activated from the identified link.
The entry screen, messages and responses must not be delayed.
Features to be tested
Verify that the entries are of the correct format No duplicate entries should be allowed
All links should take the user to the correct page.
Integration Testing
Software integration testing is the incremental integration testing of two or more integrated software components on a single platform to produce failures caused by interface defects.
The task of the integration test is to check that components or software applications, e.g. components in a software system or – one step up – software applications at the company level – interact without error.
Test Results:All the test cases mentioned above passed successfully. No defects encountered.
Acceptance Testing
User Acceptance Testing is a critical phase of any project and requires significant participation by the end user. It also ensures that the system meets the functional requirements.
Test Results:All the test cases mentioned above passed successfully. No defects encountered.
RESULTS & CONCLUSION
In this research paper, we studied algorithms for content placement and scheduling in wireless
broadcast networks. While there has been significant work on content caching algorithms, there is much less on the interaction of caching and networks. Converting the caching and load balancing problem into one of queueing and scheduling is hence interesting. We considered a system in which both inelastic and elastic requests coexist. Our objective was to stabilize the system in terms of finite queue lengths for elastic traffic and zero average deficit value for the inelastic traffic. We showed how an algorithm that jointly performs scheduling and placement in such a way that Lyapunov drift is minimized is capable of stabilizing the system. In designing these schemes, we showed that knowledge of the arrival process is of limited value to taking content placement decisions. We incorporated the cost of loading caches in our problem with considering two different models. In the first model, cost corresponds to refreshing the caches with unit periodicity. In the second model relating to inelastic caching with expiry, we directly assumed a unit cost for replacing each content after expiration. A max-weight-type policy was suggested for this model, which can stabilize the deficit queues and achieves an average cost that is arbitrarily close to the minimum cost.
REFERENCES
[1] N. Abedini and S. Shakkottai, “Content caching and scheduling in wireless broadcast networks with elastic and inelastic traffic,” in Proc. IEEE WiOpt, 2011, pp. 125–132.
[2] I. Hou, V. Borkar, and P. Kumar, “A theory of QoS for wireless,” in Proc. IEEE INFOCOM, Rio de Janeiro, Brazil, Apr. 2009, pp. 486–494.
[3] R. M. P. Raghavan, Randomized Algorithms. NewYork,NY,USA: Cambridge Univ. Press, 1995.
[4] P. Cao and S. Irani, “Cost-awareWWWproxy caching algorithms,” in Proc. USENIX Symp. Internet
Conference Chair:Prof.Dr.G.ManojSomeswar, Director General, Global Research Academy, Hyderabad, [5] K. Psounis and B. Prabhakar, “Efficient
randomized Web-cache replacement schemes using samples from past eviction times,” IEEE/ACM Trans.
Netw., vol. 10, no. 4, pp. 441–455, Aug. 2002.
[6] N. Laoutaris, O.T. Orestis, V.Zissimopoulos, and I. Stavrakakis, “Distributed selfish replication,” IEEE
Trans. Parallel Distribution Systems, vol. 17, no. 12,
pp. 1401–1413, Dec. 2006.
[7] S. Borst, V. Gupta, and A. Walid, “Distributed caching algorithms for content distribution networks,”
in Proc. IEEE INFOCOM, San Diego, CA, USA, Mar.
2010, pp. 1–9.
[8] L. Tassiulas and A. Ephremides, “Stability properties of constrained queueing systems and scheduling policies for maximum throughput in multihop radio networks,” IEEE Trans. Autom.
Control, vol. 37, no. 12, pp. 1936–1948, Dec. 1992.
[9] X. Lin and N. Shroff, “Joint rate control and scheduling in multihop wireless networks,” in Proc.
43rd IEEE CDC, Paradise Islands, Bahamas, Dec.
2004, vol. 2, pp. 1484–1489.
[10] A. Stolyar, “Maximizing queueing network utility subject to stability: Greedy primal-dual algorithm,”
Queueing Syst. Theory Appl., vol. 50, no. 4, pp. 401–
457, 2005.
[11] A. Eryilmaz and R. Srikant, “Joint congestion control, routing, and MAC for stability and fairness in wireless networks,” IEEE J. Sel. Areas Commun., vol. 24, no. 8, pp. 1514–1524, Aug. 2006.
[12] J. Jaramillo and R. Srikant, “Optimal scheduling for fair resource allocation in ad hoc networks with elastic and inelastic traffic,” in Proc. IEEE
INFOCOM, San Diego, CA, USA, Mar. 2010, pp. 1–9.
[13] M. M. Amble, P. Parag, S. Shakkottai, and L. Ying, “Content-aware caching and traffic management in content distribution networks,” in Proc. IEEE
INFOCOM, Shanghai, China, Apr. 2011, pp. 2858–
2866.
[14] M. Neely, “Energy optimal control for time-varying wireless networks,” IEEE Trans. Inf. Theory, vol. 52, no. 7, pp. 2915–2934, Jul. 2006.
[15] F. Foster, “On the stochastic matrices associated with certain queueing processes,” Ann. Math. Statist., vol. 24, pp. 355–360, 1953.