Indian Agricultural Trade Performance under WTO Regime
Vikas Kumar & Sunil Phougat
Research Scholar, Department of Economics, M.D. University Rohtak (Haryana)
Assistant Professor, Department of Economics, Govt. College Jassia, Rohtak (Haryana)
Abstract
The present paper is an attempt to evaluate the trade performance of Indian agriculture in the regime of WTO. The trade analysis of the ten commodities under this study shows that India has been benefitted to a great extent by establishment of WTO. Trade performance of the commodities has been remarkable and it has been very favorable for India that it has accessed new markets for its non-traditional products. It is growing with initial volume and value which is considerable for a new commodity under export. India has great potential for increasing its agricultural exports. But this requires large investment in processing, power, communication, marketing, transport and other infrastructure facilities so that India’s agricultural export can better compete in the world market.
Keywords: WTO, India, Agriculture, Export, Trade Performance
I Introduction
Trading of mechanical, technological, electronics, electrical or any production from factories and plants is far manageable and easy in comparison to the trading of agriculture produces. Factory made products are most likely to bear common characteristics, weight, quality and they are easy to pack, process and dispatch, while, on the other hand, agriculture production remains widely differed in quality, weight and other characteristics. For instance, wheat produced in North India and middle part of India remains different in quality and thus
preference of local as well as overseas markets tends to change for purchase of wheat. Accordingly rice and tea leaves, spices and fruits all have their regional specialties and are being traded largely on the basis of these specialties. When, it comes to trade performance of Indian agriculture under WTO, trade performance of Indian agriculture should be done to assess whether joining WTO has been meaningfully useful for India or it just made our markets available to developed nations. India has been the founder member of WTO when it came into existence on January 1, 1995. WTO provisions related to international trade are now similarly applicable to agriculture which was brought within the fold of GATT. Applications of WTO provisions on agriculture contain many contentious issues and are an area of serious concern for India which is primarily an agrarian economy. Moreover the world, despite growing interdependence and integration is highly heterogeneous with regards to level of development.
farmers, agriculture is still a medium of livelihood and not an occupation and it is still being carried out in most traditional way. Indian farmers are mostly involved in subsistence farming with very little or no marketable surplus. While in the developed countries, agriculture is treated as an industry and being supported by all necessary means and agriculture surplus production is as far as possible being marketed and sold in international markets with proactive support from the government.
II Objective of the Study
The present paper is an attempt to evaluate the trade performance of Indian agriculture in the regime of WTO. In this way, the objective of the study is to analyze trade performance of Indian agricultural commodities under WTO regime.
III Methodology
In the present study, secondary data is used for analysis and collected from various sources i.e. DGCIS Kolkata, Agricultural Statistics at a Glance, Economic Survey etc. The study period has been taken from 1995-96 to
2014-15. Annual compound growth rate has been used to analyze the data.
IV Indian Agriculture Trade
Performance under WTO Regime
During last two decades India’s agricultural exports as a part of total merchandise exports have continued to decline from the preponderant position they occupied in the pre-independence. But with the achievement of self-sufficiency in food grains and some other major agricultural commodities, which used to account for large portion of import bill, overall imports of agricultural commodities have sharply declined. The outlay on agricultural imports as a proportion of earnings from agricultural exports has progressively declined, and all the balance has become progressively more favorable. Discussion on these issues has, naturally, to take into account the new trade regime as the stated objective to study the performance of India’s agricultural trade under
WTO regime. Commodity wise trade
performance of Indian agriculture under WTO regime has been analyzed as:
Table 1
Wheat Trade in Post WTO Period
Export Import Net Trade Value
Year Qty(in mt) Value (in. Rs. Crore)
Qty(in mt) Value (in. Rs. Crore)
Value (in Rs. Crore)
1995-96 632477.36 366.76 8242.76 10.39 356.37
1996-97 114596.72 698.45 612687.77 403.76 294.69
1997-98 1521.23 0.40 1485787.37 988.98 -988.58
1998-99 1762.21 1.36 1803702.61 1164.78 -1163.42
1999-00 N.A 0.00 1365971.23 773.35 -773.35
2000-01 813492.28 415.09 4221.71 2.87 412.22
2001-02 2649380.23 1330.21 1352.27 0.84 1329.37
2002-03 3671253.97 1759.87 N.A. 0.00 1759.87
2004-05 2009343.03 1459.82 N.A. 0.00 1459.82
2005-06 746163.28 557.53 N.A. 0.00 557.53
2006-07 46633.21 35.35 6079561.31 5850.49 -5815.14
2007-08 237.27 0.24 1793210.70 2657.51 -2657.27
2008-09 1120.52 1.46 20.56 0.01 1.45
2009-10 47.30 0.06 164382.72 49.34 -49.28
2010-11 394.47 0.07 185280.33 55.62 -55.55
2011-12 740746.76 1023.27 21.45 0.02 1023.25
2012-13 6514810.60 10529.00 2943.89 1.11 10527.89
2013-14 5562374.74 9261.61 11271.39 4.42 9257.19
2014-15 3924070.18 4991.84 27973.19 9.53 4982.31
Total 45699.42
CAGR (%) 10.08 14.73 6.64 0.45 14.89
Note: N.A. (Not Available)
Source: 1. Directorate General of Commercial Intelligence and Statistics, Kolkata, Various Issues
2.
www.wto.org/home/resources/statistics/statistic database
3. www.rbi.org.in & RBI Bulletins on Indian Foreign Trade
4. Agriculture Statistics at a Glance, Various Issues
5. Economic Survey, Various Issues.
It is cleared from Table 1 that the analysis of the wheat trade in post WTO period shows a mixed and uncertain trend. During the period of 1995-96 with the export trade value of Rs. 366.76 crore with total imports of Rs. 10.39 crore. 1996-97 witnessed growth in both exports and imports with export value Rs. 698.45 crore and import value Rs. 403.76 crore. Year 1997-98 was having total imports of Rs. 988.98 crore against the export value of only Rs. 0.4 crore. Situation remained the same in coming year with export of Rs. 1.36 crore and imports of Rs. 1164.78 crore. The export of wheat in 1997-98 to 1999-2000 witnessed a sudden dip because of heavy domestic consumption and government restrictions on exports in order to meet the domestic
requirements first. Secondly pricing of the wheat for the said period remained another factor which resulted into decreased exports. Pricing of U.S. wheat against wheat produced in India had a considerable difference of US$ 20-38 per ton. This difference of pricing also contributed into decreased exports. Relaxation in government’s restrictions, plentiful production & corrected and competitive pricing helped India to export significant volumes of wheat from year 2000-01 onwards till 2004-05 and recorded a fall in the exports in 2005-06 onwards till 2011-12. Post 2000-01, lowest of the wheat export was recorded in 2009-10. It was Rs. 0.06 crore. In 2011-12, wheat trade volume and value recorded a new height with total quantity exported 740746.76 metric tonne with value of Rs. 1023.27 crore. The surge in the trade continued since then with latest wheat export figures of 2014-15 at Rs. 4991.84 crore. On the imports side, in 2006 - 07 India imported total of Rs. 5850.49 crore and since then it has been on reducing side with least imports of Rs. 0.01 crore in the year 2008-09.
in the period from 1995-96 to 2014-15. As in the above table, the growth in exports was much higher than in imports during the study
period, in quantity (10.08 and 6.64 per cent) as well as in values (14.73 and 0.45 per cent) of wheat exports and imports respectively.
Table 2
Basmati Rice Trade in post WTO period
Export Import Net Trade Value
Year Qty(in mt) Value (in. Rs. Crore) Qty(in mt) Value (in. Rs. Crore) Value (in Rs. Crore)
1995-96 373312.98 850.67 82.15 0.05 850.62
1996-97 523166.88 1247.60 0.00 0.02 1247.58
1997-98 593326.18 1685.60 50.87 0.06 1685.54
1998-99 597796.95 1876.90 6653.58 5.40 1871.50
1999-00 638381.86 1780.30 34993.02 29.95 1750.35
2000-01 851717.70 2154.90 13192.81 17.78 2137.12
2001-02 666713.64 2165.95 61.55 0.07 2165.88
2002-03 710156.21 1841.78 872.09 1.09 1840.69
2003-04 771475.37 2062.14 541.11 0.27 2061.87
2004-05 1162989.16 1993.05 0.00 0.00 1993.05
2005-06 1156562.79 3043.09 263.77 0.34 3042.75
2006-07 1045714.95 2792.81 165.99 0.41 2792.40
2007-08 1183355.73 4344.58 152.36 0.42 4344.16
2008-09 1556411.06 9477.03 0.00 0.00 9477.03
2009-10 2016775.33 10889.13 0.00 0.00 10889.13
2010-11 2370658.39 11354.63 0.00 0.00 11354.63
2011-12 3178174.43 15449.60 461.50 0.52 15449.08
2012-13 3459898.93 19409.39 0.00 0.00 19409.39
2013-14 3757271.42 29299.96 0.00 0.00 29299.96
2014-15 3702260.07 27597.89 0.00 0.00 27597.89
Total 151260.62
CAGR
(%) 12.83 20.10 NA NA 20.10
Source: Same as Table 1.
It is cleared from Table 2 that the trade like rice has been mainstay of India’s agricultural export. It has been designated as main commodity in the international market from Indian subcontinent. Basmati rice, especially from Indian region has a huge demand and attracts a comparatively fair value from international buyers. During the period of 1995-96 India had exported basmati rice of total of Rs. 850.67 crore and imported were Rs.
2007-08 and Rs. 9477.03 crore in 202007-08-09. Exports of Basmati rice crossed Rs. 10000 crore in 2009-10 and of recent the total export value of the basmati rice was Rs. 19409.39 crore in 2012-13, Rs. 29299.96 crore in 2013-14 and Rs. 27597.89 crore in 2014-15.
In total, trade of the basmati rice helped India to earn Rs. 151260.62 crore in international trade in post WTO period. The growth in Basmati Rice exports was in quantity 12.83 per cent and 20.10 per cent in total exports and in total trade.
Table 3
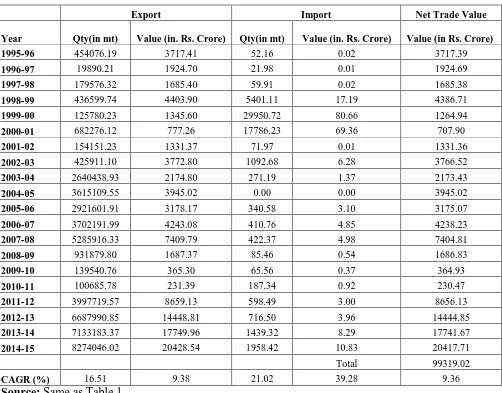
Non-Basmati Rice Trade in Post WTO Period
Export Import Net Trade Value
Year Qty(in mt) Value (in. Rs. Crore) Qty(in mt) Value (in. Rs. Crore) Value (in Rs. Crore)
1995-96 454076.19 3717.41 52.16 0.02 3717.39
1996-97 19890.21 1924.70 21.98 0.01 1924.69
1997-98 179576.32 1685.40 59.91 0.02 1685.38
1998-99 436599.74 4403.90 5401.11 17.19 4386.71
1999-00 125780.23 1345.60 29950.72 80.66 1264.94
2000-01 682276.12 777.26 17786.23 69.36 707.90
2001-02 154151.23 1331.37 71.97 0.01 1331.36
2002-03 425911.10 3772.80 1092.68 6.28 3766.52
2003-04 2640438.93 2174.80 271.19 1.37 2173.43
2004-05 3615109.55 3945.02 0.00 0.00 3945.02
2005-06 2921601.91 3178.17 340.58 3.10 3175.07
2006-07 3702191.99 4243.08 410.76 4.85 4238.23
2007-08 5285916.33 7409.79 422.37 4.98 7404.81
2008-09 931879.80 1687.37 85.46 0.54 1686.83
2009-10 139540.76 365.30 65.56 0.37 364.93
2010-11 100685.78 231.39 187.34 0.92 230.47
2011-12 3997719.57 8659.13 598.49 3.00 8656.13
2012-13 6687990.85 14448.81 716.50 3.96 14444.85
2013-14 7133183.37 17749.96 1439.32 8.29 17741.67
2014-15 8274046.02 20428.54 1958.42 10.83 20417.71
Total 99319.02
CAGR (%) 16.51 9.38 21.02 39.28 9.36
Source: Same as Table 1.
It is cleared from Table 3 that the basmati rice had given Indian international trade an upper hand, non basmati rice had supported this export by a considerable figure. There have been imports of basmati rice off and on, but the import trade value has been negligible as
compared to the export volume of the same years.
exports of 4403.90 crore. Coming seven trading years had considerable exports but valued less than Rs. 4000 crore. In year 2006-07, export volume grew to 3702191.99 metric tonne and valued Rs. 4243.08 crore. Next year was super year for exports and non basmati rice export recorded an almost double digit growth with total export trade value of Rs. 7409.79 crore. Coming three years from 2008-09 to 2010-11 were disappointing for exports as the total export of the three year put together were mere approximately Rs. 2200 crore. Though the exports resumed the rising trend in 2011-12 with total traded volume of 3997719.57 metric tonne valued Rs. 8659.13 crore. Next year 2012-13 added another Rs. 6000 crore and total of exports raised to Rs. 14448.81 crore. Year 2013-14 clocked exports valued Rs. 17749.96 crore and the year 2014-15 ended with magical figure of total export of 8274046.02 metric tonne and valued Rs. 20428.54 crore. The
import of the non basmati rice was in declining trend and it recorded as low as Rs. 0.01 crore value import in 1996-97, almost negligible value in year 2004-05, Rs. 0.37 crore in 2009-10 and in the year 2014-15 it was Rs. 2009-10.83 crore only.
The exports and imports of the non-basmati rice in post WTO period. India was able to earn Rs.103264.04 crore in total and it can be concluded that trade of non basmati rice has been beneficial for India and WTO’s role has helped us in reaching this trade position in international market. As in the above table, the growth in imports was much higher than in exports during the study period, of quantity (16.51and 21.02 per cent) as well as of values (9.38 and 39.28 per cent) of wheat exports and imports respectively while the net trade value has a growth of 9.36 per cent during the same phase.
Table 4
Cashew Trade in Post WTO Period
Export Import Net Trade Value
Year Qty(in mt) Value (in. Rs. Crore)
Qty(in mt) Value (in. Rs.
Crore) Value (in Rs. Crore)
1995-96 70076.98 1235.70 222821.17 760.08 475.62
1996-97 68862.35 1285.50 212865.95 687.57 597.93
1997-98 76903.78 1399.90 246201.86 767.19 632.71
1998-99 77286.54 1627.50 243354.77 968.76 658.74
1999-00 92321.92 2456.60 256002.54 1198.26 1258.34
2000-01 89165.43 2049.60 249321.66 960.85 1088.75
2001-02 98211.09 1788.68 161793.09 431.14 1357.54
2002-03 129437.34 2052.90 402987.51 1236.24 816.66
2003-04 99683.65 1699.80 442596.61 1371.80 328.00
2004-05 118112.45 2477.20 479710.07 1804.96 672.24
2005-06 125101.67 2584.70 543942.04 2089.46 495.24
2006-07 122783.23 2291.20 586493.32 1820.75 470.45
2007-08 111283.54 2209.73 591616.66 1714.24 495.49
2008-09 100663.32 2095.44 678456.78 1802.32 293.12
2009-10 107469.91 2801.58 755956.87 3047.50 -245.92
2011-12 107812.23 4390.16 811903.32 5381.43 -991.27
2012-13 104092.78 4061.21 898521.39 5433.91 -1372.70
2013-14 120737.94 5095.49 776334.78 4667.80 427.69
2014-15 134567.29 5565.77 940813.23 6599.74 -1033.97
Total 6594.98
CAGR (%) 3.49 8.24 7.88 12.05 NA
Source: Same as Table 1.
It is cleared from Table 4 that the cashew is one of the main commodities which are exported from India worldwide and unlike rice and wheat, this commodity has been having more consistent in international market. And it is evident from the table shown above that this commodity has been imported as well throughout the study period i.e. 1995-96 to 2014-15. In the year 1995-96, India exported a total of 70076.98 metric tonne of cashew valued Rs.1235.70 crore while imports were for Rs. 760.08 crore. Export by trading value in Rs. crore kept growing till 1999-2000 when it recorded export value of Rs. 2456.60 crore but witnessed a little slump in the years 2000-01 to 2003-04. It was Rs. 1699.80 crore in 2003-04. Export increased in the years to follow and crossed Rs. 2400 crore in 2004-05. It was above Rs. 2500 crore in the next year but remained under Rs. 2400 crore till 2008-09. Year 2009-10 onwards, exports grew at remarkable pace with total export value over Rs. 4000 crore, being Rs. 4390.16 crore in
2011-12, Rs. 5095.49 crore in 2013-14 and Rs.5565.77 crore in 2014-15.
Cashew, imports too have been on increasing side. The imports remained between Rs. 1000 crore to Rs. 2000 crore up to 2008-09, it crossed Rs. 3000 crore in 2009-10. Also it is important to note that year 2009-10 had imports exceeds exports by Rs. 245.92 crore. Similarly in the years to come 2011-12 and 2012-13 had imports more than exports. 2013-14 had exports slightly higher than imports, but in 2014-15 again imports exceeded by Rs. 1033.97 crore.
As a comparison, it was noticed that total trade of Cashew helped India to gain Rs. 6594.66 crore in last 20 years from 1995-96 to 2014-15. As far as growth rate is concerned the imports increased with higher rate than the exports in form of quantity (7.88 and 3.49 per cent) and as well as in value (12.05 and 8.24 per cent) of imports and exports respectively.
Table 5
Pulses Trade in Post WTO Period
Export Import Net Trade Value
Year
Qty(in mt)
Value (in. Rs.
Crore) Qty(in mt)
Value (in. Rs. Crore)
Value (in Rs. Crore)
1995-96 61367.13 131.91 490754.98 685.57 -553.66
1996-97 55229.23 131.58 654910.14 890.34 -758.76
1997-98 168056.87 360.89 1008162.64 1194.64 -833.75
1998-99 10412.69 223.03 563601.55 708.81 -485.78
1999-00 194187.66 419.56 250772.23 354.69 64.87
2001-02 161981.85 370.47 2217821.43 3160.16 -2789.69
2002-03 151685.06 352.34 1992290.88 2737.05 -2384.71
2003-04 152774.18 325.57 1723332.51 2284.87 -1959.30
2004-05 266987.85 589.85 1339453.30 1777.58 -1187.73
2005-06 451626.05 1124.66 1695954.43 2476.25 -1351.59
2006-07 255084.47 789.99 2270979.09 3891.91 -3101.92
2007-08 170614.39 549.01 2791106.77 5278.02 -4729.01
2008-09 136880.08 542.32 2593689.40 6393.06 -5850.74
2009-10 100130.94 408.32 3750005.04 10176.88 -9768.56
2010-11 209010.49 870.04 2777827.82 7349.17 -6479.13
2011-12 174625.18 1067.93 3495844.53 8857.85 -7789.92
2012-13 202751.36 1285.01 4019695.04 11035.53 -9750.52
2013-14 345051.38 1746.37 3178264.11 8228.12 -6481.75
2014-15 220914.58 1209.50 4001965.78 14113.98 -12904.48
Total -79056.54
CAGR (%) 6.97 12.37 11.68 17.26 -29.84
Source: Same as Table 1.
It is cleared from Table 5 that the pulses, as a trading commodity has been more on imports than exports from India. Exports of pulses from India have been marginally very less as compared to imports. Indian exports of pulses were Rs. 131.91 crore till 1995-96 and it remained between Rs. 100 crore to 1000 crore up to 2009-10 except the tear 2005-06 when Indian exports were Rs. 1124.66 crore. Year 2011-12 onwards exports remained above Rs. 1000 crore being Rs. 1209.50 crore in 2014-15. Highest exports of the pulses from India were recorded in 2013-14 for Rs. 1746.37 crore.
In imports, imports had been Rs. 200 crore to Rs. 1000 crore till year 2000-01 with an
exception in the year in 1997-98, when imports were Rs. 1194.64 crore. Year 2001-02 onwards, exports generally have been above Rs. 2000 crore recording the highest trade in the year 2014-15 with imports costing Rs. 14113.98 crore. This wide gap between imports and exports resulted into the shelling out of Rs. 79056.54 crore for purchasing of the stock of pulses. As far as growth rate is concerned the imports increased with higher rate than the exports in form of quantity (11.68 and 6.97 per cent) and as well as in value (17.26 and 12.37 per cent) of imports and exports respectively.
Table 6
Sugar Trade in Post WTO Period
Export Import Net Trade Value
Year Qty(in mt) Value (in. Rs. Crore)
Qty(in mt)
Value (in. Rs. Crore) Value (in Rs. Crore)
1995-96 863721.30 506.40 150631.89 215.89 290.51
1996-97 667278.90 860.80 2130.19 3.18 857.62
1998-99 12743.43 17.36 900472.25 1111.22 -1093.86
1999-00 13004.65 18.14 1181181.45 1110.80 -1092.66
2000-01 338692.71 430.98 30407.56 31.11 399.87
2001-02 1456502.72 1728.29 25583.33 32.60 1695.69
2002-03 1662409.81 1769.50 41431.14 32.83 1736.67
2003-04 1200612.76 1216.60 74409.90 62.70 1153.90
2004-05 108696.60 149.53 932746.67 976.18 -826.65
2005-06 321202.28 569.10 558773.31 651.59 -82.49
2006-07 1643401.65 3127.50 1053.59 3.48 3124.02
2007-08 4641117.82 5404.18 510.32 2.29 5401.89
2008-09 4734598.97 5289.65 113427.90 287.98 5001.67
2009-10 44736.98 110.21 2551416.00 5965.80 -5855.59
2010-11 1733871.54 5472.79 1034584.65 2789.54 2683.25
2011-12 2749428.71 8766.78 99713.60 313.83 8452.95
2012-13 2793778.81 8576.32 1122240.41 3094.38 5481.94
2013-14 2477640.34 7178.50 880956.63 2286.86 4891.64
2014-15 195441.41 5326.66 1538635.70 3668.21 1658.45
Total 33653.02
CAGR (%) -7.52 13.18 13.01 16.08 9.60
Source: Same as Table 1.
It is cleared from Table 6 that India has been self reliant in certain agricultural produces, Sugar, being one of them. Haryana, Punjab, Maharastra, Pune, Uttar Pradesh are the leading states into sugarcane growing. As a result of which India has been in a position to have surplus stock of sugar to export. India had been having the total exports of sugar more than the imports in most of the years 1995 onwards except some years. In the year 1995-96 export of suger were 506.40 crore exceeding imports by 215.89 crore and 860.80 crore in 1996-97. But then imports overtook exports for next three year from 1997-98 to 1999-2000. Exports again improved in 2000-2001 when exports of sugar were Rs. 430.98 crore and imports were Rs.31.11 crore and remained in positive figures
till 2003-04. Year 2004-05 had imports exceeding exports by Rs. 826.65 crore and next year 2005-06 had net imports exceeding exports by Rs. 82.49 crore. In the years to come till 2014-15, sugar exports were exceeding the imports by considerable margin except the imports of sugar in year 2009-10 when Indian sugar exports were Rs. 110.21 crore against imports of Rs. 5965.80 crore. This trading of sugar in last 20 years has helped India to garner Rs. 33653.02 crore. Thus, it can be concluded that trading of sugar has been favorable for India in post WTO period. In the case of CAGR the imports (16.08 per cent) increased with the higher rate than the exports (13.18 per cent), and the total trade has increased with 9.60 per cent of CAGR.
Table 7
Cotton Trade in Post WTO Period
Year Qty(in mt) Value (in. Rs. Crore)
Qty(in mt)
Value (in. Rs. Crore)
Value (in Rs. Crore)
1995-96 33287.78 203.54 69621.23 521.23 -317.69
1996-97 269587.72 1574.50 2929.93 31.56 1542.94
1997-98 157532.23 821.89 9973.54 80.65 741.24
1998-99 41963.65 206.92 57406.87 381.11 -174.19
1999-00 15910.72 77.07 237404.81 1253.93 -1176.86
2000-01 29762.45 221.07 212365.51 1184.73 -963.66
2001-02 8231.42 42.69 387043.33 2053.62 -2010.93
2002-03 11754.69 50.28 233854.76 1237.61 -1187.33
2003-04 179610.09 942.37 252906.52 1570.03 -627.66
2004-05 86643.87 422.58 192187.86 1135.56 -712.98
2005-06 614802.23 2904.40 98754.51 703.66 2200.74
2006-07 116221.29 6107.80 81487.62 663.07 5444.73
2007-08 141754.42 7999.69 136342.21 911.89 7087.80
2008-09 100954.76 5899.02 100491.04 758.90 5140.12
2009-10 - 9537.08 - 1241.37 8295.71
2010-11 - 13162.42 - 622.24 12540.18
2011-12 - 21624.24 - 1059.91 20564.33
2012-13 - 20276.51 232554.37 2466.74 17809.77
2013-14 1947700.00 22337.84 180974.54 2375.78 19962.06
2014-15 1142534.00 11642.64 258.90 3101.08 8541.56
Total 102700.52
CAGR
(%) 20.45 23.74 -25.51 9.84 51.20
Note: - data not available
Source: Same as Table 1.
It is cleared form the Table 7 that one of the oldest commodities traded in international market place by India is Cotton. Trading of cotton has been centuries old and demand for cotton has been consistent in England, cross border and overseas markets. In the year 1995-96 and 191995-96-97, India exported cotton of Rs. 203.54 crore and Rs. 1574.50 crore respectively. In the table given above, trading volume and value for some of the years have been marked by dash (-) for the reason of unavailability of authorized data. Exports have been above Rs. 100 crore to 12000 crore except
from international market place. Being favorable to nation, we can watch that in post WTO period has helped the nation in international trading of cotton. In the case of
CAGR the exports (23.74 per cent) increased with the higher rate than the imports (9.84 per cent), and the total trade has increased with 51.20 per cent of CAGR.
Table 8
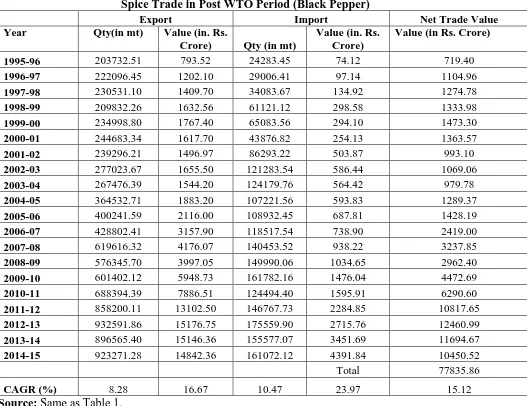
Spice Trade in Post WTO Period (Black Pepper)
Export Import Net Trade Value
Year Qty(in mt) Value (in. Rs.
Crore) Qty (in mt)
Value (in. Rs. Crore)
Value (in Rs. Crore)
1995-96 203732.51 793.52 24283.45 74.12 719.40
1996-97 222096.45 1202.10 29006.41 97.14 1104.96
1997-98 230531.10 1409.70 34083.67 134.92 1274.78
1998-99 209832.26 1632.56 61121.12 298.58 1333.98
1999-00 234998.80 1767.40 65083.56 294.10 1473.30
2000-01 244683.34 1617.70 43876.82 254.13 1363.57
2001-02 239296.21 1496.97 86293.22 503.87 993.10
2002-03 277023.67 1655.50 121283.54 586.44 1069.06
2003-04 267476.39 1544.20 124179.76 564.42 979.78
2004-05 364532.71 1883.20 107221.56 593.83 1289.37
2005-06 400241.59 2116.00 108932.45 687.81 1428.19
2006-07 428802.41 3157.90 118517.54 738.90 2419.00
2007-08 619616.32 4176.07 140453.52 938.22 3237.85
2008-09 576345.70 3997.05 149990.06 1034.65 2962.40
2009-10 601402.12 5948.73 161782.16 1476.04 4472.69
2010-11 688394.39 7886.51 124494.40 1595.91 6290.60
2011-12 858200.11 13102.50 146767.73 2284.85 10817.65
2012-13 932591.86 15176.75 175559.90 2715.76 12460.99
2013-14 896565.40 15146.36 155577.07 3451.69 11694.67
2014-15 923271.28 14842.36 161072.12 4391.84 10450.52
Total 77835.86
CAGR (%) 8.28 16.67 10.47 23.97 15.12
Source: Same as Table 1.
It is cleared from Table 8 that Indian spices have been in demand worldwide. Last century witnessed a mammoth shift in the demand of spices with some business conglomerates taking the exports of spice to professional level and accessing the new markets along with the traditional markets. Adoption of international
have been categorized as a group as it contains many constituents. In the last three years i.e. 2012-13 to 2014-15, Indian exports of spices were above Rs. 45000 crore against imports of Rs. 10500 crore. This could earn India Rs.
77835.86 crore from export of spices only. In the case of CAGR the imports (23.97 per cent) increased with the higher rate than the exports (16.67 per cent), and the total trade has increased with 15.12 per cent of CAGR.
Table 9
Tea Trade in post WTO period
Export Import Net Trade Value
Year Qty(in mt) Value (in. Rs. Crore) Qty(in mt) Value (in. Rs. Crore)
Value (in Rs. Crore)
1995-96 158756.71 1171.11 0.00 0.00 1171.11
1996-97 179554.54 1037.10 0.00 0.00 1037.10
1997-98 19370.22 1876.30 0.00 0.00 1876.30
1998-99 21041.41 2264.90 0.00 0.00 2264.90
1999-00 179312.17 1784.70 5062.23 25.61 1759.09
2000-01 187439.97 1788.70 10872.54 41.44 1747.26
2001-02 180111.24 1719.22 10317.56 67.01 1652.21
2002-03 182863.28 1652.10 23645.59 125.30 1526.80
2003-04 177779.71 1637.40 10772.56 64.60 1572.80
2004-05 183402.60 1840.30 31765.35 146.92 1693.38
2005-06 162867.21 1730.71 18751.24 108.14 1622.57
2006-07 185636.22 1969.50 23296.87 127.06 1842.44
2007-08 198554.36 2022.32 19843.56 131.66 1890.66
2008-09 196587.56 2089.57 25635.89 135.69 1953.88
2009-10 207839.07 2943.53 34459.38 276.52 2667.01
2010-11 238146.24 3354.34 20824.06 202.35 3151.99
2011-12 271983.56 4078.53 22429.49 218.19 3860.34
2012-13 268799.83 4718.79 22301.54 274.52 4444.27
2013-14 249907.56 4873.34 22739.48 291.68 4581.66
2014-15 215209.62 4166.14 27445.24 388.73 3777.41
Total 46093.18
CAGR (%) 1.61 6.91 11.93 19.88 6.36
Source: Same as Table 1.
It is cleared from Table 9 that tea export from India has always been higher than imports of this commodity. With the start of British rule in India, this commodity came in picture as a main trading commodity and its overseas
overseas demand. Study duration of this research work i.e. 1995-96 to 2014-15 started with exports of Rs. 1171.11 crore in 1995-96 and remained between Rs.1000 crore to Rs. 2000 crore till 2006-07. In the year 2007-08, total exports crossed Rs. 2000 crore and in recent years 2013-14 to 2014-15 it was above Rs. 4000 crore.
On import side, negligible imports were recorded for four years in a row i.e. from 1995-96 to 1998-99. In 1999-2000 total imports were Rs. 25.61 crore which has been
reached to Rs. 388.73 crore in 2014-15, being the highest import of tea by volume and value. The export exceeding import earned India Rs. 46093.18 crore. Thus, it’s concluded that India got a fair price of tea in international markets which has been made available under trade agreements by WTO members and other regional trade organizations. India faces a stiff competition in export of tea from Sri Lanka. In the case of CAGR the imports (19.88 per cent) increased with the higher rate than the exports (6.91 per cent), and the total trade has increased with 6.36 per cent of CAGR.
Table 10
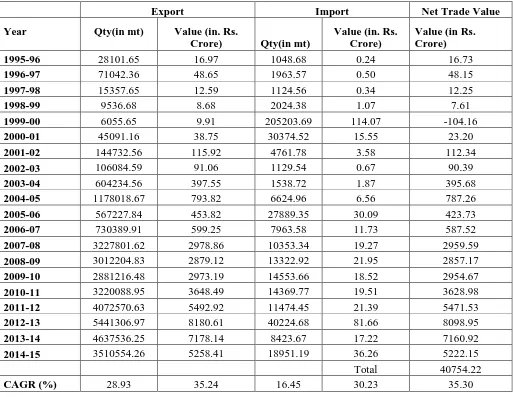
Other Cereals Trade in Post WTO Period
Export Import Net Trade Value
Year Qty(in mt) Value (in. Rs.
Crore) Qty(in mt)
Value (in. Rs. Crore)
Value (in Rs. Crore)
1995-96 28101.65 16.97 1048.68 0.24 16.73
1996-97 71042.36 48.65 1963.57 0.50 48.15
1997-98 15357.65 12.59 1124.56 0.34 12.25
1998-99 9536.68 8.68 2024.38 1.07 7.61
1999-00 6055.65 9.91 205203.69 114.07 -104.16
2000-01 45091.16 38.75 30374.52 15.55 23.20
2001-02 144732.56 115.92 4761.78 3.58 112.34
2002-03 106084.59 91.06 1129.54 0.67 90.39
2003-04 604234.56 397.55 1538.72 1.87 395.68
2004-05 1178018.67 793.82 6624.96 6.56 787.26
2005-06 567227.84 453.82 27889.35 30.09 423.73
2006-07 730389.91 599.25 7963.58 11.73 587.52
2007-08 3227801.62 2978.86 10353.34 19.27 2959.59
2008-09 3012204.83 2879.12 13322.92 21.95 2857.17
2009-10 2881216.48 2973.19 14553.66 18.52 2954.67
2010-11 3220088.95 3648.49 14369.77 19.51 3628.98
2011-12 4072570.63 5492.92 11474.45 21.39 5471.53
2012-13 5441306.97 8180.61 40224.68 81.66 8098.95
2013-14 4637536.25 7178.14 8423.67 17.22 7160.92
2014-15 3510554.26 5258.41 18951.19 36.26 5222.15
Total 40754.22
Note: N.A. (not available)
Source: Same as Table 1.
It is cleared from Table 10 that the other cereal consists of many feed items which are used as primary goods for production of requirement based specific products as per the buyers. Other cereals have been in good demand for the last ten years in particulars. Prior to this, the total export of the other cereals was a very little percentage of total agricultural exports. In the year 1995-96 India exported a total of 28101 metric tonne of other cereals which valued Rs. 16.97 crore and import of the same were for Rs. 0.24 crore in the same year. Leaving apart a little slump in 2002-03, exports for other cereals remained above Rs. 300 crore till 2006-07 (Rs. 299.25 crore) which includes exports of Rs. 793.82 crore in 2004-05. These starting indication had paved the way for larger volume trades in future and it started trading in thousand crore from 2007-08. India fetched Rs. 2978.86 crore from export of other cereals in 2007-08 only and since then it has been higher than this value reporting highest export value of Rs. 7178.14 crore in year 2013-14.
In imports, total import value remained less than Rs. 1.00 crore till 1997-98. And below Rs. 100 crore by latest year under this study i.e. 2014-15 with an exception in the year 1999-2000 when India imported other cereals for Rs. 114.07 crore. This commodity has helped India to earn Rs. 40754.22 crore in international markets. It is expected that the trading volume of this commodity will pick up in the years to come and it will replace some of the individual food grain products in exports. As in the above table, the growth in exports was higher than in imports during the study period, of quantity (28.93 and 16.45 per cent) as well as of values (35.24 and 30.23 per cent) of exports and imports respectively while the net trade value has a growth of 35.30 per cent during the study phase.
V Conclusion
On analysis of the major commodities under this study, it is found that out of total ten commodities only one commodity i.e. pulses had more imports than exports. Rest nine commodities viz. Basmati Rice, Non Basmati Rice, Wheat, Cotton, Tea, Sugar, Spices, other cereals and Cashew, all contributed significantly in gross earnings from exports. As per the latest data release from the Directorate General of Commercial Intelligence and Statistics, Kolkata top commodities in export categories are buffalo meat, rice (basmati & non basmati), poultry products. The new products which are making noticeable progress in recent exports include floriculture, natural honey, dairy products, wood products and paper and alcoholic beverages. While in the imports, pulses, fruits, cocoa and recently the alcoholic beverages are being imported into nation.
The trade analysis of the ten commodities under this study shows that India has been benefitted to a great extent by establishment of WTO. Trade performance of the commodities has been remarkable and it has been very favorable for India that it has accessed new markets for its non-traditional products. It is growing with initial volume and value which is considerable for a new commodity under export. India has great potential for increasing its agricultural exports. But this requires large
investment in processing, power,
communication, marketing, transport and other infrastructure facilities so that India’s agricultural export can better compete in the world market.
References:
[1] Agrawal, Ankita; Basak, Sneka (2012),
International Journal of Innovative Research and Studies, Vol. 1, Issue 1, pp. 1-14.
[2] Bhalla, G.S. (2003), “State of the Indian
Farmer’s: A Millennium Study,
Globalisation and Agricultural
Liberalisation in India”, Ministry of Agriculture, New Delhi.
[3] Bhalla, G.S. and Singh, Gurmal (1996), “Impact of GATT on Punjab Agriculture”,
Institute of Development and
Communication Monograph Series-II,
Ajanta Publications, New Delhi.
[4] Chand, Ramesh (2002), “Trade
Liberalization WTO and Indian
Agriculture”, Mittal Publications, New Delhi.
[5] Dass Gupta S. et al. (2011), “Pricing Distorting Markets: Implications for Developing Economies”, New Century Publications, New Delhi, India, pp.78-85. [6] Debroy, Bibek; Dasgupta, Amit (2003),
“Salvaging the WTO Future: Doha and Beyond”, Konark Publishers, New Delhi.
[7] GOI, Agricultural Statistics at a Glance,
Various Issues, Ministry of Agriculture, Department of Agriculture & Cooperative, New Delhi.
[8] GOI, Economic Survey, Ministry of Finance, Economic Division, Various Issues.
[9] GOI, Monthly Statistics of Foreign Trade,
Various Issues, Director General of Commercial Intelligence and Statistics (DGCIS), Kolkata
[10] Gulati, Ashok; Sharma, Anil (1994), “Agriculture under GATT: What it Holds
for India”, Economic & Political Weekly,
Vol. 29, No. 29, p. 1857. [11] http://www.argicoop.nic.in [12] http://www.commin.nic.in [13] http://www.wto.org
[14] Jayasheela and Vishwantha (2008), “Agriculture Credit in the Post WTO Period”, Agriculture Situation in India, NCAP Pusa, New Delhi.
[15] Jayman et al (2015) “Decreasing Share in International Trade: Big Concern for India” Monthly Economic Digest, Vol. 21, No.8.
[16] L.S.N. Prasad (2012), “WTO Norms and Indian Agriculture”, World Bank Policy Research Working Paper 1164, October.
[17] Phougat, Sunil (2003), “Indian Agricultural Trade Performance: Pre and
Post WTO” Maharshi Dayanand
University Research Journal (Arts), Vol. 2, No. 1, pp. 65-72.
[18] Phougat, Sunil; Kumar, Surender (2009), “Performance and Prospects of India’s Agricultural Export”, Southern Economist, Vol. 48, No. 7, pp. 37-40. [19] R K Mishra, V. Y. Swaminathan
(2013), “WTO’s Role in Bringing Buyers and Seller Closer: How Effective and How Useful?” IUP Journal of International Trade, Vol. VI, No. 2, pp. 23-47.
[20] V. Balasubramanian (2013), “WTO and Indian Agriculture Insight, Implication And Imperatives”, Asian Journal of Business and Management”, Vol. 6, No. 23, 2013.