Design and Implementation of Loss Reduction of
Transmission and Distribution Line Using GSM
Technology and ZIGBEE
Pooja J. Jari
1, Mr. Girish A. Kulkarni
2Department Name: Electronics And Communication Engineering, Position: M.E.Student1, Head-Electronics And Communication Engineering2
SSGB College of Engineering & Technology 1, 2, Bhusawal, Maharashtra (India-425001) Email:[email protected],[email protected]
Abstract- The load monitoring and protection on electrical power lines are important factors in Electricity Field. This paper proposes a design and implementation methodology of a loss reduction of transmission and distribution line using GSM Technology and ZIGBEE. By a proper monitoring and effective communication system, we can automate the fault-finding system of the transmission and distribution line to improve the utility factor, uninterruptible power, reduce losses and save the time thereby saving the cost. A GSM technology is introduced to overcome the above mentioned drawback’s is an open, digital cellular technology used for transmitting mobile data services. In this paper we are transmitting the fault status and fault data of current and voltage when it is over rated. The idea of on-line monitoring system integrates a Global Service Mobile (GSM) Modem; withstand along single chip microcontroller and sensor packages. It is installed at the distribution transformer site and the above parameters are recorded using the analog to digital converter (ADC) of the embedded system. If any abnormality or an emergency situation occurs the system sends SMS (short message service) to the mobile phones containing information about the abnormality according to some predefined instructions programmed in the microcontroller. This GSM system will help the Transmission and Distribution line and transformers to operate smoothly and identify problems before any catastrophic failure.
Keywords: Transmission and distribution line, GSM modem, Zigbee, Microcontroller.
1. INTRODUCTION
During the previous few decades, per capita utilization and demand for electricity has increased tremendously. To meet increased demands and reduce transmission losses high voltage technology was adopted in 1960. Electricity plays a vital role in growth of our country. Even though power
production corporations focusing highly on
generation, transmission and distribution, they are meeting power loss due to illegal consumption of electrical power from the transmission lines by the consumers. Power theft has become a great challenge to the electricity board. The dailies report says that Electricity Board suffers a total loss of 8 % in revenue due to power theft every year, which has to be controlled. This identifies the power theft and indicates it to the Electricity board through GSM network.
In the field of electrical or electronics current and energy consumption, which may effect
has an ability to carry 64 kbps to 120 Mbps of data rates.
The embedded c & visual basic (VB 6.0) version is used to interface hardware and computer for lucid way of communication between human and GSM.
2. SCOPE OF WORK
A Wide scope of work always exists in the field of Electricity power line to analyze and reduce the various losses of transmission and distribution line. Fault analysis in the electricity power line can also perform. Further work can also be carried out for Long-term measures for technical and non technical loss reduction involve all measures that need to be taken for the improvement of quality and reliability of power supply and reduction of technical and commercial losses in a given area. These include upgrading, strengthening and improvement of the sub-transmission and distribution system in a circle to meet the future load demand for the next five years. References are numbered continuously and listed at the end of the report.
3. LITERATURE SURVEY
In Indian Power sector cost of energy and demand is rapidly increasing with respect to other countries. The losses in India are about 20 – 40 % or even more as against 8 – 12 % in the developed countries. Main priorities now days for the Indian power sector are to reduce energy losses in Transmission & Distribution systems so that they can be competitive to the best in the world. Energy losses can occur during supply of electricity to consumers the technical losses is due to energy dissipated in the conductors and equipment
used for transmission, transformation, sub-
transmission and distribution of power. These technical losses are inherent in a system and can be reduced to an optimum level. Pilferage, defective meters, and errors in meter reading and in estimating un-metered supply of energy are causes of commercial losses. It is possible to reduce the losses in a short span of time, if the magnitude of technical and commercial losses is estimated and energy auditing can do this. The flow chart of energy audit process is shown in the figure1.
Fig.1: Flow Chart of the Energy Audit Process
3.1 Transmission and distribution (T & D) losses
In India, the fact is that all energy supplied to a distribution utility does not reach the end consumers. A substantial amount of energy is lost in
the distribution system by way of technical losses. These inherent losses in transmission and distribution
of electrical energy from the generating stations to the ultimate consumers should be reduced by
Walk through survey of the area
Plotting of the HV level (grid level)
Data Collection by AMR system and manually
Analysis of the collected data
Calculation of feeder loss
Report summarizing audit findings
eliminating or minimizing the causes of losses. T & D loss is the difference between units injected into
the system and the units billed to the ultimate consumers, which is generally expressed as
Percentage of units injected. It is generally calculated for a period of one financial year:
Hence, T & D losses (%) = [(Energy input – Energy
billed) X 100]/ Energy input {For a financial year} The transmission and distribution (T & D) losses in
our country, which were around 15% up to 1966-67, increased gradually to 23.28% by 1989-90. After a brief spell of reduction in T & D losses to 21.13% (1994-95), there has been an upswing and the losses reached a level of 33.98% during 2001-02. Since
then, a reducing trend has been observed as T & D losses have come down to 32.54% during 2002-03, 32.53% during 2003-04 and 31.25% during 2004-05. The Transmission and Distribution losses in advanced countries of the world have been ranging between 6 to 11%. Even in many developing countries, T & D losses are less than the level obtaining in India. However, T & D losses in India are not comparable with advanced countries as the system operating conditions there are different from those obtainable in India.
4. METHODOLOGY
[image:3.595.81.519.304.463.2]4.1 Block diagram of system
Fig. 2: Block Diagram Of The System
This system proposing a design and implementation of a real time fault analysis and loss reduction of transmission and distribution line using GSM Technology and Zigbee. To measure and monitor load fluctuations with respect to current and voltage in electric power lines and it also controls the
same when line breaks during high load.
Microcontroller is giving control signals to tripping various equipment provides controlling feature. Output can be displayed in the LCD (Liquid Crystal Display).An Embedded based hardware design is developed and must acquire data from electrical sensing system. A powerful GSM networking is designed to send data from a network to other network. Zigbee is used for transmitting the data on
computer. Any change in parameters of
transmission is sensed to protect the entire transmission and distribution line system.
4.2. Keil c software
Keil software is the leading vendor for
8/16-bit development tools. Keil software is
represented worldwide in more than 40 countries, since the market introduction in 1988. Now, keil
software offers development tools for
MICROCONTROLLER. Keil software makes C compilers, macro assemblers, real-time kernels, debuggers, simulators, integrated environments, and evaluation boards for 8051, 251, ARM and XC16x/C16x/ST10 microcontroller families. KEIL is an excellent application specifically created to address the needs of embedded software engineers and developers. It provides functional tools which help the user control over 8051 microcontroller
architecture. This program serves as a range of well-designed assemblers, debuggers, C compilers, real-time kernels, emulators and single board computers.
It integrates advance technology for 8051 microcontroller derivatives in using KEIL; the user can start his development projects by specifying the microcontroller that he wants to use. After that, the assembler, linker, compiler and memory options are configured by the program’s IDE. There is also a debugger which can be used to simulate the on-chip peripherals of microcontroller. This way, the user can check an application before downloading the code on his system’s hardware. Lastly, the user is allowed to specify his target monitors, adapters and system debuggers. With its functional tools and features, KEIL is definitely a program worth downloading.
5. RESULT AND DISCUSSION
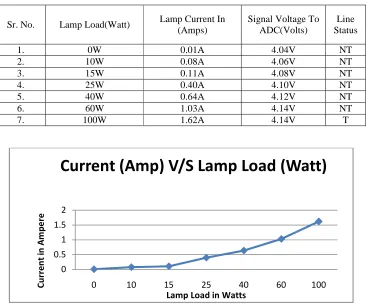
To measuring and monitoring load fluctuations with respect to current and voltage in electric power lines using SMS through GSM network and zigbee is developed using 89C52 microcontroller. The operator can use any mobile phone to send or receive SMS from this system at the control room. The designed system is tested for different loadings (current or voltage). It is found that the system worked efficiently for lower voltages levels up to 180 volts and for higher voltage up to 250 volts, with loading of up to a maximum current 1.6Amps. Using potentiometer we will vary the voltage and current in different phases. The results of the system are satisfactory. Following table and graph shows the readings of current in ampere by using various load lamps of different watts. Results of the system are as shown bellow;
[image:4.595.117.484.364.671.2]Table 1: systems results shown in tabular form Tripping current = 1.6amp (NT=not tripping, T=Tripping)
Fig. 3: system result shown in graphical form of lamp load (watt) v/s current (amp)
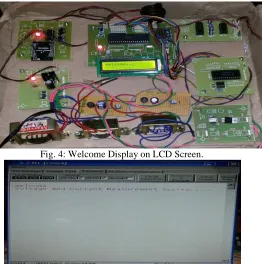
When the system will on that time the welcome message is seen on the LCD display and the same message including voltage and current measurement
system is also displayed on Computer Screen. The photos of that system as shown below.
0 0.5 1 1.5 2
0 10 15 25 40 60 100
C u rr e n t in A m p e re
Lamp Load in Watts
Current (Amp) V/S Lamp Load (Watt)
Sr. No. Lamp Load(Watt) Lamp Current In
(Amps)
Signal Voltage To ADC(Volts)
Line Status
1. 0W 0.01A 4.04V NT
2. 10W 0.08A 4.06V NT
3. 15W 0.11A 4.08V NT
4. 25W 0.40A 4.10V NT
5. 40W 0.64A 4.12V NT
6. 60W 1.03A 4.14V NT
Fig. 4: Welcome Display on LCD Screen.
Fig. 5: Welcome, Current and Voltage Measurement System Display On The Computer Screen.
After giving the welcome message display on the LCD and Computer Screen then system checking the GSM modem is shown in fig.6. When the gsm modem is ready for working then system is
[image:5.595.173.427.471.733.2]connected with zigbee and microcontroller.then gsm modem checking the sim.when sim will connected then system redy for giving information about load voltage and load current is shown in fig.7.
Fig.7: System Connected With GSM Modem.
Fig.8: Checking GSM Network of SIM Card Then Network Connected.
Fig.9: Ready to Work for Voltage and Current Measurement System.
When system is connecting then give the different load of current using various rating of lamps (in watts) for Ex. 15w, 40w, 60w, 100w, etc. If the load current exceeds above 1.3Am by placing different loads the system will trip but for the lower values of current the system works normally, the same
information will be conveyed to the operator and if any problem arises the same can be rectified by sending a suitable SMS through the GSM network. With further modification in the design the voltage and current levels of the load can be increased.
Fig.11: Measuring Voltage and Current By Using 40W Lamp Display On The Computer Screen.
Fig.12: Over Current Measuring System By Using the 100w Lamp.
Above 100 watts Load is applied on the system then the over current message is display on the LCD Screen and also Display on Computer Screen by
using ZIGBEE, and the same message is display on the mobile phone by using GSM technology.
Fig.14: Over Current Message Display on Computer Screen System.
Fig.15: Over Current Message Display on Mobile Phone.
5. CONCLUSIONS
• Fault analysis of transmission and distribution
line using GSM technology and ZIGBEE was done successfully.
• This system find outs the fault status and fault
data of over current and voltage of transmission and distribution line.
• When we increases the lamp load then current is
also increases.
• This system is designed for a maximum load of
1.6Am. If the load current exceeds above 1.3Am by placing different loads the system will trip but for the lower values of current the system works normally, the same information will be conveyed to the operator and if any problem arises the same can be rectified by sending a suitable SMS through the GSM network.
REFERENCES
[1] M. S. Sujatha And M. Vijay Kumar”Real Time Analysis And loss Reduction Of Transmission Line Using Gsm Technology” Asian Research
Publishing Network (ARPN) Journal Of
Engineering Sciences Vol. 7, No. 4, April 2012.
[2] Prof.M.S. Sujatha, Dr. M Vijay Kumar “On-Line Monitoring And Analysis Of Faults In Transmission And Distribution Lines Using Gsm Technique” Journal of Theoretical and Applied Information
Technology 30th November 2011. Vol. 33 No.2.
[3] Luis A. Oquendo Class, Kenneth M.
Hopkinson, Member, IEEE, Xiaoru Wang, Senior Member, IEEE,Todd R. Andel, and Ryan W. Thomas “A Robust communication based – special protectionsystemize transactions on power delivery, vol. 25, no.3, july 2010.
[4] Electrical System,Technology Menu on
Energy Efficiency – NPC
[5] Soham Ghosh JRF, Department of Energy Science & Engineering, IIT Bombay, India”
[6] Abdual-Rehaman Al-Ali,Abdual Khaliq &
Muhammad Arshad, “GSM –Based Distribution
Monitoring System”, School of
Engpneering,American University of Sharjah, IEEE Melecon 2004,May 12-15.
Network” , International Journal of Advanced Research in Computer Science and Software Engineering,2013.
[8] S.Sukhumar, P. Mukesh Aravind, L.Manivannan, P.Naveen Kumar and N.Suthanthira Vanitha5. “Gsm Based Automatic Trip Control System For Energy Management ” International journal of innovative research in science, Engineering and technology, Vol. 2, Issue 12, December 2013. [9] Abhinandan Jain “Smart and Intelligent GSM
based Automatic Meter Reading System”
International Journal of Engineering Research & Technology (IJERT) Vol. 1 Issue 3, May – 2012 ISSN: 2278-0181
[10] S.H. Shete “GSM Enabled Embedded