Sentiment classification on customer feedback data: noisy data, large feature
vectors, and the role of linguistic analysis
Michael Gamon
Microsoft Research One Microsoft Way Redmond, WA 98052 [email protected]
Abstract
We demonstrate that it is possible to perform automatic sentiment classification in the very noisy domain of customer feedback data. We show that by using large feature vectors in combination with feature reduction, we can train linear support vector machines that achieve high classification accuracy on data that present classification challenges even for a human annotator. We also show that, surprisingly, the addition of deep linguistic analysis features to a set of surface level word n-gram features contributes consistently to classification accuracy in this domain.
1 Introduction
Software companies typically receive high volumes of electronic customer feedback every day, some of it in the form of elicited surveys, some of it in the form of unsolicited comments, suggestions, criticism. In order to react to that feedback quickly, and to direct it to the appropriate channels inside the company, it is desirable to provide intelligent and automatic classification of the feedback along two dimensions:
What is the feedback about?
Is the feedback positive or negative? The first question is addressed by text mining tools. Automatic sentiment classification addresses the second question. Text mining tools can help make large quantities of feedback more manageable by splitting them into clusters based on keywords or topics. Sentiment analysis, which is the focus of this paper, adds a second dimension to the analysis. It makes it possible to focus the text mining on areas in need of improvement (negative feedback) or on areas of success (positive feedback).
Sentiment classification is a special case of text categorization, where the criterion of classification is the attitude expressed in the text, rather than the “content” or topic. Faced with the task of having to automatically classify a piece of text as expressing positive or negative sentiment, a reasonable first approach would consist of paying special attention to words that tend to express a positive or negative
attitude. Pang et al. (2002) have demonstrated, however, that this is not as straightforward as one may think, given that sentiment is often expressed in more subtle and indirect ways.
The literature on sentiment classification can be divided into approaches that rely on semantic resources, such as a sentiment or affect lexicon (Nasukawa and Yi 2003, Subasic and Huettner 2001), or a large scale knowledge base (Liu et al 2003) on the one hand, and approaches that try to learn patterns directly from tagged data, without additional resources (Dave et al 2003, Pang et al. 2003). Much research is also being directed at acquiring affect lexica automatically (Turney 2002, Turney and Littman 2002).
There is also a considerable amount of research on classification of text as “subjective” or “objective” (Wiebe et al 2001, Yu and Hatzivassiloglou 2003), a task that is not relevant for the processing of very brief pieces of direct customer feedback.
In many studies, research on sentiment classification is conducted on review-type data, such as movie or restaurant reviews. These data often consist of relatively well-formed, coherent and at least paragraph-length pieces of text. The results we present in this paper are based on customer feedback data from web surveys, which, as we will discuss below, are particularly noisy and fragmentary.
For our purpose of automatic classification of customer feedback, we decided to use machine-learning directly on the customer feedback, instead of relying on additional semantic resources of any kind. This decision was motivated by practical considerations: first, the customer feedback data we are facing are often very short and sometimes very incoherent. This makes it seem unlikely that a detailed semantic resource would be of particular help. Second, we believe that an appropriately chosen machine-learning technique will be able to draw its own conclusions from the distribution of lexical elements in a piece of feedback.
track record in text classification (Joachims 1998, Dumais et al. 1998), they can be trained using a large number of features, and both training and classification for linear SVMs are fast with optimized learning algorithms. For our experiments we use John Platt’s Sequential Minimal Optimization (SMO) tool (Platt 1999). In the absence of any evidence that would suggest a more complicated kernel function such as a polynomial or an RBF kernel, we have decided to train linear SVMs for our classification task (see also the results in Joachims 1998).
The procedure, as is standard in supervised machine learning tasks, consists of training a classifier on pretagged training data and then evaluating the performance of the classifier on a held-out set of test data.
The two main questions we wanted to assess with our experiments are:
1. which features and feature sets are
relevant for sentiment classification on customer feedback?
2. what is the maximum classification
accuracy that can be achieved on this data set?
2 Data
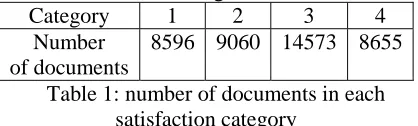
Our data consists of 11399 feedback items from a Global Support Services survey, and 29485 feedback items from a Knowledge Base survey for a total of 40884 items. We excluded pieces of feedback without any verbatim from the data. Along with the verbatim, customers provided a numeric satisfaction score on a scale from 1 (not satisfied) to 4 (very satisfied) for each of those pieces of feedback. The numeric score served as the target tag in our experiments, making it unnecessary to perform any costly human evaluation and tagging. The distribution of items across numerical scores is given in Table 1.
Category 1 2 3 4 Number
of documents
[image:2.595.67.276.567.630.2]8596 9060 14573 8655
Table 1: number of documents in each satisfaction category
The data is extremely noisy, and a human evaluation of a random set of 200 pieces of feedback could only assign a positive or negative sentiment to 117 (58.5%) items, the rest was either balanced (16 cases or 8%), expressed no sentiment (50 cases or 25%), or too incoherent or random to be classified (17 cases or 8.5%). Amongst the 117 classifiable cases, the human evaluator assigned the category “positive”: to 26 cases (or 22.2%) and the category “negative” to 91 cases (or 77.8%).
After automatic sentence breaking into one sentence per line, the individual files contained an
average of 2.56 lines. For our experiments we split the data 90/10 into training and held-out test data. We performed 10-fold cross validation for each of the experiments reported in this paper.
For each of the various classification tasks, we trained a linear SVM using the standard settings of the SMO tool, and calculated accuracy, precision and recall numbers on the held-out test data, averaging them across the 10-fold cross validation.
3 Features
3.1 Feature vectors
We experimented with a range of different feature sets. Most importantly, we wanted to establish whether we would gain any significant advantage in the sentiment classification task by using features based on deep linguistic analysis or whether surface-based features would suffice. Previous results in authorship attribution and style classification experiments had indicated that linguistic features contribute to the overall accuracy of the classifiers, although our null hypothesis based on a review of the relevant literature for sentiment classification was that we would not gain much by using these features. The surface features we used were lemma unigrams, lemma bigrams, and lemma trigrams.
For the linguistic features, we performed a linguistic analysis of the data with the NLPWin natural language processing system developed in Microsoft Research (an overview can be found in Heidorn 2000). NLPWin provides us with a phrase structure tree and a logical form for each string, from which we can extract an additional set of features:
• part-of-speech trigrams
• constituent specific length measures
(length of sentence, clauses,
adverbial/adjectival phrases, and noun phrases)
• constituent structure in the form of context
free phrase structure patterns for each constituent in a parse tree. Example: DECL::NP VERB NP (a declarative sentence consisting of a noun phrase a verbal head and a second noun phrase)
• Part of speech information coupled with
semantic relations (e.g. “Verb - Subject - Noun” indicating a nominal subject to a verbal predicate)
• Logical form features provided by
document. Using binary values for
presence/absence as opposed to frequency values is motivated by the rather extreme brevity of these documents.
3.2 Feature reduction
Feature reduction is an important part of optimizing the performance of a (linear) classifier by reducing the feature vector to a size that does not exceed the number of training cases as a starting point. Further reduction of vector size can lead to more improvements if the features are noisy or redundant.
Reducing the number of features in the feature vector can be done in two different ways:
• reduction to the top ranking n features
based on some criterion of “predictiveness”
• reduction by elimination of sets of
features (e.g. elimination of linguistic analysis features etc.)
Experimenting with the elimination of feature sets provides an answer to the question as to which qualitative sets of features play a significant role in the classification task
Of course these methods can also be combined, for example by eliminating sets of features and then taking the top ranking n features from the remaining set.
We used both techniques (and their combinations) in our experiments. The measure of “predictiveness” we employed is log likelihood ratio with respect to the target variable (Dunning 1993).
In the experiments described below, n (in the n top-ranked features) ranged from 1000 to 40,000. The different feature set combinations we used were:
• “all features”
• “no linguistic features” (only word
ngrams)
• “surface features” (word ngrams,
function word frequencies and POS ngrams)
• “linguistic features only” (no word
ngrams)
4 Results
Given the four different rankings associated by users with their feedback, we experimented with two distinct classification scenarios:
1. classification of documents as belonging
to category 1 versus category 4
2. classification of documents as belonging
to categories 1 or 2 on the one hand, and 3 or 4 on the other
Two additional scenarios can be envisioned. In the first, two classifiers (“1 versus 2/3/4” and “4 versus 1/2/3”) would be trained and their votes would be combined either through weighted probability voting or other classifier combination methods (Dietterich 1997). A second possibility is to learn a three-way distinction “1 versus 2/3 versus 4”. In this paper we restrict ourselves to the scenarios 1 and 2 above. Initial experiments suggest that the combination of two classifiers yields only minimal improvements.
4.1 Classification of category 1 versus category 4
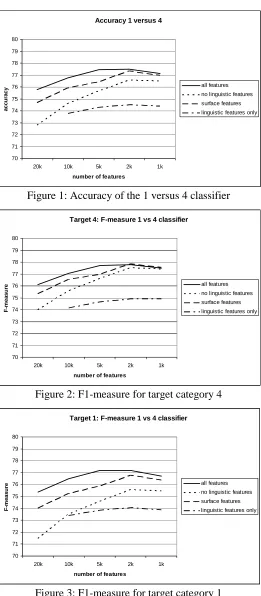
Figure 1 below illustrates the accuracy of the “1 versus 4” classifier at different feature reduction cutoffs and with different feature sets. The accuracy differences are statistically significant at the .99 confidence level, based on the 10fold cross validation scenario. Figure 2and Figure 3 show the F1-measure for target value 4 (“good sentiment”) and target value 1 (“bad sentiment”) respectively.
The baseline for this experiment is 50.17% (choosing category 4 as the value for the target feature by default).
Accuracy peaks at 77.5% when the top 2000 features in terms of log likelihood ratio are used, and when the feature set is not restricted, i.e. when these top 2000 features are drawn from linguistic and surface features. We will return to the role of linguistic features in section 4.4.
Accuracy 1 versus 4
70 71 72 73 74 75 76 77 78 79 80
20k 10k 5k 2k 1k
number of features
ac
cu
ra
c
y all features
[image:4.595.174.435.48.644.2]no linguistic features surface features linguistic features only
Figure 1: Accuracy of the 1 versus 4 classifier
Target 4: F-measure 1 vs 4 classifier
70 71 72 73 74 75 76 77 78 79 80
20k 10k 5k 2k 1k
number of features
F
-m
e
asu
re all features
no linguistic features surface features linguistic features only
Figure 2: F1-measure for target category 4
Target 1: F-measure 1 vs 4 classifier
70 71 72 73 74 75 76 77 78 79 80
20k 10k 5k 2k 1k
number of features
F-m
e
a
s
ur
e all features
no linguistic features surface features linguistic features only
Figure 3: F1-measure for target category 1
4.2 Classification of categories 1 and 2 versus 3 and 4
Accuracy and F1-measure results for the “1/2 versus 3/4” task are shown in Figure 4, Figure 5 and Figure 6. Again, the accuracy differences are statistically significant. The baseline in this scenario is at 56.81% (choosing category 3/4 for the target feature by default). Classification accuracy is lower than in the “1 versus 4” scenario,
as can be expected since the fuzzy categories 2 and 3 are included in the training and test data. Similarly to the “1 versus 4” classification, accuracy is maximal at 69.48% when the top 2000 features from the complete feature set are used.
[image:4.595.170.437.57.239.2]Accuracy 1/2 versus 3/4
65 66 67 68 69 70 71 72 73 74 75
20k 10k 5k 2k 1k
number of features
acc
u
ra
c
y all features
[image:5.595.167.438.61.644.2]no linguistic features surface features linguistic features only
Figure 4: Accuracy of the 1/2 versus 3/4 classifier
Target 3/4: F-measure 1/2 versus 3/4 classifier
71 71.5 72 72.5 73 73.5 74 74.5 75 75.5 76
20k 10k 5k 2k 1k
number of features
F
-m
e
asu
re all features
no linguistic features surface features linguistic features only
Figure 5: F1-measure for target category 3/4
Target 1/2: F-measure 1/2 versus 3/4 classifier
55 56 57 58 59 60 61 62 63 64 65
20k 10k 5k 2k 1k
number of features
F-m
e
a
s
ur
e all features
no linguistic features surface features linguistic features only
Figure 6: F1-measure for target category 1/2
4.3 Results compared to human classification
The numbers reported in the previous sections are substantially lower than results that have been reported on other data sets such as movie or restaurant reviews. Pang et al. (2002), for example, report a maximum accuracy of 82.9% on movie reviews. As we have observed in section 2, the data that we are dealing with here are extremely
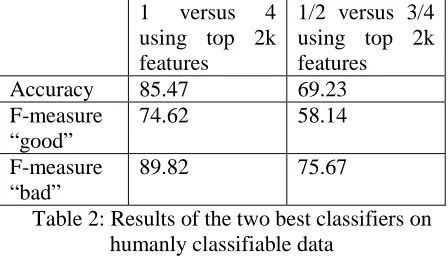
scenario. For that purpose, we retrained both “1 versus 4” and “1/2 versus 3/4” classifiers with the top-ranked 2000 features on our data set, with the humanly evaluated cases removed from the training set. Results are shown in Table 2, the baseline in this experiment is at 77.78% (choosing the “bad” sentiment as a default).
1 versus 4 using top 2k features
1/2 versus 3/4 using top 2k features
Accuracy 85.47 69.23
F-measure “good”
74.62 58.14
F-measure “bad”
[image:6.595.59.283.152.282.2]89.82 75.67
Table 2: Results of the two best classifiers on humanly classifiable data
Accuracy of 85.47% as achieved by the “1 versus 4” scenario is in line with accuracy numbers reported for less noisy domains.
4.4 The role of linguistic analysis features
Figure 1 through Figure 6 also show the effect of eliminating whole feature sets from the training process. A result that came as a surprise to us is the fact that the presence of very abstract linguistic analysis features based on constituent structure and semantic dependency graphs improves the performance of the classifiers. The only exception to this observation is the F1-measure for the “good” sentiment case in the “1/2 versus 3/4” scenario (Figure 5), where the different feature sets yield very much similar performance across the feature reduction spectrum, with the “no linguistic features” even outperforming the other feature sets by a very small margin (0.18%). While the improvement in practice may be too small to warrant the overhead of linguistic analysis, it is very interesting from a linguistic point of view that even in a domain as noisy as this one, there seem to be robust stylistic and linguistic correlates with sentiment. Note that in the “1 versus 4” scenario we can achieve classification accuracy of 74.5% by using only linguistic features (Figure 1), without the use of any word n-gram features (or any other word-based information) at all. This clearly indicates that affect and style are linked in a more significant way than has been previously suggested in the literature.
4.5 Relevant features
Given that linguistic features play a consistent role in the experiments described here, we inspected the models to see which features play a particularly big role as indicated by their associated weights in the linear svm. This is
particularly interesting in light of the fact that in previous research on sentiment classification, affect lexica or other special semantic resources have served as a source for features (see references in section 1). When looking at the top 100 weighted features in the best classifier (“1 versus 4”), we found an interesting mix of the obvious, and the not-so-obvious. Amongst the obviously “affect”-charged terms and features in the top 100 are:
+Neg1, unable to, thanks, the good, easy to, ease of, lack of, not find, not work, no help, much accurate, a simple
On the other hand, there are many features that carry high weights, but are not what one would intuitively think of as a typical affect indicator:
try the, of, off, ++Univ2, ADV PRON PREP3,
NP::PRON:CHAR4, @@Adj Props Verb Tsub
Pron5, AUXP::VERB, your
We conclude from this inspection of individual features that within a specific domain it is not necessarily advisable to start out with a resource that has been geared towards containing particularly affect-charged terminology. See Pang et al. (2002) for a similar argument. As our numbers and feature sets suggest, there are many terms (and grammatical patterns) associated with sentiment in a given domain that may not fall into a typical affect class.
We believe that these results show that as with many other classification tasks in the machine learning literature, it is preferable to start without an artificially limited “hand-crafted” set of features. By using large feature sets which are derived from the data, and by paring down the number of features through a feature reduction procedure if necessary, relevant patterns in the data can be identified that may not have been obvious to the human intuition.
5 Conclusion
We have shown that in the very noisy domain of customer feedback, it is nevertheless possible to perform sentiment classification. This can be achieved by using large initial feature vectors combined with feature reduction based on log
1 this semantic feature indicates a negated context. 2 Universal quantification.
3 part of speech trigram.
4 An NP consisting of a pronoun followed by a
punctuation character.
5 An adjectival semantic node modified by a verbal
likelihood ratio. A second, more surprising result is that the use of abstract linguistic analysis features consistently contributes to the classification accuracy in sentiment classification. While results like this have been reported in the area of style classification (Baayen et al. 1996, Gamon 2004), they are noteworthy in a domain where stylistic markers have not been considered in the past, indicating the need for more research into the stylistic correlations of affect in text.
6 Acknowledgements
We thank Anthony Aue and Eric Ringger (Microsoft Research) and Hang Li (Microsoft Research Asia) for helpful comments and discussions, and Chris Moore (Microsoft Product Support Services UK) for the initial request for sentiment classification based on the needs of Support Services at Microsoft. Thanks also go to Karin Berghoefer of the Butler-Hill group for manually annotating a subset of the data.
References
Harald Baayen, Hans van Halteren, and Fiona Tweedie. 1996. Outside the Cave of Shadows: Using Syntactic Annotation to Enhance Authorship Attribution. Literary and Linguistic Computing 11(3): 121-131.
Thomas G. Dietterich (1997): “Machine-learning research: Four current directions”. In: AI Magazine, 18 (4), pp.97-136.
Susan Dumais, John Platt, David Heckerman, Mehran Sahami (1998): “Inductive Learning Algorithms and Representations for Text Categorization”. Proceedings of CIKM-98, pp. 148-155.
Ted Dunning. 1993. Accurate Methods for the Statistics of Surprise and Coincidence. Computational Linguistics 19: 61-74.
Aidan Finn and Nicholas Kushmerick (2003): „Learning to classify documents according to genre“. IJCAI-03 Workshop on Computational Approaches to Text Style and Synthesis.
Michael Gamon (2004): “Linguistic correlates of style: authorship classification with deep linguistic analysis features”. Paper to be presented at COLING 2004.
George Heidorn. (2000): “Intelligent Writing Assistance.” In R. Dale, H. Moisl and H. Somers, eds., Handbook of Natural Language Processing. Marcel Dekker.
Thorsten Joachims (1998): “Text Categorization with Support Vector Machines: Learning with Many Relevant Features”. Proceedings of ECML 1998, pp. 137-142.
Kushal Dave, Steve Lawrence and David M. Pennock (2003): “Mining the Peanut Gallery: Opinion Extraction and Semantic Classification of Product Reviews”. In: Proceedings of the Twelfth International World Wide Web Conference, pp. 519-528.
Hugo Liu, Henry Lieberman and Ted Selker (2003): “A Model of Textual Affect Sensing using Real-World Knowledge”. In: Proceedings of the Seventh Conference on Intelligent User Interfaces, pp. 125-132.
Tetsuya Nasukawa and Jeonghee Yi (2003): “Sentiment Analysis: Capturing Favorability Using Natural Language Processing”. In: proceedings of the International Conference on Knowledge Capture, pp. 70-77.
Bo Pang, Lillian Lee and Shivakumar Vaithyanathan (2002): “Thumbs up? Sentiment Classification using Machine Learning Techniques”. Proceedings of EMNLP 2002, pp. 79-86.
John Platt (1999): “Fast training of SVMs using sequential minimal optimization”. In: B. Schoelkopf, C. Burges and A. Smola (eds.) “Advances in Kernel Methods: Support Vector Learning”, MIT Press, Cambridge, MA, pp. 185-208.
Pero Subasic and Alison Huettner (2001): “Affect Analysis of Text Using Fuzzy Semantic Typing”. In: Proceedings of the Tenth IEEE International Conference on Fuzzy Systems, pp. 483-496.
Ljupčo Todorovski and Sašo Džeroski (2003):
“Combining Classifiers with Meta Decision Trees”. In: Machine Learning, 50, pp.223-249. Peter D. Turney (2002): “Thumbs up or thumbs
down? Semantic orientation applied to unsupervised classification of reviews”. In: Proceedings of ACL 2002, pp. 417-424.
Peter D. Turney and M. L. Littman (2002): “Unsupervised lLearning of Semantic Orientation from a Hundred-Billion-Word Corpus.” Technical report ERC-1094 (NRC 44929), National research Council of Canada. Janyce Wiebe, Theresa Wilson and Matthew Bell
(2001): “Identifying Collocations for Recognizing Opinions”. In: Proceedings of the ACL/EACL Workshop on Collocation.