Performance Analysis of Gasifier-driven Gas Engine
Prof. Sankalp K Kulkarni
1, Prof. Nitinchandra R Patel
2, Prof. Ramchandra L.
3Mechanical Engineering Department1, 2, 3,, Gujarat Technological University, Ghandhinagar, Gujarat1, 2, Visveswariah Technological University, Belgaum, Karnataka 3
Email: [email protected]1 , [email protected]2 , [email protected]
Abstract-The current phase of time is experiencing the dire need for the alternative energy sources in order to
beat the heat of burning petroleum prices and consequences of global warming. Here, a small move towards the same is focused in a way by use of bio-mass energy. The paper consists of Performance Analysis of Downdraft Gasifier system. The various bio-masses are utilised for combustible gaseous fuel by gasification process. The fuel obtained is used for thermal/heating and power generation processes. The analysis is of main concern to study the performance of a downdraft gasifier system experimentally. This in turn would be helpful in putting forward the gasifier system as an efficient source for renewable energy.
Index Terms- Biomass Gasifier, efficiency, calorific value, gas outlet temperature
1. INTRODUCTION
The fossil fuels that are widely used today are harmful for the environment. The earth is warming up and climates are changing. There are parts in the world were there be more rain and sunshine and others parts will be come dryer then they already are. Another negative effect is that the ozone layer is getting thinner which also leads to a warming up of the earth. These two effects compliment each other and make it even more crucial to make another step in a different direction. This step will lead us to the use of renewable energy. The fossil fuels are depleting in a rapid rate and are harder to retrieve. The consequence is that we can be facing an energy crisis in the future is we are not careful today. The energy prices will sky rocket and not be available for many individuals or countries. To avoid this doom scenario we need to find alternatives and used them to their full potential.
The solution for the above problems can be resolved by renewable energy. Our beautiful planet gives us the opportunity to make proper us of sunlight, flowing water, strong winds, Bio-mass and hot springs and convert these into energy. These energy sources are abundant and free to use. We must be sure that we convert the energy the right way, without causing other problems that can again hurt our environment. Luckily the many efforts by individuals and research institutes show that this can be done.
However the global warming and population growth making the picture more complex for next 50 years. Thus, the need for alternative energy sources is getting urgent, hence the development of renewable energy is moving fast. Nationally and internationally various individuals and research institutes are creating new and exciting energy systems.
If we look at a pattern of the energy production coal and oil accounts 52% and 33% respectively with natural gas hydro and nuclear contributing to the balance. The energy prices for crude oil are going through the roof, the small and developing countries suffer even more. These high oil prices have their effect on almost everything. The monthly electricity costs for households increase among others like transport cost and prices for basic products. Hence, these high oil prices make it harder for these small countries to grow there economies. In India problem due to uncontrollable population growth are ever increasing day by day with a view of improving quality of life of the huge population the demand for energy which is one of the basic need is increasing its manifolds.
The efforts have been made in this paper to use biomass energy, which can be used for various thermal applications and power generation using bio mass gasifier. A biomass gasifier converts solid fuel such as Wood Waste, Saw Dust briquettes and agro-residues converted into briquettes into a gaseous fuel through a thermo-chemical process and the resultant gas can be used for heat and power generation applications.Authors are encouraged to have their contribution checked for grammar.
The work is carried out in two stages. In first stage evaluation of thermal performance of gasifier is done. and in the second stage attempt have been made to evaluate the performance of gasifier driven IC engine for power generation.
2. ALTERNATIVE ENERGY SOURCES
2.1 WHY BIO MASS?
how can we extract energy from it and at last gasification route in little detail.
Biomass is a renewable energy resource derived from the carbonaceous waste of various human and natural activities. It is derived from numerous sources, including the by-products from the timber industry, agricultural crops, raw material from the forest, major parts of household waste and wood. Biomass is solar energy stored in organic matter. As trees and plants grow, the process of photosynthesis uses energy from the sun to convert carbon dioxide into carbohydrates (sugars, starches and cellulose). Carbohydrates are the organic compounds that make up biomass. When plants die, the process of decay releases the energy stored in carbohydrates and discharges carbon dioxide back into the atmosphere. Biomass is a renewable energy source because the growth of new plants and trees replenishes the supply.
2.2 TYPES OF BIOMASS
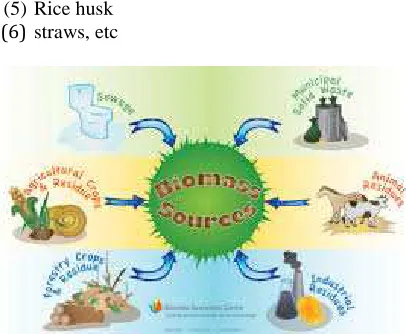
[image:2.595.73.276.391.558.2](1)Wood residues (2)Agricultural residues (3)Energy crops (4)Animal waste (5)Rice husk (6)straws, etc
Fig 2.1 Sources of Biomass
2.2.1 WOOD RESIDUES
This refers to leftover wood from other uses and not the wood harvested expressly for biomass. The lumber, pulp, and wood milling industries already extensively use wood waste to produce power. Wood residues can also come from forest thinning, urban tree trimmings, residual construction material, demolition material, wood pallets and other waste.
2.2.2 AGRICULTURAL RESIDUES
This includes primarily mill residues (waste from a processing plant, like nut hulls and oat hulls) and field residues (left in field after harvest, like corn stover and wheat straw). The removal of field
residues for energy must be balanced with the benefit to soil quality that residues provide.
2.2.3 ENERGY CROPS
These are crops that are “dedicated” for energy production. The most promising include woody crops like willows, hybrid poplars, maple, and sycamore; and herbaceous crops like switch grass and other prairie grasses. Often these types of energy crops offer environmental benefits over conventional crops, like less need for crop inputs, habitat for wildlife and reduced erosion and run-off.
2.2.4 ANIMAL WASTE
A large amount of waste and by-products are generated in the life cycle of animal. This includes dry animal waste which can be burnt directly for heat and power applications.
2.3 BIO MASS FOR SAFE ENVIRONMENT
Accounting for the environmental impacts of biomass is perhaps more complicated than for any other energy source considered here. Although a renewable resource, biomass has a much broader effect on the environment than other renewable sources. For example, while there are no emissions from wind turbines, the combustion of biomass produces pollutants that can have effects on human health and the environment.The best reason for accepting biomass as a fuel is its eco friendliness. Even though they are not as concentrated as fossil fuels, they are distributed moderately near the usage points, reducing the overheads on transportation and storage. Many of the biomass is wastes from some other process, and so the utilization will help in making the environment clean. Biomass does not add co2 (carbon dioxide) to the atmosphere as it absorbs the same amount of carbon in growing and releases as it consumes as fuel. Biomass is the most important fuel worldwide after coal and natural gas. So in this way by using Biomass as a energy alternative and mainly it does not add co2 (carbon dioxide) to the atmosphere and pollutants to cause Asthma and other health and environmental problems. It will be a kind gift to the world in a way that it can be one good solution to reduce the greenhouse effect which is today’s burning problem to the mankind.
2.4 WHAT IS A GASIFIER ?
A biomass gasifier converts solid fuel such as Wood Waste, Saw Dust briquettes and agro-residues converted into briquettes into a gaseous fuel through a thermo-chemical process and the resultant gas can be used for heat and power generation applications. The producer gas has relatively low calorific value, ranging from 1000 to 1100 kCal.Nm3 (5500 MJ/Nm3). The overall thermal efficiency of this process is more than 75%.
The combustible gas mixture, known as ‘producer gas’, typically contains:
(b) Hydrogen (12% - 15%)
(c) Nitrogen (50% - 54%)
(d) Carbon Dioxide (9% - 11%)
(e) Methane (2% - 3%)
Gasifire system consist of reactor which receives solid fuel and air and converts them to gas followed by cooling and washing train , where impurities are removed. The clean combustible gas is sent to the engine at nearly ambient temperature for power generation. In thermal application this cooling and cleaning depends upon requirement.
2.5 TYPES OF GASIFIERS
Basically gasifier system is classified in four categories:
[1] Fixed bed gasifier system [2] Downdraft gasifier system [3] Updraft gasifier system [4] Fluidized bed gasifier system
Among the all types, downdraft gasifier system has noticable advantages over the other types. Like Flexible adaptation of gas production to load, Low sensitivity to charcoal dust and tar content of fuel. Hence it is used on prior bases.
2.5.1 Downdraft gasifier system
[image:3.595.351.474.302.436.2]System is shown in fig 3.1, in this type of the system biomass is fed from the top of the gasifier and also air is taken at the top side and gases leaves from the base of the gasifier system.. The biomass is dried in the drying zone and pyrolizes in the distillation zone. This zones are mainly heated due to radiation (heat coming from the hearth zone where part of the charcoal is burned) pyrolysis gases also pass through this zones and burned as well. The extent to which the pyrolysis gases are burned depends upon design of the gasifier, biomass feed stock and skill of the operator. Downdraft gasifiers are specifically designed to minimize tar and oil production. After the oxidation zone remaining char and combustion products pass through the reduction zone (CO2 and water vapor) where CO and H2 formed. Most of the biomass is converted in to the gas in the combustion zone.
Fig. 2.2 Downdraft gasifier system
2.6 GASIFICATION PROCESS
[image:3.595.124.235.630.725.2]Biomass fuels such as firewood and agro-residues essentially contain carbon, hydrogen, and oxygen along with some moisture. Under controlled conditions, characterized by low oxygen supply and high temperatures, most biomass materials can be converted into a gaseous fuel known as producer gas, which consists of carbon monoxide, hydrogen, carbon dioxide, methane and nitrogen. This thermo-chemical conversion of solid biomass into gaseous fuel is called biomass gasification. Basically this process involves reaction of carbon and hydrogen. This conversion process is being complete in few stages. Basically four different processes take place across the gasifier to convert biomass in to combustible producer gas. The below shown colorful figure will give more idea about the process stages in the gasifier during the conversion process.
Fig 2.3 Zones of gasifier
As shown in the fig the four stages are, 1. Drying zone
2. Pyrolysis zone 3. Combustion zone 4. Reduction zone
(1) Drying Zone basically dries the biomass and reduces moisture content from the biomass by radiation using heat coming from the combustion zone. (2)Pyrolysis Zone, In this section hot gas pyrolyzes biomass to tar, oil charcoal and some gases. (3) Combustion Zone, the combustible material of a solid fuel is usually composed of elements carbon, hydrogen and oxygen. In complete combustion carbon dioxide is obtained from carbon in fuel and water is obtained from the hydrogen, usually as steam. The combustion reaction is exothermic and yields a theoretical oxidation temperature of 14500C. The main reactions, therefore, are:
1. C + O2 = CO2 2. 2H2 + O2 = 2H2 O (4)Reduction Zone, the products of partial combustion (water, carbon dioxide and uncombustible partially cracked pyrolysis products) now pass through a red-hot charcoal bed where the following reduction reactions take place.
[4]C+2H2 = CH4
[5] CO2 + H2 = CO+H2O
Reactions (3) and (4) are main reduction reactions and being endothermic have the capability of reducing gas temperature. Consequently the temperatures in the reduction zone are normally 800-10000C. Lower the reduction zone temperature (~ 700-8000C), lower is the calorific value of gas. The gas produced from the gasifier generally contain contaminants that are required to be removed. The principle contaminants encountered are particulates, alkali compound, tars, nitrogen-content compound, sulphur and low molecular weight hydrocarbons. Tar is one of the most unpleasant constituents of the gas as it tends to deposit in the carburetor and intake valves causing sticking and troublesome operations . It is a product of highly irreversible process taking place in the pyrolysis zone. The physical property of tar depends upon temperature and heat rate and the appearance ranges from brown and watery (60% water) to black and highly viscous (7% water). There are approximately 200 chemical constituents that have been identified in tar so far and if this all particulate matters reach to the engine where power is being generated, may deposit on the piston and cylinder that may lead to inefficient working of engine. That may also damage the piston and may lead to knocking of the engine. But again need of the remove this particulate from the gas is depends upon the application.
3. METHODOLOGY FOR EXPERIMENT
3.1 EXPERIMENTAL SETUP
A study of tar and particulate matter of the producer gas was done in system connected to a 55 kg/hr capacity open core downdraft gasifier. The gas was supplied to a natural gas engine of 30kVA, which is expected to provide a maximum power of 24 kWe with 0.8 power factor. The excess gas was flared in a flare box without subjecting to cleaning and cooling, but after passing through the hot cyclone to remove the coarser particulates. The producer gas needed for engine operation was only subjected to cleaning and cooling in this investigation study.
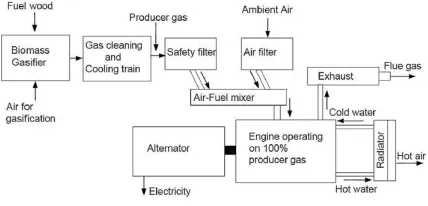
3.2 SYSTEM DISCRIPTION
The system consists with blower-burner setup both for starting mode and normal running mode along with a hot cyclone to trap the coarser dust particles. Gasifier is provided with thermal insulation to prevent thermal leakage and to achieve the desired thermo chemical reactions at the desired temperature inside the reactor. It is also
[image:4.595.295.509.457.560.2]provided with a inspection cum clinker removal window to remove clinkers when high ash content biomass with low ash fusion temperature is as used as feed stock for the gasifier. Gasifier consists of a hopper which holds feedstock for around 2 hours of operation, which needs to be filled up as and when the biomass level goes down during operation. A stair case is also provided to climb up and feed the gasifier manually. Large scale system can be mechanized with conveyors to feed the biomass. In the combustion zone also known as oxidation zone there are 4 air tuyers provided to supply air during operation of gasifier, which otherwise will be closed by plugging the end caps provided with it. There is also a cast iron grate with a shaking mechanism provided at the bottom of the gasifier to remove deposits of ash collected at the bottom of the gasifier reactor. Shaking of the grate sometimes also helps in achieving the compact bed of fuel in the gasifier, which inturn promotes the proper gasification and prevents bridging of fuel and creation of void spaces, mainly in the reduction and oxidationzone. Too vigouros shaking of the grate is not desirable as the gasifier zones gets affected seriously and the gasifier is very senstitive for any such sudden changes. At the bottom of the gasifier a water seal is provided to prevent air leakage into the system which otherwise affects the performance of the gasifier and makes it to behave like a combustor. The water level in the seal has to be monitored and maintained within the limits. There is also a water seal and top cover provided at the top of the gasifier to prevent air infusion into the system during shutdown of the gasifier.
Fig 3.1: Schematic diagram of gasifier system
The producer gas from the gasifier is drawn to the starting burner and main burner through blowers. Before the gas makes entry in to the blowers, gate valves are provided to isolate the gas flow in each direction after passing through the hot cyclone. Hot cyclone is provided at the exit of the gasifier to trap the coarser dust particles before the gas makes an entry to the blowers. Figure shows the general schematic arrangement of the gasifier system for thermal application.
circular filter paper of Whatmann make. The filter is dried in an oven for 2 hr at 105°C before and after sampling, and the weight difference indicates the tar + dust collected. In two trails the manual pumping was replaced by gas flow meter and vacuum pump to check for any deviation in the values due to isokinetic gas aspiration when the gas is being sucked by a vacuum pump. There was no such noticeable deviation in values of tar + dust by replacing manual pumping with a vacuum pump.
3.3 DESCRIPTION OF THE FILTER
SYSTEM
The filter consists of three drum of height 800 mm, of which the effective height to which filter media being filled is up to 500 mm. The diameter of the first, second and third drums were respectively 300mm, 400mm and 500mm, and filled with MS raschig rings (bulk density =300kg/m3, void fraction of 91%, surface of 205m2/m3), charcoal ( 25 kg ) and coconut coir. The first two drums contained water distribution plates with 5mm holes, for uniform distribution of the sprayed water. The cooling water flow rate was maintained at 600 lt./hr. Gas cooling-cleaning system with low initial and operating costs are needed to make small-scale, decentralized gasification-based power generating systems more attractive.
Fig 3.2 Wetbed scrubber with raschig rings, charcoal and coconut coir (from left to right)
With this requirement in consideration, it was decided to undertake the development of a compact cooling and cleaning system, as it is very simple to construct and operate, has low pressure drop, low cost and offered the advantage of cooling-cleaning in three vertical towers.
3.4 WORKING OF COOLING–CLEANING SYSTEM
The hot gas passes upward through the packing material, while the water is uniformly distributed above the packed bed and flows downwards in countercurrent flow. The packing provides a large
[image:5.595.88.264.454.590.2]surface area in a given volume where the water wets its surface and the gas contacts the water on the wetted surface. It acts as a direct contact counter flow heat exchanger for gas cooling. Tar and water vapor in the producer gas condense, and a portion of the tar and particulates are removed and washed away with the water. Aerosols separation takes place in a wet scrubber primarily by the mechanisms of inertial deposition and direct interception for large particles. Fine particles below 0.3 µm exhibit Brownian movement and diffuse from the gas to the liquid film and are collected. Particles in the 0.1-2 µm range are the most difficult to collect. Water vapor and tar can condense on these particles as nuclei, increasing their size and making them more susceptible to collection by inertial deposition. In the scrubber, water vapor or tar vapor diffuses from the gas stream towards the cold surface and condenses. The non condensable gas then flows towards the condensing surface carrying the aerosol (dust) particles, where they contact the water film by the mechanisms mentioned above. This phenomenon is called Stefan motion. The operating range of the wet bed scrubber was kept below its flooding limit. The gas obtained at the exit of the scrubber contained mist, residual tar and dust. Increasing the wet bed scrubber height increases the available contact area as well as the residence time available for aerosol agglomeration and collection by the mechanisms mentioned above. The coir filter is included to remove the entrained mist in the third tower. Further a fabric filter was incorporated to further clean the gas and to trap the excess moisture.
Fig 3.3: Fabric filter incorporated to further clean the producer gas
4. ANALYSIS OF ENGINE DRIVEN BY GASIFIER: OBSERVATION AND CALCULATIONS
[image:5.595.304.514.454.592.2]Table 1: Observations of gasifier operation
with engine
Time (hh: min)
Orifice manomete
r reading (h) (mm)
Volt (V)
Curre nt (A)
Engine Exhaus t Temp
(C)
11:45 45 425 4.4 452 11:55 40 425 9.0 445 12:01 40 414 13.2 448 12:06 34 397 16.6 432 12:16 30 399 16.3 421 12:25 30 400 16.3 418 12:30 30 405 16.4 412 12:40 30 405 16.3 410 12:50 30 406 16.2 407 01:00 28 404 16.0 401 01:10 20 377 14.6 389 01:20 30 395 15.8 401 01:30 30 402 15.7 405 01:40 30 400 15.7 410 02:00 30 390 15.4 401 02:20 28 386 15.0 405 02:40 29 387 15.4 401 02:45 25 360 15.5 395 02:46 23 417 12.1 387 03:00 21 403 11.7 381 03:05 17 382 11.1 363 03:10 15 378 11.1 358 03:20 11 360 10.6 310 03:30 24 405 12 360
The performance of the Thermal analysis is evaluated in terms of the energy conversion efficiency of the system, which is calculated as below.
Table 2: Performance result for Gasifier and Engine
Gas Flow Rate (m3/s)
Engin e Load
(kW)
Engine Input Energy
(kW)
Thermal Efficiency of
the engine (%)
11:45 0.0227 3.239 95 3.40
11:55 0.0206 6.625 87 7.63
12:01 0.0206 9.465 87 10.90
12:06 0.0191 11.415 80 14.20
12:16 0.0178 11.265 75 15.04
12:25 0.0178 11.293 75 15.07
12:30 0.0178 11.504 75 15.36
12:40 0.0178 11.434 75 15.26
12:50 0.0178 11.392 75 15.21
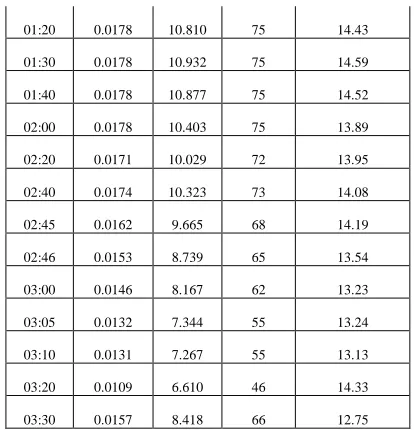
01:00 0.0171 11.196 72 15.57
01:10 0.0143 9.534 60 15.77
01:20 0.0178 10.810 75 14.43
01:30 0.0178 10.932 75 14.59
01:40 0.0178 10.877 75 14.52
02:00 0.0178 10.403 75 13.89
02:20 0.0171 10.029 72 13.95
02:40 0.0174 10.323 73 14.08
02:45 0.0162 9.665 68 14.19
02:46 0.0153 8.739 65 13.54
03:00 0.0146 8.167 62 13.23
03:05 0.0132 7.344 55 13.24
03:10 0.0131 7.267 55 13.13
03:20 0.0109 6.610 46 14.33
03:30 0.0157 8.418 66 12.75
Sample Calculation : (for reading no 4)
1) Gas flow rate :
y = -1E-06x2 + 0.0004x + 0.0077
where x is pressure drop in mm and y is the gas flow rate.
y = -1 * ( 10-6*(34)2 + 0.0004* 34 + 0.0077 = -0.001156 +0.0136 + 0.0067 = 0.019144 m3/s
2) Engine Load :
Engine load = (sqrt(3)* V * I )/ 1000 kW =(1.732 * 397 *16.6 )/ 1000 = 11.4145 kW
3) Engine Energy Input:
Input energy = gas flow rate * calorific value = 0.019144 (m3/s)* 1000 (kCal/ m3)* 4.1868 ( kJ/kCal)
= 80.152099kW
4) Brake Thermal Efficiency of the engine: ηbth = Output Energy/ Input energy = 11.415/ 80.152
= 0.1424 * 100 = 14.24 %
The graph potted below shows engine load v/s thermal efficiency, As expected when load incresaes thermal efficiency is also incresed. Here Maximum efficiency obtained is 16 %. Further increment in load doesn't show any change in efficiency. This could be because of low calorific value of producer gas.
2 3 4 5 6 7 8 9 10 11 12
0 5 10 15 20
f(x) = 9.74 ln(x) - 8.47 R² = 0.76
Load Vs Efficiency
Load (kW)
E
ff
ic
ie
n
cy
(
%
[image:7.595.293.511.96.228.2])
Fig 4.1 Load v/s Efficiency
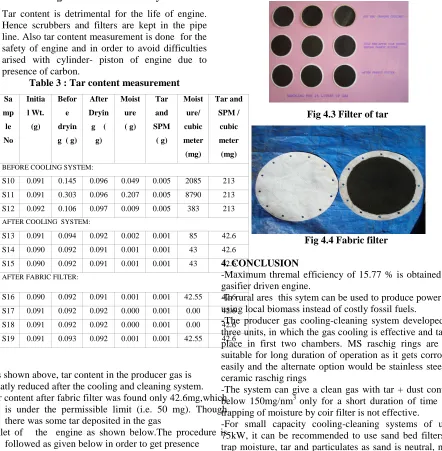
Tar content is detrimental for the life of engine. Hence scrubbers and filters are kept in the pipe line. Also tar content measurement is done for the safety of engine and in order to avoid difficulties arised with cylinder- piston of engine due to presence of carbon.
Table 3 : Tar content measurement
Sa
mp
le
No Initia
l Wt.
(g)
Befor
e
dryin
g ( g) After
Dryin
g (
g)
Moist
ure
( g)
Tar
and
SPM
( g)
Moist
ure/
cubic
meter (mg)
Tar and
SPM /
cubic
meter (mg)
BEFORE COOLING SYSTEM:
S10 0.091 0.145 0.096 0.049 0.005 2085 213 S11 0.091 0.303 0.096 0.207 0.005 8790 213 S12 0.092 0.106 0.097 0.009 0.005 383 213 AFTER COOLING SYSTEM:
S13 0.091 0.094 0.092 0.002 0.001 85 42.6 S14 0.090 0.092 0.091 0.001 0.001 43 42.6 S15 0.090 0.092 0.091 0.001 0.001 43 42.6 AFTER FABRIC FILTER:
S16 0.090 0.092 0.091 0.001 0.001 42.55 42.6 S17 0.091 0.092 0.092 0.000 0.001 0.00 42.6 S18 0.091 0.092 0.092 0.000 0.001 0.00 42.6 S19 0.091 0.093 0.092 0.001 0.001 42.55 42.6
As shown above, tar content in the producer gas is greatly reduced after the cooling and cleaning system. Tar content after fabric filter was found only 42.6mg,which
is under the permissible limit (i.e. 50 mg). Though there was some tar deposited in the gas
[image:7.595.70.257.122.284.2]inlet of the engine as shown below.The procedure is followed as given below in order to get presence of tar in producer gas.
Fig 4.2 Tar diposited in Engine
-Filter of tar sampler and fabric filter was found black and wet after taking sample. Photograph of filters after the observations show the same.
Fig 4.3 Filter of tar
Fig 4.4 Fabric filter
4. CONCLUSION
-Maximum thremal efficiency of 15.77 % is obtained for gasifier driven engine.
-In rural ares this sytem can be used to produce power by using local biomass instead of costly fossil fuels.
-The producer gas cooling-cleaning system developed as
three units, in which the gas cooling is effective and takes place in first two chambers. MS raschig rings are not suitable for long duration of operation as it gets corroded easily and the alternate option would be stainless steel or ceramic raschig rings
-The system can give a clean gas with tar + dust content below 150mg/nm3 only for a short duration of time and trapping of moisture by coir filter is not effective.
[image:7.595.70.512.289.740.2]good filtration and is reusable as simple washing with detergent solution is adequate to refurbish the filter.
-The system is tested by supplying gas to a 100% producer gas engine, and found to run smoothly only after incorporating fabric filter and it is highly recommended not to supply the gas directly to the engine as the moisture level will be in the range of 9 to13gm/m3 during normal working load of 10kWe, while the system was designed for 12kWe load. The moisture level in the gas is expected to be much higher with the increased gas flow rate at higher loads are the most efficient and effective. Biomass may be the answer which prevents a future energy shortage, not just here but across the globe.
ACKNOWLEDGEMENT
Authors are obliged by the research institute SPRERI (Sardar Patel Renewable Energy Research Institute, V.V.Nagar) for providing the needed experimental facility .We are thankful to supporting staff and students involved in the said topic and for their contributions.
REFERENCES
[1] Hand book of gasifier developed by SERI (SolarEnergy Research Institute)
[2] Bio mass gasification, Anil k. Rajshvani.
[3] Performance investigation of a modified small engine fueled
with producer gas Nigran Homdoung 1, Nakorn Tippayawong 1,* and Natthawud Dussadee 2 Maejo International Journal of Science and Technology, ISSN 1905-7873
[4] Handbook of renewable energy
[5] Sugarcane leaf base gasifier, Rajeev Jorpur and Anil .K. Rajvanshi
[6]“Thermal analysis by gasifier system” Reserach paper published in “International Journal of Advance Engineering and Research Development” in Vol. 3,Issue 4, April 2016, Prof S.K. Kulkarni, Prof. Nitinchandra R Patel
[7] Sustainable biomass powerfor rural india, N.H. Ravindranath and H.I. somashekar
[8] Design and development of Sand Bed Filter for upgrading Producer Gas to IC engine Quality Fuel, International Energy Journal 2007, 8, B.S.Patak, D.V.Kapatel, P.R.Bhoi, A.M. Sharma and D.K.Vyas
AUTHORS’ BIOGRAPHY
Prof. Sankalp Kulkarni is an Associate Professor in Mechanical Engineering Department of G. H. Patel College of Engineering & Technology, Vallabh Vidyanagar, Gujarat, India. He did Master degree in Thermal Science in 2004 from M S University, Baroda and Bachelor degree in Mechanical Engineering in 1999 from Jiwaji University, Gwalior. He has total 11 years teaching experience. He presented 1 technical research paper in National conference and 3 in International conference. He has published 2 research paper in International journals. He is a Life member of ISTE.
Prof. Nitinchandra R. Patel is an Assistant Professor in Mechanical Engineering Department of G. H. Patel College of Engineering & Technology, Vallabh Vidyanagar, Gujarat, India. He did Master degree in Machine Design in 2004 from Sardar Patel University, Vallabh Vidyanagar and Bachelor degree in Mechanical Engineering in 1997 from B.V.M . Engineering College, Sardar Patel University. He has total 19 years experience – 5 Years Industrial experience (2 years in Manufacturing and 3 years in Chemical Industries) and 14 years and 4 months teaching experience. He has presented 2 technical research papers in International conferences and published 14 technical research papers in International journals. He reviewed a book published by Tata McGraw Hill in 2012. He is a Member of Institute of Engineers (I) and Life member of ISTE. He is a reviewer / member of Editorial board of Peer-reviewed journals - International Journal of Advance Engineering and Research Development, International Journal of Application or Innovation in Engineering & Management, International Journal of Research in Advent Technology. He is also recognized as a Chartered Engineer by Institute of Engineers (I) in Mechanical Engineering Division in 2012.