The influence of data homogeneity on NLP system performance
Etienne Denoual
ATR Spoken Language Communication Research Labs, 2-2-2 Keihanna Science City, Kyoto 619-0288, Japan
Laboratoire CLIPS - GETA - IMAG, Universit´e Joseph Fourier, Grenoble, France [email protected]
Abstract
In this work we study the influence of corpus homogeneity on corpus-based NLP system performance. Experi-ments are performed on both stochas-tic language models and an EBMT sys-tem translating from Japanese to En-glish with a large bicorpus, in order to reassess the assumption that using only homogeneous data tends to make system performance go up. We de-scribe a method to represent corpus homogeneity as a distribution of sim-ilarity coefficients based on a cross-entropic measure investigated in previ-ous works. We show that beyond min-imal sizes of training data the exces-sive elimination of heterogeneous data proves prejudicial in terms of both per-plexity and translation quality : exces-sively restricting the training data to a particular domain may be prejudicial in terms of In-Domain system perfor-mance, and that heterogeneous, Out-of-Domain data may in fact contribute to better sytem performance.
1 Introduction
Homogeneity of large corpora is still an unclear notion. In this study we make a link between the notions of similarity and homogeneity : a large corpus is made of sets of documents to which may be assigned a score in similarity defined by cross-entropic measures (similarity is implicitly
expressed in the data). The distribution of the similarity scores of such subcorpora may then be interpreted as a representation of the homogeneity of the main corpus, which can in turn be used to perform corpus adaptation to tune a corpus based NLP system to a particular domain.
(Cavagli`a 2002) makes the assumption that a corpus based NLP system generally yields bet-ter results with homogeneous training data rather than heterogeneous, and experiments on a text classifier system (Rainbow1), to mixed conclu-sions. We reassess this assumption by experi-menting on language model perplexity, and on an EBMT system translating from Japanese to En-glish.
2 A framework for corpus homogeneity
2.1 Previous work on corpus similarity and homogeneity
A range of measures for corpus similarity have been put forward in past literature : (Kilgarriff and Rose 98; Kilgarriff 2001) investigated on the similarity of corpora and compared “Known Similarity Corpora” (KSC) using perplexity and cross-entropy on words, word frequency mea-sures, and a χ2-test which they found to be the most robust. However(as acknowledged in (Kilgarriff and Rose 98)), using KSC requires that the two corpora chosen for comparison are sufficiently similar that the most frequent lex-emes in them almost perfectly overlap. How-ever (Liebscher 2003) showed by comparing fre-quency counts of different large Google Group
corpora that it is not usually the case.
Measuring homogeneity by counting word / lexeme frequencies introduces addi-tional difficulties as it assumes that the word is an obvious, well-defined unit, which is not the case in the Chinese (Sproat and Emerson 2003) or Japanese language (Matsumoto et al., 2002), for instance, where word segmentation is not trivial.
(Denoual 2004) showed that similarity between corpora could be quantified with a coefficient based on the cross-entropies of probabilistic mod-els built upon reference data. The approach needed no explicit selection of features and was language independent, as it relied on character based models (as opposed to word based models) thus bypassing the word segmentation issue and making it applicable on any electronic data.
The cross-entropyHT(A)of an N-gram model
p constructed on a training corpus T, on a test corpusA={s1, .., sQ}ofQsentences withsi = {ci
1..ci|si|}a sentence of|si|characters is:
HT(A) =
PQ
i=1[
P|si|
j=1−logpij]
PQ
i=1|si|
(1)
wherepij =p(cij|cij−N+1..cij−1).
We therefore define a scale of similarity be-tween two corpora on which to rank any third given one. Two reference corporaT1 andT2 are selected by the user, and used as training sets to compute N-gram character models. The cross-entropies of these two reference models are es-timated on a third test set T3, and respectively namedHT1(T3)andHT2(T3)as in the notation in
Eq. 1. Both model cross-entropies are estimated according to the other reference , i .e ., HT1(T2)
andHT1(T1),HT2(T1)andHT2(T2)so as to
ob-tain the weightsW1andW2 of referencesT1and T2:
W1= HT1(T3)−HT1(T1)
HT1(T2)−HT1(T1)
(2)
and :
W2= HHT2(T3)−HT2(T2)
T2(T1)−HT2(T2)
(3)
After which W1 and W2 are assumed to be the weights of the barycentre between the user-chosen references. Thus
I(T3) = W W1 1+W2 =
1 1 +W2
W1
(4)
is defined to be the similarity coefficient between reference sets 1 and 2, which are respectively cor-pus T1 and corpus T2 . Given the previous as-sumptions, I(T1) = 0 andI(T2) = 1; further-more, any given corpusT3yields a score between the extremaI(T1) = 0andI(T2) = 1
This framework may be applied to the quantifi-cation of the similarity of large corpora, by pro-jecting them to a scale defined implicitly via the reference data selection. In this study we shall specifically focus on a scale of similarity bounded by a sublanguage of spoken conversation on the one hand, and a sublanguage of written style me-dia on the other.
We build upon this previous work in order to represent intra-corpus homogeneity.
2.2 Representing corpus homogeneity
Corpora are collected sets of documents usually originating from various sources. Whether a cor-pus is homogeneous in content or not is scarcely known besides the knowledge of the nature of the sources. As homogeneity is multidimensional (see (Biber 1988) and (Biber 1995) for consid-erations on the dimensions in register variation for instance), one cannot trivially say that a cor-pus is homogeneous or heterogeneous : different sublanguages show variations that are lexical, se-mantic, syntactic, and structural (Kittredge and Lehrberger 1982).
In this study we wish to implicitly capture such variations by applying the previously described similarity framework to the representation of ho-mogeneity. Coefficients of similarity may be computed for all smaller sets in a corpus, the dis-tribution of which shall depict the homogeneity of the corpus relatively to the scale defined im-plicitly by the choice of the reference data.
3 A study of the homogeneity of a large bicorpus
3.1 Data
Reference data is needed to set up a scale of sim-ilarity, and implicitly bound it.
For the sublanguage of spoken conversation we used for both English and Japanese the SLDB (Spontaneous Speech Database) corpus, a multi-lingual corpus of raw transcripts of dialogues de-scribed in (Nakamura et al., 1996).
For the sublanguage of written style media, we used for English a part of the Calgary2 corpus, containing several contemporary English litera-ture pieces3, and for Japanese a corpus of col-lected articles from the Nikkei Shinbun newspa-per4.
The large multilingual corpus that is used in our study is the C-STAR5Japanese / English part of an aligned multilingual corpus, the Basic Trav-eller’s Expressions Corpus (BTEC).
A prerequisite of the method is that levels of data transcriptions are strictly normalized, so that the comparison is not made on the transcription method but on the underlying signal itself.
3.2 Homogeneity in the BTEC
The BTEC is a collection of sentences originat-ing from 197 sets (one set originatoriginat-ing from one phrasebook) of basic travel expressions. Here we examine the distribution of the similarity coeffi-cients assigned to its subsets.
The corpus may be segmented in a variety of manners, however we wish to proceed in two intu-itive ways : firstly, by keeping the original subdi-vision, i .e ., one phrasebook per subset ; secondly, at the level of the sentence, i .e ., one sentence per subset . Figure 1 shows the similarity coefficient distributions for Japanese and English at the sen-tence and subset level, and Table 1 shows their means and standard deviations.
The difference in means and standard deviation
2
The Calgary Corpus is available via anonymous ftp at ftp.cpcs.ucalgary.ca/pub/projects/text.compression.corpus .
3
Parts are entitled book1, book2 and book3.
4The use of classical Japanese literature is not
appropri-ate as (older) copyright-free works make use of a consider-ably different language. In order to maintain a certain homo-geneity, we limit our study to contemporary language.
5See http://www.c-star.org .
Coefficient Japanese English
Phrasebook 0.330±0.020 0.288±0.027
Line 0.315±0.118 0.313±0.156
Table 1: Means±standard deviations of the simi-larity coefficient distributions in Japanese and En-glish.
values can be explained by the fact that all phrase-books do not have the same size in lines6. The dis-tribution of similarity coefficients at the line level, however similar to the distribution at the phrase-book level, suggests in its irregularities that it is indeed safer to use a larger unit to estimate cross-entropies. Moreover, we wish not to tamper with the integrity of the original subsets, that is to keep the integrity of phrasebook contents as much as possible.
On the phrasebook level, the similarity coef-ficient has a low correlation on both the aver-age phrasebook length (0.178) and the average line length (0.278) (which does not make it a too “shallow” profiling method). On the other hand, correlation is high between the coefficients in Japanese and English (0.781), which is only to be expected intuitively.
4 Experiments
4.1 Method
This work wishes to reassess the assumption that, for a same amount of training data, a corpus-based NLP system performs better when its data tends to be homogeneous. Here we use the rep-resentation of homogeneity defined by the sim-ilarity coefficient scale to select data that tends to be homogeneous to an expected task. Exper-iments shall be performed both on randomly se-lected data, and on data sese-lected according to their similarity coefficient. The closer the coefficient of the training data is to the coefficient of the ex-pected task, the better.
We assume that the task is sufficiently repre-sented by a set of data from the same domain as the large bicorpus used, the BTEC. Experiments are performed on a test set of 510 Japanese sen-tences which are not included in the ressource.
6The BTEC phrasebooks have an average size of 824
0 0.2 0.4 0.6 0.8 1 0
100 200 300 400 500 600 700 800
Japanese BTEC Coefficients
Occurrences
0 0.2 0.4 0.6 0.8 1
0 100 200 300 400 500 600 700 800
English BTEC Coefficients
Occurrences
Line level
[image:4.595.127.474.66.225.2]Phrasebook level Line levelPhrasebook level
Figure 1: Distributions of similarity coefficients at the sentence level (thin line) and at the phrasebook level (thick line), respectively for Japanese and English.
0 50 100
0 0.2 0.4 0.6 0.8 1
BLEU score (interpolated)
0 50 100
4 6 8 10
Percent of the original BTEC in size
NIST score (interpolated)
0 50 100
0 0.2 0.4 0.6 0.8 1
mWER score (interpolated)
Randomly selected data Homogeneous data
Figure 2: BLEU, NIST and mWER scores for EBMT systems built on increasing amounts of randomly chosen and homogeneous BTEC data.
These sentences shall first be used for language model perplexity estimation, then as input sen-tences for the EBMT system. The task is found to have a coefficient ofI0= 0.331. The average co-efficient for a BTEC phrasebook being0.330, the task is found to be particularly in the domain of the ressource. We examine the influence of train-ing data size first on language model perplexity, then on the quality of translation from Japanese to English by an example-based MT system.
4.1.1 Language model perplexity
Even if perplexity does not always yield a high correlation with NLP systems performance, it is still an indicator of language model complexity as it gives an estimate of the average branching fac-tor in a language model. The measure is popular in the NLP community because admittedly, when
perplexity decreases, the performance of systems based on stochastic models tends to increase.
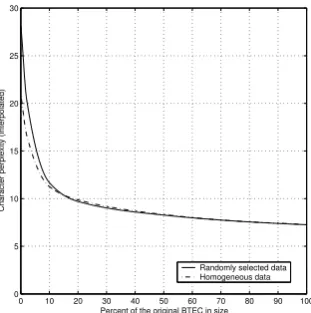
[image:4.595.97.499.286.426.2]0 10 20 30 40 50 60 70 80 90 100 0
5 10 15 20 25 30
Percent of the original BTEC in size
Character perplexity (interpolated)
[image:5.595.104.260.64.221.2]Randomly selected data Homogeneous data
Figure 3: Perplexity of character language models built on increasing amounts of randomly chosen BTEC and homogeneous Japanese data.
While homogeneous data yield lower perplex-ity scores for small amounts of training data (up to15% of the ressource - roughly1.5Megabytes of data), beyond this value perplexity is slightly higher than for a model trained on randomly se-lected data. Except for the smaller amounts of data, there seems to be no benefit in using homo-geneous rather than random heterohomo-geneous train-ing data for model perplexity. On the contrary, excessively restricting the domain seems to yield higher model perplexities.
4.1.2 Automatic evaluation of the translation quality
In this section we experiment on a Japanese to English grammar-based EBMT system, HPATR (described in (Imamura 2001)), which parses a bi-corpus with grammars for both source and target language, and translates by automatically gener-ating transfer patterns from bilingual trees con-structed on the parsed data. Not being a MT system based on stochastic methods, it is used here as a task evaluation criterion complemen-tary to language model perplexity. Systems are likewise constructed on variable amounts of train-ing data, and evaluated on the previous task of 510 Japanese sentences, to be translated from Japanese to English.
Because it is not feasible here to have humans judge the quality of many sets of translated data, we rely on an array of well known automatic eval-uation measures to estimate translation quality :
• BLEU (Papineni et al. 2002) is the geomet-ric mean of the n-gram precisions in the out-put with respect to a set of reference trans-lations. It is bounded between 0 and 1, bet-ter scores indicate betbet-ter translations, and it tends to be highly correlated with the fluency of outputs ;
• NIST (Doddington 2002) is a variant of BLEU based on the arithmetic mean of weighted n-gram precisions in the output with respect to a set of reference translations. It has a lower bound of 0, no upper bound, better scores indicate better translations, and it tends to be highly correlated with the ade-quacy of outputs ;
• mWER (Och 2003) or Multiple Word Error Rate is the edit distance in words between the system output and the closest reference translation in a set. It is bounded between 0 and 1, and lower scores indicate better trans-lations.
Figure 2 shows BLEU, NIST and mWER scores for increasing amounts of data from0.5% to100% of the BTEC and interpolated. As was expected, MT quality increases as training data increases and tends to have an asymptotic be-haviour when more data is being used in training. Here again except for the smaller amounts of data (up to 3% of the BTEC in BLEU, up to18% in NIST and up to 2% in mWER), using the three evaluation methods, translation quality is equal or higher when using random heterogenous data. If we perform a mean comparison of the 510 paired score values assigned to sentences, for instance at
50%of training data, this difference is found to be statistically significant between BLEU, NIST, and mWER scores with confidence levels of88.49%,
99.9%, and73.24%respectively.
5 Discussion and future work
The contribution of this work is twofold :
and atypical therefore heterogeneous data may be characterized by the lower occurrences of their values.
We further observe that marginalizing such atypical data in order to restrict the domain on which a corpus-based NLP system operates does not yield better performance, either in terms of perplexity when the system is based on stochastic language models, or in terms of objective transla-tion quality when the system is a grammar-based EBMT system.
An objective for future work is therefore to study corpus adaptation with Out-of-Domain data. While (Cavagli`a 2002) also acknowledged that for minimal sizes of training data, the best NLP system performance is reached with ho-mogeneous ressources, we would like to know more precisely why and to what extent mixing In-Domain and Out-of-Domain data yields better accuracy. Concerning the representation of ho-mogeneity, other experiments are needed to tackle the multidimensionality of sublanguage varieties less implicitly. We would like to consider multi-ple sublanguage references to untangle the dimen-sions of register variation in spoken and written language.
Acknowledgements
This research was supported in part by the Na-tional Institute of Information and Communica-tions Technology.
References
Douglas Biber. 1988. Variation across speech and
writing. Cambridge University Press.
Douglas Biber. 1995. Dimensions in Register
Varia-tion. Cambridge University Press.
Gabriela Cavagli`a. 2002. Measuring corpus
homo-geneity using a range of measures for inter-document distance. Proceedings of LREC, pp.
426-431.
Etienne Denoual. 2004. A method to quantify corpus
similarity and its application to quantifying the de-gree of literality in a document. Proceedings of the
International Workshop on Human Language Tech-nology, Hong Kong, pp.28-31.
George Doddington. 2002. Automatic evaluation of
machine translation quality using n-gram
co-occurrence statistics. Proceedings of Human Lang.
Technol. Conf. (HLT-02), pp.138-145.
Kenji Imamura. 2001. Hierarchical Phrase Alignment
Harmonized with Parsing. Proceedings of NLPRS,
pp.377-384.
Adam Kilgarriff and Tony Rose. 1998. Measures for
corpus similarity and homogeneity. Proceedings of
the 3rd conference on Empirical Methods in Natural Language Processing, Granada, Spain, pp. 46 - 52.
Adam Kilgarriff. 2001. Comparing corpora. Interna-tional Journal of Corpus Linguistics 6:1, pp. 1-37.
Richard Kittredge and John Lehrberger. 1982.
Sublan-guage. Studies of language in restricted semantic domains Walter de Gruyter, editor.
Robert A. Liebscher. 2003. New corpora, new tests,
and new data for frequency-based corpus compar-isons. Center for Research in Language Newsletter,
15:2
Yuji Matsumoto, Akira Kitauchi, Tatsuo Yamashita, Yoshitaka Hirano, Hiroshi Matsuda,Kazuma Takaoka and Masayuki Asahara. 2002.
Morpholog-ical Analysis System ChaSen version 2.2.9 Manual.
Nara Institute of Science and Technology.
Atsushi Nakamura, Shoichi Matsunaga, Tohru Shimizu, Masahiro Tonomura and Yoshinori Sag-isaka 1996. Japanese speech databases for robust
speech recognition. Proceedings of the ICSLP’96,
Philadelphia, PA, pp.2199-2202, Volume 4
Franz Josef Och. 2003. Minimum Error Rate Training
in Statistical Machine Translation. Proceedings of
ACL 2003, pp.160-167.
Kishore Papineni, Salim Roukos, Todd Ward and Wei-Jing Zhu. 2002. Bleu: a Method for Automatic
Evaluation of Machine Translation. Proceedings of
ACL 2002, pp.311-318.
Richard Sproat and Thomas Emerson. 2003. The First
International Chinese Word Segmentation Bakeoff.