Overview of the 2014 ALTA Shared Task: Identifying Expressions of
Locations in Tweets
Diego Molla
Macquarie University, Sydney, Australia [email protected]
Sarvnaz Karimi CSIRO, Australia
Abstract
This year was the fifth in the ALTA se-ries of shared tasks. The topic of the 2014 ALTA shared task was to identify location information in tweets. As in past com-petitions, we used Kaggle in Class as the framework for submission, evaluation and communication with the participants. In this paper we describe the details of the shared task, evaluation method, and results of the participating systems.
1 Introduction
Locations are important pieces of information in social media. When people discuss an event, often they mention where that event is taking place or what they see where. In the case of emergencies, such locations could lead the right resources to the correct place or from the correct route. Also, rec-ommender systems that locate suitable products and services for users require location informa-tion. This year, the fifth Australasian Language Technology Association (ALTA) shared task was set to identify expressions of locations identifiable on the map from Twitter messages. A total of 7 teams registered to the competition, with 4 teams submitting their results.
In this paper we describe the background of the shared task, evaluation methods, and results of participating systems. Section 2 describes the shared task. Section 3 gives a short survey of re-lated research. Section 4 describes the data set that was used. Section 5 details the evaluation process. Section 6 shows the results. Section 7 discusses some of the key challenges and issues encountered during the organisation of the shared task. Finally, section 8 concludes the paper and points to the methods used by participating teams.
Tweet Location
France and Germany join the US and UK in advising their nationals in Libya to leave immediately http://bbc.in/1rVmrDJ
France, Germany, US, UK, Libya
Dutch investigators not going to MH17 crash site in eastern Ukraine due to security concerns, OSCE monitors say
MH17 crash site, eastern Ukraine
Seeing early signs of potential flash flooding with stationary storms near St.
Marys, Tavistock, Cambridge #onstorm
pic.twitter.com/BtogIxgQ5G St. Marys, Tavistock, Cambridge
Table 1: Example tweets and their location words.
2 The 2014 ALTA Shared Task
The goal of the 2014 shared task was to identify all mentions of locations in the text of tweets. Lo-cation was defined as any specific mention of a country, city, suburb, street, or POI (Point of In-terest). Examples of POI include the name of a shopping centre, such as “Macquarie Centre” or the name of a hospital, e.g., “Ryde Hospital”. This information extraction task is important for appli-cations that attempt to find out where people are or whether they are talking about which location.
The shared task required the participants to only identify which word in the text of a tweet refers to a location, and did not expect the participants to find the location on the map. Table 1 shows example tweets and their locations.
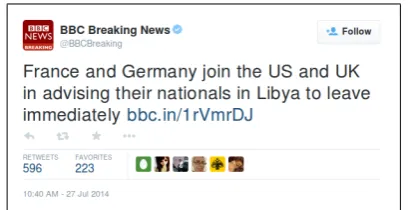
Figure 1: An example tweet with multiple location mentions.
a system only identifies “Ukraine”, it was partially correct.
Participants were given a list of tweet IDs and a script to download the tweets from Twitter. Each system had to find the location mentions, and list them all in lowercase as blank separated words next to their tweet ID. For example, for the tweet shown in Figure 1, the expected output was
493450763931512832,france germany us uk libya.
All punctuation in the word containing the loca-tion had to be removed, including the hash symbol (#). If a location was repeated in a tweet, it was ex-pected that the systems to find all the occurrences. That is, each instance of a location is counted on its own, even if repeated.
Different instances of a location word were dis-tinguished by appending a number. For example, if there were three mentions of Australia, the out-put would be
australia australia2 australia3. Participants were also asked if a location had multiple words, to separate them with blank space so that, in effect, it does not matter whether it is one location expression with two words or two dif-ferent location expressions. Table 2 shows an ex-tract of the sample solution.
3 Related Work
Research community has been active in location extraction and inferencing locations based on the extracted location mentions from both formal text and social media. Below, we briefly cover two ar-eas of named entity recognition and location ex-traction in social media, especially Twitter.
3.1 Named entity recognition in Twitter
Ritter et al. (2011) developed a set of tools de-signed specifically to perform tasks such as NER
and part of speech tagging (POS) on tweets. They use distant supervision with topic modelling using an approach called LabelledLDA (Ramage et al., 2009). One of the entities in the NER tool pro-vided by Ritter et al, was geo-location.
TwiNER (Li et al., 2012) is another NER system for Twitter. It follows an unsupervised approach which exploits the co-occurrence information of named entities in a tweet stream. A significant difference with Ritter et. al.. (Ritter et al., 2011) is that TwiNER does not rely on linguistic fea-tures asserting that they are unreliable in the tweet domain. Instead its algorithm relies on external sources such as Wikipedia. This system however only identifies named entities and it does not clas-sify them into a type such as organisation or loca-tion.
3.2 Location extraction
A number of systems have been developed to ex-tract location information from tweets. There are several studies that identify Twitter user’s location based on their profile and their tweets. Some of these studies are briefly reviewed here.
Twitcident (Abel et al., 2012) is a system which uses NER to attach location information to tweets as part of a semantic enrichment stage. Other studies into NER in Twitter include Locke and Martin’s (2009) work that investigated the perfor-mance of a classifier trained on a small Twitter corpus against an adapted classifier designed for a different text domain. They indicated that the tweet and newswire domains are very different.
Mahmud et al. (2012) proposed an algorithm to predict the home locations of Twitter users at dif-ferent granularities at the state and city level. They used an ensemble of classifiers based on contents and temporal characteristics of tweets. Their sys-tem also leveraged external information sources such as gazetteers. Their dataset was limited to 100 cities in the United states.
TwitterStand (Sankaranarayanan et al., 2009) is a system that associates a cluster of tweets with a geographical focus by combining information extracted from analysing tweet content and user metadata. Hashtags were used to search Twitter for more tweets relating to specific topics. They used POS tagging and NER to identify location words and then use a gazetteer to resolve loca-tion words to specific places. They did not retrain their NER because at the time they stated that no annotated tweet corpus existed. They assigned a geographic focus to clusters of tweets which have been grouped by topic.
Finally, Lingad et al. (2013) compared the ex-isting NER tools, such as out of the box Stan-ford NER and OpenNLP, re-trained StandStan-ford NER, TwitterNLP for their ability to identify lo-cations. They also compared these tools with Ya-hoo! PlaceMaker, a geoparsing service that iden-tifies place names in a given free-form text. Their main conclusion was that the existing NER tools should be re-trained before being applied to Twit-ter data.
The ALTA 2014 task was proposed on the level of identifying the location mentions from the tweets and did not cover finding where they refer to on the map.
4 Dataset
The dataset for the task was largely from the tweet collection created and annotated for a study of lo-cation extraction from disaster tweets (Lingad et al., 2013). Lingad’s original collection was cre-ated using tweets from late 2010 till late 2012. It was later on augmented with a newer set of tweets (Yin et al., 2014). All these tweets were annotated in multiple stages, including whether or not they were related to disaster-related events, their location mentions, as well as their location focus (Karimi and Yin, 2012; Yin et al., 2014). Only location mention annotations were used in the ALTA shared task.
The size of the final set was 3,220 tweets, though, as mentioned in Section 7.1, a smaller set of 3,003 tweets had to be used for the shared task. Of this data set, 2,000 tweets were made avail-able for training and development, and the rest was used for a public and a private evaluation as de-scribed in Section 5. The split between training and test partitions was based on the date of the tweet postings, so that the training test use older
tweets, and the test set used newer tweets. By splitting according to time there is a lesser risk of contaminating the test set, since it has been observed that tweets may focus on special topics and locations at particular points in time. In prac-tice, since Twitter generates tweet IDs sorted by time, we used the IDs to implement the partition-ing. The partitioning of the test set into the public and the private sets was random, using the frame-work provided by Kaggle in Class.
Annotations for the dataset was crowdsourced using the CrowdFlower service.1 Annotators were required to be from English speaking countries. Each tweet was annotated by three different an-notators and only those with majority agreement made it to the final set.
To comply with Twitter policy, we only pro-vided tweet identifiers and their corresponding an-notations. Participants were required to download the tweets that were still publicly available directly from Twitter.
5 Evaluation Measures
To evaluate the results we used the setup provided by Kaggle in Class.2 With this setup, a random partition of the test set (501 tweets) was allocated for a public evaluation, and a disjoint partition (502 tweets) was allocated for a private evalua-tion. The participating teams returned the output of their systems on the combined public and pri-vate partitions, but they did not know what part of the data belonged to what partition. When a team submitted a result, the team received instant feedback on the results of the public partition. In addition, a public leaderboard was maintained by Kaggle in Class, listing the results of the public partition for all teams. The final ranking of the systems was made based on the private partition.
The rationale of keeping these two partitions is that participating systems can receive instant feed-back on their progress but the risk of overfitting their systems to the test results was minimised. To limit overfitting to the public test set, each team was allowed to submit at most two runs every day. The public leaderboard was based on the best run of the public partition for each team, and the par-allel leaderboard that would be used for the final ranking was based on the best run of the private partition for each team.
1
http://www.crowdflower.com/
Team Category Public Private
MQ Student 0.781 0.792
AUT NLP Open 0.748 0.747
Yarra Student 0.768 0.732
[image:4.595.83.282.62.136.2]JK Rowling Open 0.751 0.726
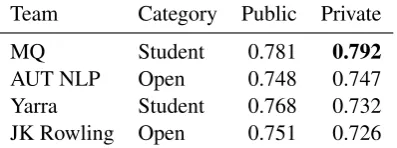
Table 3: Results of the best runs.
To evaluate the results we used the F1 evalua-tion metric implemented in Kaggle in Class.3
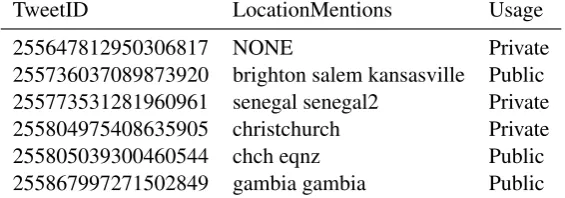
Ta-ble 2 shows some of the rows of the test set. The first two columns indicate the tweet ID and the expected output as explained above. The last column indicates whether the row belongs to the public test set or to the private test set. Participat-ing teams had access to the first column only.
For each row of the test data, the F1 score was computed, and the average F1 was used for scor-ing the run. The formula for F1 is:
F1 = 2 pr
p+r,
where p is the precision, measuring the ratio of correct location mentions returned by the partici-pating system among all mentions returned by the participating system, and r is the recall, measur-ing the ratio of location mentions returned by the system among all location mentions.
Thus, if, for example a system returns
senegal christchurch brighton
for the third tweet in Table 2 with tweet id 255773531281960961, then
p = 1/3
r = 1/2
F1 = 0.4
6 Results
Table 3 shows the results of the participating sys-tems for both the private and the public partitions, sorted by private partition in descending order.
As in past years, participant teams belonged to two categories:
Student: All participants are undergraduate or post-graduate students. No members of the team can be full-time employed or can have a PhD.
Open: There are no restrictions.
3https://www.kaggle.com/wiki/
MeanFScore
The final prize is awarded to the top student team.
The top team, MQ, is from the student category and it achieved the best results both in the public and private partitions of the data. They are there-fore the winning team. Team Yarra was also a student team, and there were three other student teams registered in the competition but they did not submit any runs. Teams AUT NLP and JK Rowling belonged to the Open category.
The results produced by the systems are lower than those reported by Lingad et al. (2013), who reported a top F-measure of 0.902. But note that the amount of training data available to the teams was more limited. Also, note that the partitions used in the shared task were split in time, and as mentioned in Section 4, probably this will produce lower results compared with random partition and represent the results of a more realistic scenario.
7 Discussion
The organisation of this task presented a number of challenges, both in the collection of the data and the evaluation process.
7.1 Collection of the data
TweetID LocationMentions Usage
255647812950306817 NONE Private
255736037089873920 brighton salem kansasville Public
255773531281960961 senegal senegal2 Private
255804975408635905 christchurch Private
255805039300460544 chch eqnz Public
[image:5.595.158.441.64.163.2]255867997271502849 gambia gambia Public
Table 2: Sample lines of the test set.
Team Category Public Private
MQ Student 0.759 0.778
AUT NLP Open 0.736 0.742
Yarra Student 0.758 0.720
JK Rowling Open 0.738 0.712
Table 4: Results of the best runs using the original test set that had some annotation errors.
7.2 Evaluation process
Location mentions could be based on multiple words, and there could be repeated locations. However, Kaggle in Class had some constraints on the data format and the choice of evaluation metrics.4 We therefore converted the annotations from multiple-word expressions to single words, and numbered repeated instances of a word as de-scribed in Section 2. However, the conversion pro-cess incorporated a bug which resulted in some duplicated words not having the correct number-ing. A new evaluation using corrected data re-vealed that the results returned by the systems were slightly higher than posted in the public leaderboard (about 0.01–0.02 higher for each run), and the rankings were not changed. Possibly, the small impact of this error was due to the fact that the training data had the same annotation inconsis-tencies, and the number of data affected was small. Table 4 shows the results using the original test set.
8 Conclusions
The 2014 ALTA shared task focused on identi-fying location mentions in Twitter data. The or-ganisation was facilitated by the framework pro-vided by Kaggle in Class. As in previous runs of the ALTA shared task, this framework facilitated the maintenance of registration, evaluation of the
4
The constraints are partly due to the fact that Kaggle in Class is free, and as a consequence it has limited support. The paid version of Kaggle does not necessarily have these constraints.
runs, and communication with the teams. On the other hand, the limited choice of submission for-mats and evaluation metrics added some challenge to the organisation of the task.
The number of participants in this year’s shared task was reduced in comparison with past years. This was due to the fact that the task was not in-corporated in the assessment component of exist-ing academic subjects, in contrast with, for exam-ple, the shared task of 2013. Still, some of the participants were very active, and for example, the total number of runs submitted among the 4 teams was 168.
The details of some of the systems participat-ing in this year’s competition have been included in the proceedings of the 2014 Australasian Lan-guage Technology Workshop (ALTA 2014). The systems used a range of techniques, including the use of sequence labellers, feature engineering, and combination of classifiers following ensemble and staking processes. Parma Nand et al. (2014) re-port on AUT NLP’s team. They used the Stan-ford named entity recogniser without training it with the tweed data due to the reduced amount of training data available, in conjunction with vari-ous rule-based modules and knowledge infusion. Fei Liu (2014) report on Yarra’s team. They use a variety of lexical, structural and geospatial fea-tures together with CRF++’s Conditional Random Field (CRF) sequence labeller. They also exper-imented with classifier stacking and methods for self-training. Finally, Bo Han et al. (2014) report on JKRowling’s team. They used a CRF sequence labeller and experimented with topic labelling and semi-supervised learning.
Acknowledgments
The data and the task original idea is from John Lingad’s Honours project (The University of Syd-ney) co-supervised with Jie Yin (CSIRO).
Research.
References
Fabian Abel, Claudia Hauff, Geert-Jan Houben, Richard Stronkman, and Ke Tao. 2012. Semantics + filtering + search = Twitcident. exploring
informa-tion in social web streams. In Proceedings of the
23rd ACM conference on Hypertext and social
me-dia, pages 285–294, Milwaukee, Wisconsin.
Bo Han, Antonio Jimeno Yepes, Andrew MacKinlay, and Qiang Chen. 2014. Identifying twitter
loca-tion menloca-tions. In Gabriela Ferraro and Stephen
Wan, editors,Proceedings of the 2014 Australasian
Language Technology Workshop (ALTA 2014), Mel-bourne, Australia.
Yohei Ikawa, Miki Enoki, and Michiaki Tatsubori.
2012. Location inference using microblog
mes-sages. In the 21st international conference
com-panion on World Wide Web, pages 687–690, Lyon, France.
Sarvnaz Karimi and Jie Yin. 2012. Microtext annota-tion. Technical Report EP13703, CSIRO.
Chenliang Li, Jianshu Weng, Qi He, Yuxia Yao, An-witaman Datta, Aixin Sun, and Bu-Sung Lee. 2012. Twiner: named entity recognition in targeted twitter
stream. Inthe 35th international ACM SIGIR
con-ference on Research and development in information retrieval, pages 721–730, Portland, Oregon.
John Lingad, Sarvnaz Karimi, and Jie Yin. 2013. Lo-cation extraction from disaster-related microblogs. In The 22Nd International Conference on World Wide Web Companion, pages 1017–1020, Rio de Janeiro, Brazil.
Fei Liu, Afshin Rahimi, Bahar Salehi, Miji Choi, Ping Tan, and Long Duong. 2014. Automatic identifi-cation of expressions of loidentifi-cations in tweet messages using conditional random fields. In Gabriela
Fer-raro and Stephen Wan, editors, Proceedings of the
2014 Australasian Language Technology Workshop (ALTA 2014), Melbourne, Australia.
Brian Locke and James Martin. 2009. Named
en-tity recognition: Adapting to microblogging. Senior thesis, University of Colorado.
Jalal Mahmud, Jeffrey Nichols, and Clemens Drews. 2012. Where is this tweet from? inferring home lo-cations of Twitter users. InThe International AAAI Conference on Weblogs and Social Media, pages 511–514, Dublin, Ireland.
Parma Nand, Rivindu Perera, Anju Sreekumar, and He Lingmin. 2014. A multi-strategy approach for location mining in tweets: AUT NLP group en-try for ALTA-2014 Shared Task. In Gabriela
Fer-raro and Stephen Wan, editors, Proceedings of the
2014 Australasian Language Technology Workshop (ALTA 2014), Melbourne, Australia.
Daniel Ramage, David Hall, Ramesh Nallapati, and Christopher D. Manning. 2009. Labeled lda: a su-pervised topic model for credit attribution in
multi-labeled corpora. InConference on Empirical
Meth-ods in Natural Language Processing, pages 248– 256, Singapore.
Alan Ritter, Sam Clark, Mausam, and Oren Etzioni. 2011. Named entity recognition in tweets: an
exper-imental study. InProceedings of the Conference on
Empirical Methods in Natural Language
Process-ing, pages 1524–1534, Edinburgh, UK.
Jagan Sankaranarayanan, Hanan Samet, Benjamin E. Teitler, Michael D. Lieberman, and Jon Sperling.
2009. Twitterstand: news in tweets. InProceedings
of the 17th ACM SIGSPATIAL International Confer-ence on Advances in Geographic Information Sys-tems, pages 42–51, Seattle, Washington.
Jie Yin, Sarvnaz Karimi, and John Lingad. 2014.
Pinpointing locational focus in microblogs. In