Using a Mixture of N-Best Lists from Multiple MT Systems
in Rank-Sum-Based Confidence Measure for MT Outputs
∗Yasuhiro Akiba†,‡, Eiichiro Sumita†, Hiromi Nakaiwa†, Seiichi Yamamoto†, and Hiroshi G. Okuno‡
† ATR Spoken Language Translation Research Laboratories
2-2-2 Hikaridai, Keihana Science City, Kyoto 619-0288, Japan
‡ Graduate School of Informatics, Kyoto University
Yoshida-Honmachi, Sakyo-ku, Kyoto 606-8501, Japan
{yasuhiro.akiba, eiichiro.sumita, hiromi.nakaiwa seiichi.yamamoto}@atr.jp, and [email protected]
Abstract
This paper addressees the problem of eliminat-ing unsatisfactory outputs from machine trans-lation (MT) systems. The authors intend to eliminate unsatisfactory MT outputs by using confidence measures. Confidence measures for MT outputs include the rank-sum-based confi-dence measure (RSCM) for statistical machine translation (SMT) systems. RSCM can be ap-plied to non-SMT systems but does not always work well on them. This paper proposes an alternative RSCM that adopts a mixture of the N-best lists from multiple MT systems instead of a single-system’s N-best list in the exist-ing RSCM. In most cases, the proposed RSCM proved to work better than the existing RSCM on two non-SMT systems and to work as well as the existing RSCM on an SMT system.
1 Introduction
This paper addresses the challenging problem of eliminating unsatisfactory outputs from machine translation (MT) systems, which are subsystems of a speech-to-speech machine translation (S2SMT) system. The permissible range of translation quality by MT/S2SMT systems depends on the user. Some users permit only perfect translations, while other users permit even translations with flawed grammar. Unsatisfactory MT outputs are those whose transla-tion quality is worse than the level the user can per-mit.
In this paper, the authors intend to eliminate un-satisfactory outputs by using confidence measures for MT outputs. The confidence measures1indicate how perfect/satisfactory the MT outputs are. In the
∗ This research was supported in part by the Ministry of Public Management, Home Affairs, Posts and Telecommunications, Japan.
1
These confidence measures are a kind of automatic evalu-ator such as mWER (Niessen et al., 2000) and BLEU (Papineni et al., 2001). While mWER and BLEU cannot be used online, these confidence measures can. This is because the former are based on reference translations, while the latter is not.
discipline of MT, confidence measures for MT out-puts have rarely been investigated.
The few existing confidence measures include the rank-sum-based confidence measure (RSCM) for statistical machine translation (SMT) systems,
Crank in (Ueffing et al., 2003). The basic idea of this confidence measure is to roughly calculate the word posterior probability by using ranks of MT outputs in an N-best list from an SMT system. In the discipline of non-parametric statistical test, ranks of numerical values are commonly used in-stead of the numerical values themselves for statis-tical tests. In the case of the existing RSCM, the ranks of probabilities of MT outputs in the N-best list were used instead of the probabilities of the out-puts themselves. The existing RSCM scores each word in an MT output by summing the comple-mented ranks of candidates in the N-best list that contain the same word in a Levenshtein-aligned po-sition (Levenshtein, 1966). When the confidence values of all words in the MT output are larger than a fixed threshold, the MT output is judged as cor-rect/perfect. Otherwise, the output is judged as in-correct/imperfect.
The existing RSCM does not always work well
0 0.2 0.4 0.6 0.8 1
0 0.2 0.4 0.6 0.8 1
Correct rejection rate: y
Correct acceptance rate: x Performance of existing method (A|BCD)
J2E SAT + Existing method J2E HPAT + Existing method J2E D3 + Existing method
on types of MT systems other than SMT systems. Figure 1 shows the differences among the perfor-mances, indicated by the Receiver Operating Char-acteristics (ROC) curve (Section 4.1), of the exist-ing RSCM on each of three MT systems (Section 4.2.1): D3, HPAT, and SAT (Doi and Sumita, 2003; Imamura et al., 2003; Watanabe et al., 2003). Only SAT is an SMT system; the others are not. The ideal ROC curve is a square (0,1), (1,1), (1,0); thus, the closer the curve is to a square, the better the perfor-mance of the RSCM is. The perforperfor-mances of the existing RSCM on the non-SMT systems, D3 and HPAT, are much worse than that on the SMT sys-tem, SAT.
The performance of the existing RSCM depends on the goodness/density of MT outputs in the N-best list from the system. However, the system’s N-best list does not always give a good approxi-mation of the total sumapproxi-mation of the probability of all candidate translations given the source sen-tence/utterance. The N-best list is expected to ap-proximate the total summation as closely as possi-ble.
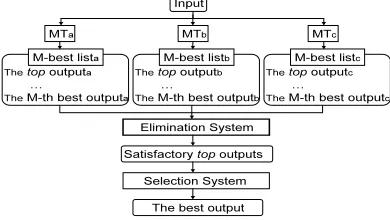
This paper proposes a method that eliminates unsatisfactory top output by using an alternative RSCM based on a mixture of N-best lists from mul-tiple MT systems (Figure 2). The elimination sys-tem is intended to be used in the selector architec-ture, as in (Akiba et al., 2002). The total transla-tion quality of the selector architecture proved to be better than the translation quality of each element MT system. The final output from the selection sys-tem is the best among the satisfactory top2 outputs from the elimination system. In the case of Fig-ure 2, the selection system can receive zero to three top MT outputs. When the selection system receive fewer than two top MT outputs, the selection sys-tem merely passes a null output or the one top MT output.
The proposed RSCM differs from the existing RSCM in its N-best list. The proposed RSCM
re-2
To distinguish the best output from the selection system, the MT output in the first place in each N-best list (e.g., N-best listain Figure 2 ) refers to the top MT output.
The best output Elimination System
Selection System Satisfactory topoutputs
MTa MTb MTc
Thetopoutputa …
TheM-th best outputa
Input
M-best lista
Thetopoutputb …
TheM-th best outputb M-best listb
Thetopoutputc …
TheM-th best outputc M-best listc
Figure 2: Image of our eliminator
ceives an M-best list from each element MT sys-tem. Next, it sorts the mixture of the MT outputs in all M-best lists in the order of the average product (Section 3.2) of the scores of a language model and a translation model (Akiba et al., 2002). This sorted mixture is used instead of the system’s N-best list in the existing RSCM.
To experimentally evaluate the proposed RSCM, the authors applied the proposed RSCM and the ex-isting RSCM to a test set of the Basic Travel Ex-pression Corpus (Takezawa et al., 2002). The pro-posed RSCM proved to work better than the exist-ing RSCM on the non-SMT systems and to work as well as the existing RSCM on the SMT system.
The next section outlines the existing RSCM. Section 3 proposes our RSCM. Experimental results are shown and discussed in Section 4. Finally, our conclusions are presented in Section 5.
2 The Existing RSCM
The existing confidence measures include the rank-sum-based confidence measure (RSCM) for SMT systems (Ueffing et al., 2003). The basic idea of this RSCM is to roughly calculate the word poste-rior probability by using ranks of MT outputs in the N-best list of an SMT system. That is, the ranks of probabilities of MT outputs in the N-best list were used instead of the probabilities of the outputs them-selves, as in the non-parametric statistical test.
Hereafter, eˆI
1 and wI1n denote the top output2
and the n-th best output in the N-best list, respec-tively. eˆidenotes thei-th word in the top MT output
ˆ
eI
1. Li(ˆeI1, wI1n)denote the Levenshtein alignment3
(Levenshtein, 1966) of ˆei on the n-th best output
wIn
1 according to the top output ˆeI1. The existing
RSCM of the wordeˆiis the sum of the ranks of MT outputs in an N-best list containing the wordeˆi in a position that is aligned toiin the Levenshtein align-ment, which is normalized by the total rank sum:
Crank(ˆei) =
PN
n=1(N−n)·δ(ˆei, Li(ˆeI1, wI1n))
N(N + 1)/2 ,
where δ(·,·) is the Kronecker function, that is, if words/morphemesxandyare the same,δ(x, y) = 1; otherwise, δ(x, y) = 0. Thus, only in the case whereeˆi andLi(ˆeI1, wI1n)are the same, the rank of
the MT output wIn
1 , N −n, is summed. In the
calculation of Crank,N −nis summed instead of the ranknbecause ranks near the top of the N-best list contribute more to the scoreCrank.
3
This is the word on then-th best outputwIn
1 , aligned with thei-th wordˆei, in the calculation of edit distance from the top
MT outputˆeI
1to then-th best outputw
In
In this paper, the calculation ofCrank is slightly modified to sum N −n+ 1so that the total sum-mation is equal toN(N + 1)/2. Moreover, when there are MT outputs that have the same score, such MT outputs are assigned the average rank as in the discipline of non-parametric statistical test.
As shown in Section 1, the existing RSCM does not always work well on types of MT systems other than SMT systems. This is because the system’s N-best list does not always give a good approxi-mation of the total sumapproxi-mation of the probability of all candidate translations given the source sen-tence/utterance. The N-best list is expected to ap-proximate the total summation as closely as possi-ble.
3 Proposed Method
In this section, the authors propose a method that eliminates unsatisfactory top output by using an al-ternative RSCM based on a mixture of N-best lists from multiple MT systems. The judgment that the top output is satisfactory is based on the same threshold comparison as the judgment that the top output is perfect, as mentioned in Section 1. The elimination system and the alternative RSCM are explained in Sections 3.1 and 3.2, respectively.
3.1 Elimination system
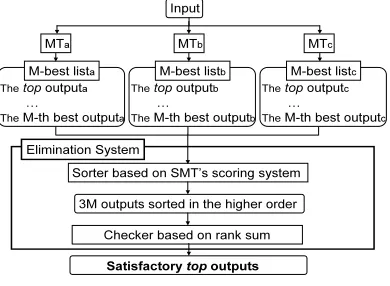
This section proposes a method that eliminates unsatisfactory top outputs by using an alternative RSCM based on a mixture of N-best lists from mul-tiple MT systems (Figure 3). This elimination sys-tem is intended to be used in the selector architec-ture (Figure 2). The elimination system receives an M-best list from each element MT system and outputs only top2outputs whose translation quality
is better than or as good as that which the user can permit. In the case of Figure 3, the number of MT systems is three; thus, the elimination system can output zero to three top MT outputs, which depends on the number of the eliminated top outputs.
MTa MTb MTc
Thetopoutputa
…
TheM-th best outputa
Input
Satisfactory topoutputs M-best lista
Thetopoutputb
…
TheM-th best outputb
M-best listb
Thetopoutputc
…
TheM-th best outputc
M-best listc
3M outputs sorted in the higher order Sorter based on SMT’s scoring system
Checker based on rank sum Elimination System
Figure 3: Proposed RSCM
The proposed elimination system judges whether a top output is satisfactory by using a threshold comparison, as in (Ueffing et al., 2003). When the confidence values of all words in the top out-put, which are calculated by using the alternative RSCM explained in Section 3.2, are larger than a fixed threshold, the top output is judged as satisfac-tory. Otherwise, the top output is judged as unsatis-factory. The threshold was optimized on a develop-ment corpus.
3.2 The proposed RSCM
The proposed RSCM is an extension of the existing RSCM outlined in Section 2. The proposed RSCM differs from the existing RSCM in the adopted N-best list (Figure 3). The proposed RSCM receives an M-best list from each element MT system. Next the proposed RSCM sorts the mixture of all the MT outputs in the order of the average product of the scores of a language model and a translation model (Akiba et al., 2002). This sorted mixture is alter-natively used instead of the system’s N-best list in the existing RSCM. That is, the proposed RSCM checks whether it accepts/rejects each top MT out-put in the original M-best lists by using the sorted mixture; on the other hand, the existing RSCM checks whether it accepts/rejects the top MT out-put in the system’s N-best list by using the system’s N-best.
For scoring MT outputs, the proposed RSCM uses a score based on a translation model called IBM4 (Brown et al., 1993) (TM-score) and a score based on a language model for the translation tar-get language (LM-score). As Akiba et al. (2002) reported, the products of TM-scores and LM-scores are statistical variables. Even in the case where the translation model (TM) and the language model for the translation target language (LM) are trained on a sub-corpus of the same size, changing the training corpus also changes the TM-score, the LM-score, and their product. Each pair of TM-score and LM-score differently order the MT outputs.
For robust scoring, the authors adopt the
multi-ple scoring technique presented in (Akiba et al.,
2002). The multiple scoring technique prepares
C1 Ck
C
k-fold Cross Validation
…..
TM1
LM1 ….. LMk TMk
C0
TM0
LM0
Parallel corpus
multiple subsets of the full parallel corpus accord-ing to k-fold cross validation (Mitchell, 1997) and trains both TM and LM on each subset. Each MT output is scored in k ways. For example, the full parallel corpus C is divided into three subsets
Vi(i = 0, 1, 2). For eachi, the proposed method trains a translation modelT MionCi(= C − Vi) and a language model LMi on the target-language part ofCi(Figure 4). MT outputs in the mixture are sorted by using the average of the product scores byT MiandLMifor eachi. In (Akiba et al., 2002), this multiple scoring technique was shown to select the best translation better than a single scoring tech-nique that uses TM and LM trained from a full cor-pus.
4 Experimental Comparison
The authors conducted an experimental compari-son between the proposed RSCM and the existing RSCM in the framework of the elimination system. The task of both RSCMs was to judge whether each top2MT output from an MT system is satisfactory, that is, whether the translation quality of the top MT output is better than or as good as that which the user can permit.
In this experiment, the translation quality of MT outputs was assigned one of four grades: A, B, C, or D as follows: (A) Perfect: no problems in either information or grammar; (B) Fair: easy-to-understand, with either some unimportant informa-tion missing or flawed grammar; (C) Acceptable: broken, but understandable with effort; (D) Non-sense: important information has been translated in-correctly. This evaluation standard was introduced by Sumita et al. (1999) to evaluate S2SMT systems. In advance, each top MT output was evaluated by nine native speakers of the target language, who were also familiar with the source language, and then assigned the median grade of the nine grades.
To conduct a fair comparison, the number of MT outputs in the system’s N-best list and the number of MT outputs in the mixture are expected to be the same. Thus, the authors used either a three-best list from each of three MT systems or a five-best list from each of two non-SMT MT systems for the proposed RSCM and a ten-best list for the existing RSCM. Naturally, this setting4is not disad-vantageous for the existing RSCM.
4
In the future, we will conduct a large-scale experiment to investigate how both RSCMs work while increasing the size of the system’s N-best list and the mixture of M-best lists.
Table 1: Confusion matrix
Accept Reject Subtotal Satisfactory Vs,a Vs,r Vs(=Vs,a+Vs,r)
Unsatisfactory Vu,a Vu,r Vu(=Vu,a+Vu,r)
4.1 Evaluation metrics
The performances of both RSCMs were evaluated by using three different metrics: ROC Curve, H-mean, and Accuracy. For each MT system, these metrics were separately calculated by using a con-fusion matrix (Table 1). For example, for J2E D3 (Section 4.2.1), the proposed RSCM checked each top MT output from J2E D3by using the input mixture of three-best lists from the three J2E MT systems (Section 4.2.1); on the other hand, the ex-isting RSCM checked each top MT output from J2E D3by using the input ten-best list from J2E D3. For J2E D3, the results were counted up into the con-fusion matrix of each RSCM, and the metrics were calculated as follows:
ROC Curve plots the correct acceptance rate
ver-sus the correct rejection rate for different values of the threshold. Correct acceptance rate (CAR) is defined as the number of satisfactory outputs that have been accepted, divided by the total number of satisfactory outputs, that is,Vs,a/Vs(Table 1).
Cor-rect rejection rate (CRR) is defined as the number
of unsatisfactory outputs that have been rejected, di-vided by the total number of unsatisfactory outputs, that is,Vu,r/Vu(Table 1).
H-mean is defined as a harmonic mean5 of the CAR and the CRR (Table 1), 2 ∗ CAR ∗
CRR/(CAR+CRR).
Accuracy is defined as a weighted mean6of the CAR and the CRR (Table 1), (Vs ∗CAR+Vu ∗
CRR)/(Vs+Vu)= (Vs,a+Vu,r)/(Vs+Vu).
For each performance of H-mean and Accuracy, 10-fold cross validation was conducted. The thresh-old was fixed such that the performance was maxi-mized on each non-held-out subset, and the perfor-mance was calculated on the corresponding held-out subset. To statistically test the differences in per-formance (H-mean or Accuracy) between the confi-dence measures, the authors conducted a pairwise t-test (Mitchell, 1997), which was based on the results of 10-fold cross validation. When the difference in performance meets the following condition, the dif-ference is statistically different at a confidence level
5
This harmonic mean is used for summarizing two mea-sures, each of which has a trade-off relationship with each other. For example, F-measure is the harmonic mean of pre-cision and recall, which is well used in the discipline of Infor-mation Retrieval.
6
0
Correct rejection rate: y
Correct acceptance rate: x J2E-D3 (A|BCD) Existing method + reordering Contours by H-mean
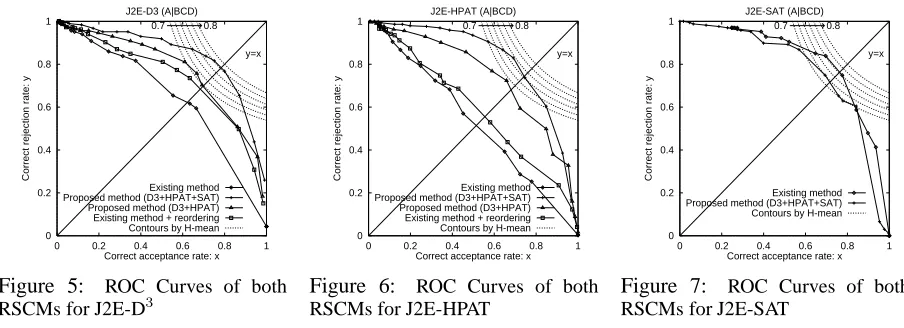
Figure 5: ROC Curves of both RSCMs for J2E-D3
0
Correct rejection rate: y
Correct acceptance rate: x J2E-HPAT (A|BCD) Existing method + reordering Contours by H-mean
Figure 6: ROC Curves of both RSCMs for J2E-HPAT
Correct rejection rate: y
Correct acceptance rate: x J2E-SAT (A|BCD)
Figure 7: ROC Curves of both RSCMs for J2E-SAT
Table 2: Performance of MT systems: Each number in the AB row indicates the ratio of A-or-B-graded translation by each MT system. Each number in the other rows similarly indicates corresponding ratios.
J2E MT systems E2J MT systems D3 HPAT SAT D3 HPAT SAT A 63.7 42.5 67.2 58.4 59.6 69.8 AB 72.1 63.7 74.7 72.9 75.4 81.1 ABC 78.8 79.0 82.5 83.3 86.8 88.0
of 1-α%.
|ppro−pext|> t(α,10−1)∗S/
√ 10,
wherepproand pext, respectively, denote the aver-age performance of the proposed RSCM and the ex-isting RSCM,t(α,10−1)denotes the upperαpoint of
the Student’s t-distribution with(10−1)degrees of freedom, andS denotes the estimated standard de-viation of the average difference in performance.
4.2 Experimental conditions
4.2.1 MT systems
Three English-to-Japanese (E2J) MT systems and three Japanese-to-English (J2E) MT systems of the three types described below were used. Table 2 shows the performances of these MT systems.
D3 (DP-match Driven transDucer) is an
example-based MT system using online-generated translation patterns (Doi and Sumita,
2003).
HPAT (Hierarchical Phrase Alignment based
Translation) is a pattern-based system using
au-tomatically generated syntactic transfer (Imamura
et al., 2003).
SAT (Statistical ATR Translator) is an SMT
system using a retrieved seed translation as the start point for decoding/translation (Watanabe et al., 2003).
4.2.2 Test set
The test set used consists of five hundred and ten pairs of English and Japanese sentences, which
Table 3: Corpora for training TMs and LMs: Basic Travel Expression Corpus Nos. 1-3 (Takezawa et al., 2002), Travel Reservation Corpus (Takezawa, 1999), and MT-Aided Dialogue Corpus No. 1 (Kikui et al., 2003)
.
Japanese English # of sentences 449,357 # of words 3,471,996 2,978,517 Vocabulary size 43,812 28,217 Ave. sent. length 7.7 6.6
were randomly selected from the Basic Travel Ex-pression Corpus (BTEC) (Takezawa et al., 2002). BTEC contains a variety of expressions used in a number of situations related to overseas travel.
4.2.3 Training TMs and LMs
The corpora used for training TMs and LMs de-scribed in Section 3.2 were merged corpora (Table 3). The number of trained TMs/LMs was three. The translation models and language models were learned by using GIZA++ (Och and Ney, 2000) and the CMU-Cambridge Toolkit (Clarkson and Rosen-feld, 1997), respectively.
4.3 Experimental results and discussion
4.3.1 ROC Curve
In order to plot the ROC Curve, the authors con-ducted the same experiment as shown in Figure 1. That is, in the case where the grade of satisfactory translations is only grade A, each of the proposed and existing RSCMs tried to accept grade A MT outputs and to reject grade B, C, or D MT outputs. Figures 5 to 7 show the ROC Curves for each of the three J2E MT systems (D3, HPAT, and SAT).
Table 4:Ten-fold cross-validated pairwise t-test of H-mean: Each set of three columns corresponds to the experimen-tal results of each of the three MT systems: D3, HPAT, and SAT. Each floating number in the first to third column of each MT system indicates the average performance of the proposed RSCM, the average difference of the performance of the proposed RSCM from that of the existing RSCM, and the t-value of the left-next difference, respectively. The bold floating numbers indicate that the left-next difference is significant at a confidence level of 95%. The floating numbers on the three rows for each MT system, whose row heads are “A|BCD”, “AB|CD”, or “ABC|D”, corre-spond to the three types of experiments in which each RSCM tried to accept/reject the MT output assigned one of the grades left/right of “|”, respectively.
E2J-D3 E2J-HPAT E2J-SAT
Separating point Ave. Diff. T-val. Ave. Diff. T-val. Ave. Diff. T-val. A|BCD 76.2 15.7 4.424 73.2 14.1 5.099 65.5 0.3 0.108 AB|CD 77.3 16.5 5.154 72.6 14.3 3.865 66.9 2.8e-5 0.002 ABC|D 74.9 11.4 5.963 74.7 16.6 4.906 73.2 5.5 2.281
J2E-D3 J2E-HPAT J2E-SAT
Separating point Ave. Diff. T-val. Ave. Diff. T-val. Ave. Diff. T-val. A|BCD 76.8 16.1 4.928 75.5 25.8 9.218 70.2 -3.3 1.618 AB|CD 79.6 15.9 4.985 70.8 28.9 6.885 66.0 -5.9 2.545
ABC|D 77.7 14.4 4.177 71.0 22.6 4.598 72.1 1.7 0.588
Table 5: Ten-fold cross-validated pairwise t-test of Accuracy: The description of this figure is the same as that of Table 4 except that Accuracy is used instead of H-mean.
E2J-D3
E2J-HPAT E2J-SAT
Separating point Ave. Diff. T-val. Ave. Diff. T-val. Ave. Diff. T-val. A|BCD 77.4 10.5 4.354 71.1 15.4 5.667 76.4 1.1 1.000 AB|CD 78.2 4.9 2.953 78.2 2.5 2.176 81.1 0.0 0.000 ABC|D 85.0 1.3 1.172 84.1 -2.9 2.182 88.0 0.0 0.000
J2E-D3 J2E-HPAT J2E-SAT
Separating point Ave. Diff. T-val. Ave. Diff. T-val. Ave. Diff. T-val. A|BCD 78.8 15.8 8.243 76.2 18.2 8.118 76.4 3.1 1.041 AB|CD 77.8 4.1 3.279 72.7 8.8 3.288 77.6 -1.5 0.537 ABC|D 83.3 2.9 1.771 77.4 -1.7 1.646 82.7 0.1 0.428
original N-best list was sorted by using the aver-age of the product scores from the multiple scor-ing technique described in Section 3.2, and the ex-isting RSCM with reordering used this sorted sys-tem’s N-best instead of the syssys-tem’s original N-best. The dotted lines indicate the contours by H-mean from 0.7 to 0.8. The ideal ROC curve is a square
(0,1),(1,1),(1,0); thus, the closer the curve is to a square, the better the performance of the RSCM is.
In Figures 5 and 6, the curves of the proposed RSCM by using the mixture of three-best lists from the three MT systems are much closer to a square than that of the existing RSCM; moreover, the curves of the proposed RSCM by using the mixture of five-best lists from the two MT systems are much closer to a square than that of the existing RSCM. Note that the superiority of the proposed RSCM to the existing RSCM is maintained even in the case where an M-best list from the SMT system was not used. The curves of the existing RSCM with re-ordering are closer to a square than those of the ex-isting RSCM. Thus the performance of the proposed RSCM on the non-SMT systems, D3and HPAT, are
much better than that of the existing RSCM. The difference between the performance of the proposed and existing RSCMs is due to both resorting the MT outputs and using a mixture of N-best lists.
In Figure 7, the curve of the proposed RSCM is a little closer when CRR is larger than CAR; and the curve of the existing RSCM is a little closer when CAR is larger than CRR. Thus, the performance of the proposed RSCM on the SMT system, SAT, is a little better than that of the existing RSCM in the case where CRR is regarded as important; sim-ilarly, the performance of the proposed RSCM on the SMT system is a little worse than that of the ex-isting RSCM in the case where CAR is regarded as important.
4.3.2 H-mean and Accuracy
Tables 4 and 5 show the experimental results of ten-fold cross-validated pairwise t-tests of the perfor-mance of H-mean and Accuracy, respectively.
sig-nificantly better than that of the existing RSCM. On the SMT MT system, Table 4 shows that at every permitted level of translation quality, there is no sig-nificant difference between the H-mean of the pro-posed RSCM and that of the existing RSCM except for two cases: “ABC|D” for E2J- SAT and “AB| CD” for J2E- SAT.
Table 5 shows almost the same tendency as Table 4. As for difference, in the case where the transla-tion quality that the user would permit is better than D, there is no significant difference between the Ac-curacy of the proposed RSCM and that of the exist-ing RSCM except in the one case of “ABC|D” for E2J-HPAT.
As defined in Section 4.1, Accuracy is an eval-uation metric whose value is sensitive/inclined to the ratio of the number of satisfactory translations and unsatisfactory translations. H-mean is an eval-uation metric whose value is independent/natural to this ratio. We need to use these different evaluation metrics according to the situations encountered. For general purposes, the natural evaluation metric, H-mean, is better. In the case where the test set reflects special situations encountered, Accuracy is useful.
Regardless of whether we encounter any special situation, in most cases on a non-SMT system, the proposed RSCM proved to be significantly better than the existing RSCM. In most cases on an SMT system, the proposed RSCM proved to be as good in performance as the existing RSCM.
This paper reports a case study in which a mixture of N-best lists from multiple MT systems boosted the performance of the RSCM for MT outputs. The authors believe the proposed RSCM will work well only when each of the element MT systems comple-ments the others, but the authors leave the question of the best combination of complementary MT sys-tems open for future study.
5 Conclusions
This paper addressed the problem of eliminating un-satisfactory outputs from MT systems. It proposed a method that eliminates unsatisfactory outputs by using an alternative RSCM based on a mixture of N-best lists from multiple MT systems. The au-thors compared the proposed and existing RSCMs in the framework of an elimination system. When the number of MT outputs both in the N-best list for the existing RSCM and in the mixture of N-best lists for the proposed RSCM is almost the same number, i.e. ten, in most cases, the proposed RSCM proved to work better than the existing RSCM on two non-SMT systems and to work as well as the existing RSCM on an SMT system.
In the future, the authors will conduct the follow-ing experiments: (1) investigatfollow-ing how the proposed RSCM works when the size of the M-best lists is increased, and (2) seeing how the proposed RSCM influences the performance of the selection system.
References
Yasuhiro Akiba, Taro Watanabe, and Eiichiro Sumita. 2002. Using language and translation models to select the best among outputs from multiple MT systems. In Proc. COLING-2002, pages 8–14.
Peter F. Brown, Stephen Della Pietra, Vincent J. Della Pietra, and Robert L. Mercer. 1993. The mathematics of statistical machine translation: Parameter estimation. Computational Linguistics, 19(2):263–311.
Philip Clarkson and Ronald Rosenfeld. 1997. Statistical lan-guage modeling using the CMU-Cambridge toolkit. In Proc. EUROSPEECH-1997, pages 2707–2710.
Takao Doi and Eiichiro Sumita. 2003. Input sentence splitting and translating. In Proc. the HLT-NAACL 2003 Workshop on DDMT, pages 104–110.
Kenji Imamura, Eiichiro Sumita, and Yuji Matsumoto. 2003. Feedback cleaning of machine translation rules using auto-matic evaluation. In Proc. ACL-2003, pages 447–454. Genichiro Kikui, Eiichiro Sumita, Toshiyuki Takezawa, and
Seiichi Yamamoto. 2003. Creating corpora for speech-to-speech translation. In Proc. EUROSPEECH-2003, vol-ume 1, pages 381–384.
Vladimir I. Levenshtein. 1966. Binary codes capable of cor-recting deletions, insertions and reversals. Soviet Physics Doklady, 10(8):707–710.
Tom M. Mitchell. 1997. Machine Learning. The McGraw-Hill Companies Inc., New York, USA.
Sonja Niessen, Franz J. Och, G. Leusch, and Hermann Ney. 2000. An evaluation tool for machine translation: Fast eval-uation for machine translation research. In Proc. LREC-2000, pages 39–45.
Franz Josef Och and Hermann Ney. 2000. Improved statistical alignment models. In Proc. ACL-2000, pages 440–447. Kishore A. Papineni, Salim Roukos, Todd Ward, and Wei-Jing
Zhu. 2001. Bleu: a method for automatic evaluation of ma-chine translation. In Technical Report RC22176 (W0109-022), IBM Research Division, Thomas J. Watson Research Center, Yorktown Heights, NY, pages 257–258.
Eiichiro Sumita, Setsuo Yamada, Kazuhiro Yamamoto, Michael Paul, Hideki Kashioka, Kai Ishikawa, and Satoshi Shirai. 1999. Solutions to problems inherent in spoken-language translation: The ATR-MATRIX approach. In Proc. MT Summit VII, pages 229–235.
Toshiyuki Takezawa, Eiichiro Sumita, Fumiaki Sugaya, Hiro-fumi Yamamoto, and Seiichi Yamamoto. 2002. Toward a broad-coverage bilingual corpus for speech translation of travel conversations in the real world. In Proc. LREC-2002, pages 147–152.
Toshiyuki Takezawa. 1999. Building a bilingual travel conver-sation database for speech translation research. In Proc. the Oriental COCOSDA Workshop-1999, pages 17–20. Nicola Ueffing, Klaus Macherey, and Hermann Ney. 2003.
Confidence measures for statistical machine translation. In Proc. MT Summit IX, pages 394–401.