Predicting Earned Value Indexes in Residential complexes’
Construction Projects Using Artificial Neural Network Model
Ibraheem A. Aidan1, Firas Kh. Jaber2, , Duaa Al-Jeznawi3, Faiq M. S. Al-Zwainy3 1Al Maarif University College, Ramadi, Iraq
2Electrical Engineering Technical College, Middle Technical University, Baghdad, Iraq 3Department of Civil Engineering, College of Engineering, Al-Nahrain University, Iraq,
ABSTRACT
The importance of this study may be defined by using the smart techniques to earned value indicators of residential buildings projects in Republic of Iraq, only one development intelligent forecasting model was presented to predict Schedule Performance Index (SPI), Cost Performance Index (CPI), and To Complete Cost Performance Indicator (TCPI) are defined as the dependent. The approach is principally influenced by the determining numerous factors which effect on the earned value management, that involves Iraqi historical data. In addition, six independent variables (F1: BAC, Budget at Completion., F2: AC, Actual Cost., F3, A%, Actual Percentage., F4: EV, Earned Value. F5: P%, Planning Percentage., and F6: PV, Planning Value) were arbitrarily designated and satisfactorily described for per construction project. It was found that ANN has the capability to envisage the dust storm with a great accuracy. The correlation coefficient (R) has been 90.00%, and typical accuracy percentage has been 89.00%.
Keywords: Artificial Neural Network, Schedule Performance Index (SPI), Cost Performance Index (CPI), To Complete Cost Performance Indicator (TCPI), Predicting, Models
1. INTRODUCTION
In early stage, a proper estimation is considered as a key factor of a construction project in accomplishment of any intended project. On the other hand, estimation is being a quite complex during the planning stage, while documentation besides drawings are not done yet. Thus, several techniques have been used to achieve a perfectly estimation in an early stage, while the information of the intended project is still restricted.[1]
Regarding the industry requirements, the performance measurement has an essential part in the process of the construction management. In which, the measurement of the performance gives the important data to evaluate factors for the owners of the project, contractors, and the management experts; that is to manage the progress of the construction, to make an estimate of the construction project cost for future. [2]
Different studies have used ANNs model in construction management. Mainly for the classification, making the decision, planning, optimization, and the predicting. William in 1993 promoted networks of back-propagation to estimate varies in the cost index of the construction [3]. Murtaza and Deborah in 1994 applied a neural network individually together with Khonen Algorithm for creating the decision on the modularization of the construction [4]. Hegazy and Moselhi in 1994 applied artificial neural network of back-propagation to obtain a best markup model of estimation, so that resulting in having solutions to new tender situations [5]. Lippmann in 1988 applied an ANN for modeling the rough cost calculations of construction [6]. Chua et al. in 1997 applied ANNs to point out main management factors which have an effect on budget activity in and project [7]. Al- Tabtabai et al. in 1997 applied a network of BP to obtain the decision-making process for the project professionals drawn in schedule monitoring and prediction for incomplete projects of multistory buildings [8]. Adeli and Wu in 1998 presented a regularization neural network to predict the reinforced concrete pavement cost [9]. Hegazy and Ayed in 1998 applied the neural network process to create a model of a parametric cost-estimating for projects of highway [10]. Al-Zwainy et al in 2015 used four neural networks for predicting the budget of highway under multiple criteria.[11]
Consequently, for the studies of the construction management, ANNs are now widely used. A significant gap has been noticed which that none of the above-mentioned studies was interested in earned value management predicting. In Iraq, some scholars have used ANNs in project management.
Al-Zwainy. In 2009 presented four models related to the neural networks in order to predict the overall cost of construction thoroughfare projects in Iraq.[12]
Several names have employed for ANN: connectionist models, predicting models, parallel distributed processing models; forecasting systems; and artificial neural computing. ANN is considered as a part of artificial intelligence (AI) as such structures are depended on the system of the natural nervous. It may present an unbelievable number of the characteristics of human brain, such as; acquire a knowledge and simplified it from previous cases to new problems. Al-Zwainy and Aidan in 2017 found that when the processed data has errors or when the data is incomplete [13], ANN could present significant answers for it and it could process the information quickly when used to solve actual world issues. Neurocomputing architectures may be based on the physical hardware (machine or neurocomputer) or neurosoftware languages (or programs) which can behave just like human beings. The back-propagation network may consider as the most straightforward and realistic networks which applied in doing advanced tasks of human beings like: analysis, classification, making the decision, planning, and scheduling as compared with the different architectures and paradigms. Additionally, the modeling process of the neural network-based includes five important features: data acquisition, problem demonstration, and analyzing, architecture determination; understand the determination of the process; network training; and experimentation of the trained network to take a broad view of evaluation.[14] One of the highly powerful and popular multilayer feed forward network is trained with back-propagation. The training of the developed network is conducted by back-propagation algorithm which was developed and includes three stages of the feed forward of the input training patterns, the calculation and back-propagation stage of the associated error, and the adjustment stage of the weights.[15-16-17]
The foremost goal of this paper is to construct artificial neural networks model to envisage the earned value indicators of residential buildings projects in Republic of Iraq. For achieving this, there is a necessity for identifying the factors that impact residential buildings projects performance. Consequently, the author in this paper is trying improvement of earned value model through the following steps:
1. Choose the appropriate neural networks Software.
2. Identification of ANNs models variables that have an effect on the earned value index in Iraqi residential buildings project.
3. Expansion and investigation of the proposed ANNs models to predict the earned value indexes. 4. Examine the substantiation and authentication of the developed mathematical models.
2. CHOOSE THE APPROPRIATE NEURAL NETWORKS SOFTWARE.
Today, neural networks are used for solving many business problems such as earned value forecasting. The researcher studied many neural network programs. The researcher found that the best program for neural networks, which is easy to use, and is compatible with all the problems simple and complex, and accepts all types of variables and different factors.
Numerous uses that provide for the statistics analysis establishment as in Microsoft Excel, STATISTICA, MINITAB, and MATLAB, however this paper adopts SPSS Program. SPSS stands for Statistical Package for the Social Sciences for the premier statistics analysis environment. The SPSS simulator has visual, easy-to-use, object-oriented method for problem solving by means of intelligent technologies.
SPSS is used by numerous classes of investigators for multifaceted statistical data investigation. Long produced by SPSS Inc., it had been acquired by IBM in 2009. The up-to-date varieties have termed as IBM SPSS Statistics.
3. IDENTİFİCATİON OF ANNS MODELS VARİABLES
This study uses historic data analysis as the methodology foundation. Additionally, using historical data helps in giving a relation among the key factors influencing the earned value parameters of the residential buildings projects to create estimations for new projects.
3 Subsequently, the data has been analyzed. The used data and information collection method in this study is the direct and indirect data gathering from local engineering firms as a sub-contractor. Currently, a noteworthy obstacle interrupted this method due to the unsecured situation in Iraq, and the insufficiency in documentation. Despite of this difficulty, the scientists could gather a trusted and effectively data for more than fourty eight residential constructions projects. That was through coming some companies and introducing the intended documents and reports for residential buildings projects. Moreover, these factors that effect on the earned value indexes adopted in Models of ANN as shown in the Table (1).
Table1. Variables of ANN Models
There are two types of variables that affected on the earned value in residential complex project in Republic of Iraq that are dependent variables and Independent variables.
3.1. Dependent variables
Cost Performance Index (CPI), Schedule Performance Index (SPI), and To Complete Cost Performance Indicator (TCPI) have been defined as the dependent variable and every specific engineering project has employed as the elementary unit of the observation.
3.2 Independent variables
After starting the dependent variables that projected via ANNs model, it has been essential for developing independent variables to clarify any variant in earned value indexes. There are many variables as an independent variable such as:
1)
F1: BAC, Budget at Completion.
2)
F2: AC, Actual Cost.
3)
F3, A%, Actual Percentage.
4)
F4: EV, Earned Value.
5)
F5: P%, Planning Percentage.
6)
F6: PV, Planning Value,
4. DEVELOPMENT OF ANN MODELS
Artificial Intelligent Neural Network (AINN) models must be in a methodical manner for improving its performance. Such method requirements address major factors like development of model inputs, data division and pre-processing, development of model architecture, model optimization (training), stopping standards, and model authentication. An organized approach for evolving the model was employed for solving the problem at hand. This approach has five main phases
:
1) Model inputs and outputs 2) Data division
3) Model architecture
Parameters Input
BAC AC A% EV P% PV
MAX. 867475000 616143750 55% 477111250 60% 520485000 MIN. 867475000 223228750 25% 216868750 20% 173495000 AV. 867475000 392915000 30% 260242500 40% 346990000 RANGE 0.00 406500858 41% 353080781 45% 387410643
ST.D 0.00 94173338 8% 71577599 8% 66736932
Output
SPI CPI TCPI
MAX. 1.2510 1.0573 1.5501
MIN. 0.7143 0.7420 0.9701
AV. 0.5358 0.3153 0.5801
RANGE 0.9101 0.8801 1.1301
4) ANNs Model Equation
5) ANNs Model Validity
Mathematical models are divided into to three parts, the detailed description of these stages are concluded in the following section:
The specified variables at the stage of the data identification, have been applied for developing the ANN models. Three mathematical models have established in this section, the features of the project in a mathematical model were applied to estimate earned value indexes. SPSS version 24 was used as a tool and technique to building the three models, as following:
1) Schedule Performance Index (SPI) 2) Cost Performance Index (CPI),
3) To Complete Cost Performance Indicator (TCPI). Follow the researcher five stages in building this model and as follows: 4.1 Development of Model Inputs and Outputs
Selected model input variables have the most important influence on the model performance as the significant step in evolving ANN models. Huge number of input variables for ANN models typically upsurges the network size, resultant in a reduction in processing speed and a decrease in the network efficiency. Different methods were recommended for selecting input variables such as Method of prior knowledge: based on prior knowledge, the suitable input variables can be chosen. This method is typically used in the field of project management, and is adopted in this study.
As an initial stage for neural network modeling, the problem at hand requires identifying and tagging the data as input or as output. SPSS v.24 has Microsoft Excel sheet, which is used through this step. The independent factors influencing the problem have recognized and measured as (N) input parameters, which are characterized by nodes at the input buffer of a neural network. The output of the model is Schedule Performance Index (SPI) and the input of this model is Earned Value (EV) and Planned Value (PV).
4.2 Data Division ANN Model
Data pre-processing has been highly important for employing neural nets positively. It evaluates what information is presented to produce a model throughout the training phase. Consequently, the subsequent step in the ANN model’s development has been isolating the existing data into three subsets, training, testing and validation sets. Learning has achieved on the training set, that is employed for estimating the weights while the cross-validation set has adopted for generalization for producing better output for unseen instances. Nevertheless, the test set is used for measuring the generalization ability of the network, and evaluated network performance
.
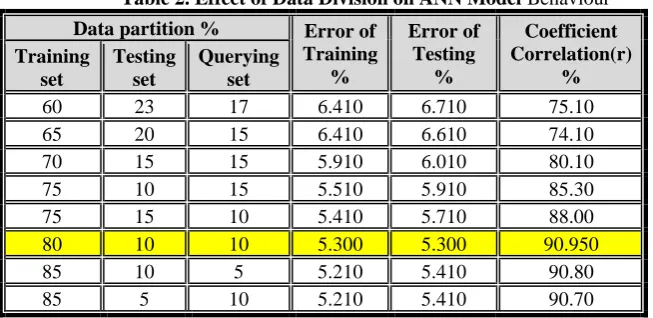
5 Table 2. Effect of Data Division on ANN Model Behaviour
It could be noticed from the Table (2) that the finest part is 80% for training set, 10% testing set, and 10% for validation set, in relation to taken testing error and coefficient of correlation (r) 5.300% and 90.950% respectively. Therefore, this part was accepted in ANN model. The influence of using numerous choices for divisions (i.e. blocked, striped, and random) has considered and presented in Table (3). It can be said that the performance of ANN model was quite insensitive to the separation process. When the striped division was applied, the best performance was achieved.
Table 3. Impacts of Division Method on the ANN Model Behaviour.
Data partition %
Choices Division
Error of Training
%
Error of Testing
%
Coefficient Correlation(r)% Training
set
Testing set
Querying set
80 10 10 Blocked 7.401 9.901 85.01
80 10 10 Striped 5.300 5.300 90.950
80 10 10 Random 6,501 7.701 88.01
4.3 Model Architecture
One of the essential and tricky parts in the development of ANN models is to establish the model architecture. Usually, there is no direct and exact method to determine the proper number of nodes to include in every concealed layer. This issue becomes complex with increasing the number of hidden layers in the neural network.
The network of ANN Model has been adjusted to unique hidden layer through default parameters of the software (learning rate is 0.2 and momentum term is 0.8 and the transfer functions in hidden and output layer node are sigmoid). Many networks with various numbers of hidden layer nodes have been developed and the consequences have been depicted in Table (4), as the highest no. of nodes is (2I+1) in which (I) characterizes the number of input nodes. (i.e. maximum nodes equal to five).
Data partition % Error of Training
%
Error of Testing
%
Coefficient Correlation(r)
% Training
set
Testing set
Querying set
60 23 17 6.410 6.710 75.10
65 20 15 6.410 6.610 74.10
70 15 15 5.910 6.010 80.10
75 10 15 5.510 5.910 85.30
75 15 10 5.410 5.710 88.00
80 10 10 5.300 5.300 90.950
85 10 5 5.210 5.410 90.80
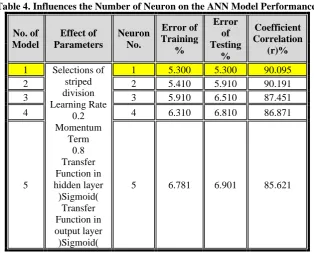
Table 4. Influences the Number of Neuron on the ANN Model Performance.
As a results, only single hidden node has been selected in the present model with the lowermost testing error (5.300 %). It is supposed that the network with one hidden node has been considered optimal. Hence, it has designated in this model.
The influence of the momentum term on model outcomes has been studied for the model of one hidden node (learning rate equal to 0.20). The consequences have presented in Table (5). It could be noticed that the optimal value for momentum term has been (0.8) with minimum testing error of (5.30%), therefore it has been adopted in this model.
Table 5. Influence the Term of Momentum on the ANN Model Outcomes.
Effect of Parameters Term of Momentum Error of Training % Error of Testing % Coefficient Correlation (r)% Model No. 1
0.10 7.710 8.310 80.310
Choices of division (striped)
Learning Rate 0.20 7.610 7.710 83.310
(0.2) 0.30 7.510 7.510 85.210
No. of Nodes
(1) 0.40 6.310 6.610 87.410
Transfer function in
hidden layer(Sigmoid)
0.50 6.310 6.410 87.910
0.60 6.210 6.210 88.410
Transfer function in output layer
(Sigmoid)
0.70 6.110 5.310 89.610
0.80 5.300 5.300 90.950
0.90 5.310 5.219 90.117
0.95 5.310 5.218 90.110
After that, the test errors start to decrease to some extent within 0.8-0.95 range. So that the acquired optimal value for the momentum term has been (0.800) with training error of (5.300%) and significant minimum testing error (5.300 %) and the highest correlation coefficient (r) equal to (90.950 %). Therefore, it has been employed in this model.
No. of Model Effect of Parameters Neuron No. Error of Training % Error of Testing % Coefficient Correlation (r)%
1 Selections of striped division Learning Rate 0.2 Momentum Term 0.8 Transfer Function in hidden layer (Sigmoid ) Transfer Function in output layer (Sigmoid )
1 5.300 5.300 90.095
2 2 5.410 5.910 90.191
3 3 5.910 6.510 87.451
4 4 6.310 6.810 86.871
7
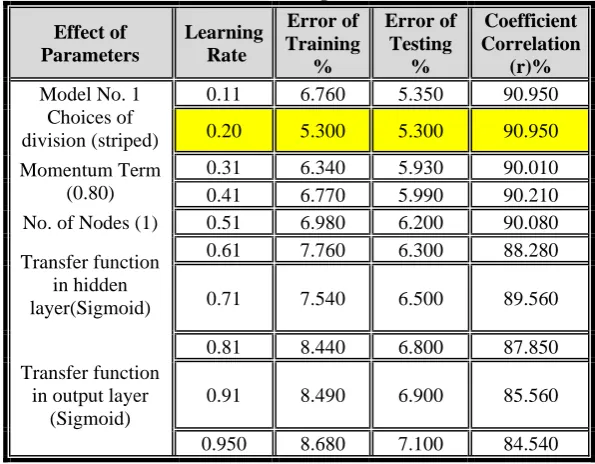
Furthermore, the consequence of the learning rate on the model performance has been examined (momentum term equal to 0.80) for ANN Model. The consequences have presented in Table (6). The optimal value for Learning Rate (LR) has been (0.2) with minimum lowest prediction error of (5.3%); henceforth it has been employed in this model.
Table 6. Influences the Rate of Learning on the ANN Model Performance.
Effect of Parameters
Learning Rate
Error of Training
%
Error of Testing
%
Coefficient Correlation
(r)% Model No. 1
Choices of division (striped)
0.11 6.760 5.350 90.950
0.20 5.300 5.300 90.950
Momentum Term (0.80)
0.31 6.340 5.930 90.010
0.41 6.770 5.990 90.210
No. of Nodes (1) 0.51 6.980 6.200 90.080 Transfer function
in hidden layer(Sigmoid)
0.61 7.760 6.300 88.280
0.71 7.540 6.500 89.560
Transfer function in output layer
(Sigmoid)
0.81 8.440 6.800 87.850
0.91 8.490 6.900 85.560
0.950 8.680 7.100 84.540
Therefore, the gotten optimal value for the Learning Rate (LR) equal to (0.200) with significant testing error, significant value training error and great significant coefficient of correlation (90.950 %); henceforth, it has been employed in this model.
The impacts of adopting dissimilar transfer functions (i.e. tanh and sigmoid) have been examined and as depicted by Table (7). Accordingly, ANNs model performance has been reasonably unresponsive to the kind of the transfer function. The finest performance has been predicted at what time the sigmoid transfer function has been employed for hidden and output layers with the smallest prediction error 5.300 % coupled with highest correlation coefficient (r) (90.950 %).
Table 7. Impact Transfer Functions in ANN Model Performance.
Effect of Parameters
Transfer
Functions Errors Coefficient
correlation (r)% Hidden
Layer
Output Layer
Training %
Testing % Model No.1 Choices
of division (striped) Momentum Term
(0.8) Learning Rate (0.2)
No. of Nodes (1)
sigmoid sigmoid 5.300 5.300 90.950
sigmoid tanh 6.561 6.331 89.991
tanh sigmoid 6.551 6.261 85.391
tanh tanh 5.781 7.161 84.641
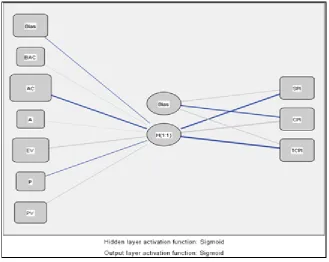
4.4 EVM Indicators Model Equation
Figure 1. Architecture of ANN Model
Table 8. Weight and Threshold Levels for the SPI Optimal
Predictor Predicted
Hidden Layer 1 Output Layer
H(1:1) SPI CPI TCPI
Input Layer
(Bias) -.080
BAC .035
AC -2.446
A .010
EV 1.271
P -.127
PV .537
Hidden Layer 1 (Bias) .735 -2.127 .885
H(1:1) -2.901 3.595 -4.482
Based on connection weight besides the threshold levels presented in Table (8), the prediction of the SPI is written as:
SPI = {1/[1+e(-0.735+2.901tanhx)] +0.71401} ………..… (1) CPI = {1 / [1+e (2.127-3.595tanhx1)] +0.74201} ……… (2) TCPI = {1 / [1+e (-0.885+4.482tanhx1)] +0.9701} …………..… (3) Where:
X = [-0.080 + (0.035*BAC) + (-2.446*AC)+ 0.010*A%+1.271*EV+(-0.127*P%)+0.537*PV] ..(4)
5. VERIFICATION AND VALIDATION OF THE ANN MODEL
The summary of computing Cost Performance Index (CPI), Schedule Performance Index (SPI), and To Complete Cost Performance Indicator (TCPI) by ANN for verification of estimating models has explained by Table (9). Where column two has actual Index that gotten from residential buildings project under construction in Iraq, and column (3) represents estimate Index after applying ANN equation on them, where ANN equation has gotten through SPSS program. The comparison between the estimated and actual Index is shown.
9 Table 9. SPI, CPI and TCPI Calculated through ANN for Verification of Estimating Model
TCPI CPI
SPI
Projects Estimate
by ANN Actual
Estimate by ANN Actual
Estimate by ANN Actual
0.970 00
1.6 0.745
0.770 0.714
1.000 1
1.02142 .000
1 0.845 0.970
0.8653 1.250
2
0.995562 00
1.1 0.84
0.840 0.8143
1.000 3
1.970 1.700
0.845 0.990
1.714 1.900
4
63.38% 80.45%
98.03% Correlation
Coefficient
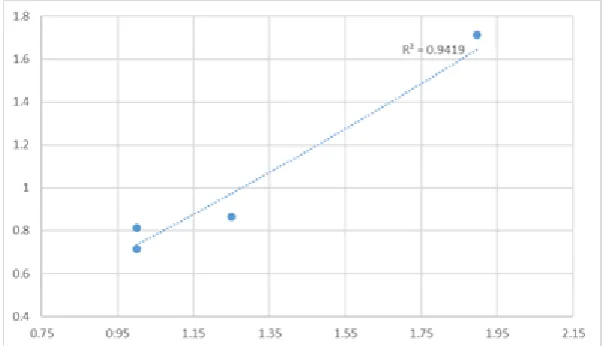
Correlation coefficient between columns (Actual Index and Estimate Index by ANN equal to 98.03%, 80.45% and 63.38% for Schedule Performance Index (SPI), Cost Performance Index (CPI), and To Complete Cost Performance Indicator (TCPI) respectively, therefore it can be concluded that this model has an excellent covenant with the actual measured results, as presented in Figure (2), Figure (3), and Figure (4).
Figure 2. Study the relationship between Observed and Predicted SPI for Validation Data
Figure 4. Study the relationship between Observed and Predicted TCPI for Validation Data
The description of four observations of residential buildings project (variables) is shown in Table (10) below. The Performance Measures have been significant in evaluating models; there have been dual magnitudes used in measuring the network performance for a specific data set.[18]
Table 10. Verification of ANN Model.
Project. F1 BAC
F2 AC
F3 A%
F4 EV
F5 P%
F6 PV
SPI = EV / PV
CPI = EV / AC
TCPI = (BAC-EV)/(BAC-AC) 1 867.48 616 0.55 477 0.55 477 1.00 0.77 1.6 00
2 867.48 223 0.25 217 0.2 173 1.25 0.97 1.000
3 867.48 360 0.35 304 0.35 304 1.00 0.84 1.1 00 4 867.48 308 0.35 642
304 0.45 338 1.90 0.99 1.700
a) Mean Absolute Percentage Error (MAPE)
Based on Boussabaiena in 1999, the mean absolute percentage error is defined by the following formula [19]:
MAPE = { ∑ |𝑨−𝑬|
𝑨 𝒏
𝒊=𝟏 * 100 % \n } ……….………...….(5)
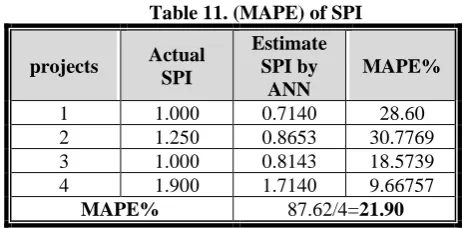
Table 11. (MAPE) of SPI
MAPE% Estimate
SPI by ANN Actual
SPI projects
28.60 0.7140
1.000 1
30.7769 0.8653
1.250 2
18.5739 0.8143
1.000 3
9.66757 1.7140
1.900 4
87.62/4=21.90 MAPE%
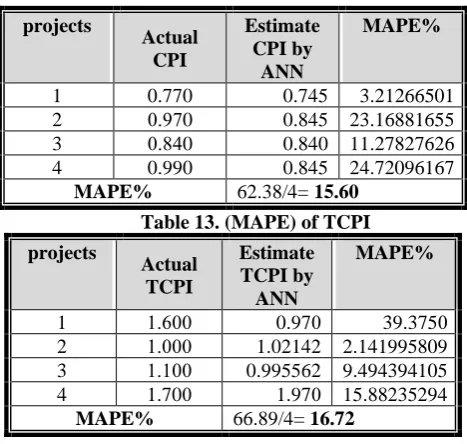
11 MAPE% Estimate CPI by ANN Actual CPI projects 3.21266501 0.745 0.770 1 23.16881655 0.845 0.970 2 11.27827626 0.840 0.840 3 24.72096167 0.845 0.990 4
62.38/4= 15.60 MAPE%
Table 13. (MAPE) of TCPI
MAPE% Estimate TCPI by ANN Actual TCPI projects 39.3750 0.970 00 1.6 1 2.141995809 1.02142 .000 1 2 9.494394105 0.995562 00 1.1 3 15.88235294 1.970 1.700 4
66.89/4= 16.72 MAPE%
b) Average Accuracy (AA):
In conjunction with Wilmot and Mei, Accuracy performance has been described as (100−MAPE) %. Average Accuracy (AA) can be calculated by the following formula [20-21]:
AA%=100-MAPE ………... (6)
The outputs of the comparative study have been specified in Table (14). The MAPE and average Accuracy percentage produced by ANN model (SPI) have been 21.90% and 78.10% correspondingly. Consequently, ANN model (SPI model) has a good conformity with the actual measured results, MAPE and AA% produced by ANN model (CPI) have been 15.60% and 84.40% respectively. Therefore, it can be concluded that ANN model (CPI model) shows a great conformity with the actual measurements, MAPE and AA% generated by ANN model (TCPI) have been 161.72% and 83.82% respectively. For that reason, ANN model (TCPI model) has great conformity with the actual measured results
.
Table 14. Results of the Comparative Study
6. CONCLUSIONS
In this research the ANN technique was developed for the earned value analysis. The ANN system has been applied in order to develop new prediction model by using backpropagation process by SPSS software. Historical data in this technique was used into three flocks, which are training, testing and validating. It has been noticed that the ANN technique shows excellent results of prediction. The consequences have been deduced based on Average Accuracy (AA%) equal to 78.10, 84.09, 84.40 and 83.82, also, correlation coefficient (R) equal to 93.03%, 80.45% and 63.38% for SPI, CPI and TCPI respectively. The model of estimation that derived by ANN technique pointed out that there are a few variations among the hypothetical and the applied consequences. As a results, ANN method stands for the finest choice for developing the prediction model since it has more correct earned value estimation.
Descript ion ANN model SPI ANN model CPI ANN for model TCPI
MAPE 21.90% 15.60 16.72
AA% 78.10% 84.40 83.82
R 0.9303 0.8045 0.6338
THE AVAILABILITY OF DATA
The study findings which are supported by the data, are obtainable by the correspondings writer upon requests.
INTEREST CONFLICTS
The writers affirmed that they hadn’t interest conflicts.
ACKNOWLEDGMENT
I’d like to thank those respected persons who have helped and guided us to achieve this paper; they really deserve all respect and gratitude. Then, we’d like to thank all the staff of Al-Nahrain University in Iraq to help us to get guideline for our paper by providing us lots of consultations. As well as, we also want to thank and give our gratitude to everyone who has guided or advised us in submitting or writing this paper.
REFERENCES
[1] F. M. S. Al-Zwainy, I. A. Mohammed, S. H. Raheem, “Investigation and assessment of the project management methodology in Iraqi construction sector”, International Journal of Applied Engineering Research, vol. 11, no. 4, p. 2494-2507, 2016.
[2] F. M. S. Al-Zwainy and T. H. Neran, “Investigation and Evaluation of the Cost Estimation Methods of Iraqi Communication Projects,” International Journal of Engineering and Management Research, IJEMR, vol. 5, no. 6, p. 41- 48, 2015 .
[3] T.P. William “Neural networks to predict construction cost indexes. In: Neural Networks and Combinatorial Optimization in Civil and Structural Engineering” (Eds B. H. V. Topping and A. I. Khan). Civil-Comp Press, Edinburgh, Scotland. pp. 47-52, 1993.
[4] M. Murtaza and F. Deborah “NEUROMODEX-Neural Network System for Modular Construction Decision Making”. Journal of Computing in Civil Engineering ASCE. vol. 8, no. 2, p. 221-233, 1994.
[5] T. Hegazy and O. Moselhi “Analogy-based solution to markup estimating problem”. Journal of Computing in Civil Engineering ASCE. Vol. 8, no. 1, p. 72-87, 1994.
[6] R.P. Lippmann “An introduction to computing with neural nets. In: Artificial Neural Networks; Theoretical Concepts”. (Ed. V. Vemuri). The Computer Society, Washington, USA. pp. 36-54, 1988.
[7] D.K.H. Chua, Y.C. Kog, P.K. Loh and E.J. Jaselskis. “Model for construction budget performance-neural network approach”. Journal of Construction Engineering and Management. Vol. 123, no. 3, p. 214-222, 1997.
[8] H. Al-Tabtabai, N. Kartam, I. Flood. and A. P. Alex. “Expert judgment in forecasting construction project completion”. Engineering Construction and Architectural Management. Vol. 4, no. 4, p. 271-293, 1997.
[9] H. Adeli and M. Wu. “Regularization neural network for construction cost estimation”. Journal of Construction Engineering and Management. Vol. 124, no. 1, p. 18-24, 1998.
[10] T. Hegazy and A. Ayed. “Neural network model for parametric cost estimation of highway projects”. Journal of Construction Engineering and Management. Vol. 124, no. 3, p. 210-218, 1998.
[11] F. M. S. Al-Zwainy, R. H. Al-Suhaily, Z. M. Saco, “Project Management and Artificial Neural Networks: Fundamental and Application”, LAP LAMBERT Academic Publishing, 2015.
[12] F. M. S. Al-Zwainy, “The Use of Artificial Neural Network for Estimating Total Cost of Highway Construction Projects”, a thesis submitted to the Civil Engineering Department, College of Engineering, Baghdad University, Ph.D. 2009.
13 [14] X. Wu and S. Y. Lim “Prediction of maximum scour depth at spur dikes with adaptive neural networks. In: Neural
Networks and Combinatorial Optimization in Civil and Structural Engineering” (Eds B. H. V. Topping and A. I. Khan). Civil-Comp Press, Edinburgh, Scotland. pp. 61-66, 1993.
[15] F. M. S. Al-Zwainy, "The Use of Artificial Neural Networks for Productivity Estimation of finish Works for Building Projects", Journal of Engineering and Development, vol. 16, no. 2, p. 42-60, 2012.
[16]S. Kh. Zamim, N. S. Faraj, I. A. Aidan, F. M. S. Al-Zwainy, M. A. AbdulQader, I.m A. Mohammed, "Prediction of dust storms in construction projects using intelligent artificial neural network technology", Periodicals of Engineering and Natural Sciences, vol. 7, no. 4, p. 1659-1666. 2019.
[17] B. S. Babu, A. Suneetha, G. C. Babu, Y. J. N. Kumar, G. Karuna, and G. W. Optimization, “Medical Disease Prediction using Grey Wolf optimization and Auto Encoder based Recurrent Neural Network,” Periodicals of Engineering and Natural Sciences, vol. 6, no. 1, pp. 229–240, 2018.
[18] Faiq M. S. Al-Zwainy and T. H. Neran, “Application Artificial Forecasting Techniques in Cost Management (review)”. Journal of Engineering, Vol. 22, No. 8, pp. 1-15, 2016.
[19] Boussabaine, A., Thomas, R. and Elhag, T. “Modelling cost‐flow forecasting for water pipeline projects using neural networks”, Engineering, Construction and Architectural Management, vol. 6, no. 3, pp. 213-224, 1999.
[20] Wilmot and Mei, “Neural Network Modeling of Highway Construction Costs”, Journal of Construction Engineering and Management, vol.131, no. 7, 2005.