Using Objective Data Analysis to Construct and Evaluate
NBA Players' Value Model
Che-Wei Chang
Department of Recreational & Graduate Institute of Recreational Sport Management, National Taiwan University of Sport, No. 16, Sec. 1, Shuang-Shih Road, Taichung, 404 Taiwan, R. O. C.;
[email protected]; Tel: 886+4-22213108
Abstract: The value of an NBA basketball player varies at each crucial point in time, depending on the player’s career and performance. This study constructs a player’s value assessment model. The model comprises two parts. First, from an objective perspective, entropy is employed to measure each player’s achievement in five categories—rebounds, assists, steals, blocked shots, and scores. The total entropy assessment value is calculated and then combined with the players’ scores to develop a player's value matrix to assess the relative value model among players of the same type.
Keywords: NBA; player’s value; entropy; multi-attribute decision-making; player’s value matrix; value positioning model
1. Introduction
Lei et al. (2010) employed the event study method to analyze the economic impact of the partnership between six professional sports organizations (NFL, MLB, NBA, NASCAR, NHL, and PGA) and enterprises. The study showed that marketing-centered partnership with financially sound and well-managed companies contributes the most to the enhancement of shareholders’ wealth. However, on May 27, 2011, the National Basketball Players Association (NBPA) filed a lawsuit to American Arbitration Association, accusing NBA (National Basketball Association) of adopting intimidation and threats in new collective bargaining to force the NBPA to sign a new collective bargaining agreement that was unfavorable to the players. Since the labor dispute took place before the start of the season, and both sides failed to reach an agreement after a long period of time, the closure of the arena and work stoppage were announced on July 1, 2011. During the 149 days’ suspension, 100 games were suspended, and there was a loss of US$83 million in ticket revenue alone, which resulted in heavy loss to both the employers and the employees (Cai, 2011). Since then, both parties have learned their lessons and steered toward sustainable management and development through the global promotion of NBA, collaboration with powerful partners in the international market, and boundless extension of star-making campaigns and products. Yi (2016) pointed out that NBA broadcasts to 212 countries in 42 languages and viewed by more than 750 million households worldwide. Michael (2017) reported that in 2017, the ratings of the NBA regular season increased by 32% with an average of 1.4 million viewers every day. Forbes (2017) reported that the average value of an NBA team reached US$1.36 billion. In the past five years, this figure has increased 3.5 folds. The growth of a team’s value was mainly owing to the US$24 billion television deal signed between the NBA and ESPN and TNT, which generated an annual output value of up to US$10 billion and spread NBA’s peripheral business opportunities across a variety of industries. The “Big Three” of sports brands—Nike, Adidas, and Under Armour—have also invited NBA star players to endorse their products; as the endorsement fee easily amounts to hundreds of millions of U.S. dollars, it has become the players’ main source of income in addition to their annual salary from the team. Assessing players’ present and future value is therefore a triple-win strategy for team operations, advertisers, and the players. As a result, it is important to discuss how to select
the indices for objectively assessing basketball players to create higher value for the athletes and enable the sustainable management and development of teams and their players.
This study constructs a player’s value assessment model and evaluates the player’s value from an objective big data perspective. First, it uses entropy to measure the uncertainty of information based on its occurrence probability and calculates each player’s total entropy from an objective perspective regarding rebounds, assists, steals, blocked shots, and scores. Then, each player’s total entropy assessment value and scores are integrated to develop the value positioning model for athletes of the same type, which offers information on the relative value and competitiveness of different players and serves as important reference for the teams and advertisers in the management of players.
2. Relevant Literature on Evaluating Multi-attribute Decision-making from an Objective Perspective
The objective weight of multiple attribute decision making include (i) the PCA method which was further stated from the hidden layer of the Artificial Neural Network method to cope with the non-linear problem (Chen and Chiou, 1999); (ii) the objective weights of decision-making attributes which can be achieved from entropy (Ma et al., 1999; Pivato, 2014). It is noted that Bhabani and Bijwe (2004) and Xu (2004) use entropy to calculate objective weights of decision-making attributes; (iii) the idea of Marichal (2002) to utilize entropy to calculate relative weights of decision-making attributes and then apply discrete Choquet integral method to calculate performance values of assessing program (Kojadinovic, 2004); (iv) Niu et al. (2108) performed the analysis of temporalized structure of bodies of evidence using the mathematical model of experts’ evaluations to construct decisions that are more precise; and (v) the grey relational analysis (GRA), which mainly focuses on uncertainty, incomplete information, and unclear operation in system model to implement relative analysis of a system (Deng, 1989).
Peachey et al. (2013) Gutiérrez and Ruiz (2017) used Data Envelopment Analysis (DEA) and cross-efficiency to assess the relative strengths, weaknesses, and performance of 66 handball players from the Royal Spanish Handball Federation. They then ranked the players based on cross-efficiency. Chard and Potwarka (2017) used the Analytic Hierarch Process (AHP) to assess the salient factors influencing student-athletes’ decisions to attend university institutions. The study found that having a desired academic program was the most important influencing factor. Other factors included reputation of the school, scholarship value, athletic facilities, chance to win, and reputation of the head coach. Zhao et al. (2018) proposed a safety assessment model for transporting dangerous goods by air. This model utilized AHP for the subjective weights and entropy for the objective weights, comparing the two approaches to compute a safety assessment model and provide references for management and decision-making. Hu and He (2018) combined GRA and entropy and put forward a driver-pressure-state-impact-response model to assess a city’s adaptability to climate change. Every multi-attribute decision-making and weight calculation method is applicable to solving different problems. This study obtains the big data of the top 10 guards based on their performance in five categories – rebounds, assists, steals, blocked shots, and scores — from the NBA official website (NBA Advanced Stats, 2018) and related reports. By clear statistical calculations and using the characteristics of entropy, the total assessment value of each guard is calculated to develop the player’s value matrix and the player’s value positioning model.
3. Entropy
information on the same basis. Therefore, Xu (2004) used the sum of values measured by the jth decision attribute as the total amount of information produced by the attribute and then calculated the relative amount of information produced by the ith decision-making scheme to
assess the standardized outcome of the assessment index, expressed byXi( )j . The entropy algorithm involves the following steps:
Step 1: Standardize the assessment index.
1
1, 2, , , ij ij m ij i X n X j X = = = L (1)
Step 2: Calculate the relative amount of information of the assessment index.
1
( ) log ( ).
n
j i i
i
E k X j X j
=
= −
(2)
where Ej is between 0 and 1; and
1 ( ) ( ) ( ) i i n i i X j X j X j = = , 1 log k n = .
Step 3: Calculate the weight of the criterion index.
1 1 . (1 ) j j K j j E w E = − = −
(3)Step 4: Calculate the player’s total entropy.
( )
1
( )
n
i i j j
j X j
=
=
(4)4. Analysis of the Rankings of NBA’s Top 10 Shooting Guards
(NBA Advanced Stats, 2018). During the process of selecting and calculating players’ data, players are assumed to be able to finish the remaining games of the season; their current health conditions, excluding distant injury history, are also taken into consideration. In addition, players with the reimbursements for the entire season and their long-term future planning are excluded from the selection.
Table 1. Definitions of assessment indices. Assessment
Criterion
Definition
Rebound In a basketball game, a ball that does not score in the shot produces a rebound. Each shot, be it a blocked shot or a missed free throw, is counted as a rebound.
Factors involved in grabbing rebounds include the player’s height, leaping ability, strength, and proprioception. In general, the center and power forwards perform better in rebounds than other positions.
Assist The act of teammates in scoring, that is, when a player passes the ball to his teammate in a way that leads to a score, the passer is considered “assisting”. Usually, assists determine the success or failure of a game. Score guards tend to get more assists than the inside players because they are mostly attackers and fast-breakers.
Steal By actively interfering with opponents’ attacks, intercepting or smacking the opponent’s ball, and causing a turnover, the player gets a steal. Blocked
Shot
After the offensive player shoots the ball, the defensive player smacks the ball in the air. If no interference and foul is involved, the player will gain a record of a blocked shot.
Table 2. Top 10 guards in the 2016-17 NBA season. Players Rebounds Assists Steals Blocked
Shots
Scores Ranking
James Harden 5 9.1 1.8 0.5 32.0 1
Victor Oladipo 5.3 3.9 1.8 1 24.9 2
DeMar DeRozan 4.3 5 1.2 0.3 25.0 3
Klay Thompson 4.1 2.6 0.7 0.6 20.8 4
Bradley Beal 4.4 3.6 1.2 0.4 23.4 5
Gary Harris 2.8 3.3 1.9 0.3 16.6 6
CJ McCollum 4.2 3.1 0.9 0.4 21.3 7
Tyreke Evans 5.1 4.6 1.1 0.4 19.6 8
Jrue Holiday 4.3 5.2 1.3 0.5 18.3 9
Devin Booker 4.4 4.3 0.9 0.3 25.0 10
Step 1: Standardize the assessment index (Xij).
Table 3. Standardization of top 10 guards in the 2016-17 NBA season.
Players Rebounds Assists Steals Blocked
Shots
Scores
James Harden 0.1139 0.2036 0.1406 0.1064 0.1410
Victor Oladipo 0.1207 0.0872 0.1406 0.2128 0.1097
DeMar DeRozan 0.0979 0.1119 0.0938 0.0638 0.1102
Klay Thompson 0.0934 0.0582 0.0547 0.1277 0.0917
Bradley Beal 0.1002 0.0805 0.0938 0.0851 0.1031
Gary Harris 0.0638 0.0738 0.1484 0.0638 0.0732
CJ McCollum 0.0957 0.0694 0.0703 0.0851 0.0939
Tyreke Evans 0.1162 0.1029 0.0859 0.0851 0.0864
Jrue Holiday 0.0979 0.1163 0.1016 0.1064 0.0807
Devin Booker 0.1002 0.0962 0.0703 0.0638 0.1102
Step2: Calculate the relative amount of information of the assessment index (Ej).
Use formula (2) to calculate the relative amount of information in Table 3. The results are shown in Table 4.
Table 4. Relative amount of information regarding top 10 guards in the 2016-17 NBA season.
Players Rebounds Assists Steals Blocked
Shots
Scores
James Harden -0.1075 -0.1407 -0.1198 -0.1035 -0.1200
Victor Oladipo -0.1109 -0.0924 -0.1198 -0.1430 -0.1053
DeMar
DeRozan -0.0988 -0.1064 -0.0964 -0.0763 -0.1055
Klay
Thompson -0.0962 -0.0719 -0.0690 -0.1141 -0.0951
Bradley Beal -0.1001 -0.0881 -0.0964 -0.0911 -0.1017
Gary Harris -0.0762 -0.0836 -0.1230 -0.0763 -0.0831
CJ McCollum -0.0975 -0.0804 -0.0811 -0.0911 -0.0965
Tyreke Evans -0.1086 -0.1016 -0.0916 -0.0911 -0.0919
Jrue Holiday -0.0988 -0.1087 -0.1009 -0.1035 -0.0882
Devin Booker -0.1001 -0.0978 -0.0811 -0.0763 -0.1055
Step 3: Calculate the weight of the criterion index.
UsingApplying formula (3) to Table 4 yields the relative weights. The results are j =
(rebounds, assists, steals, blocked shots, scores) = (0.0593, 0.3211, 0.2377, 0.3820, 0.0791).
Step 4: Calculate the player’s total entropy.
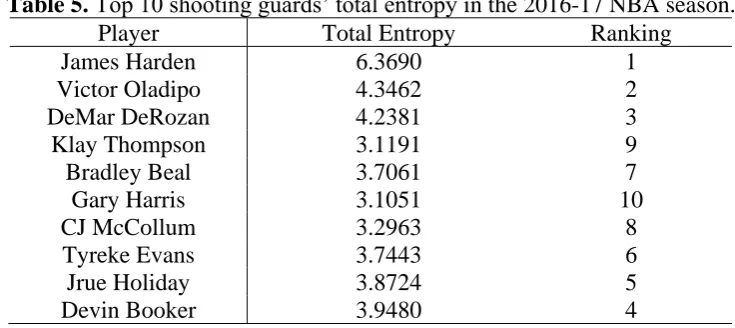
The weights obtained in Step 3 is multiplied by the players’ original scores in Table 1. In other words, formula (4) is used to calculate the total entropy of each player. James Harden’s case is used as an example below to demonstrate how to calculate the players’ total entropy. The final results are shown in Table 5. The rightmost column in Table 5 displays each player’s total entropy ranking.
( )
0.0593 5 0.3211 9.1 0.2377 1.8 0.3820 0.5 0.0791 32 6.3690i j
Table 5. Top 10 shooting guards’ total entropy in the 2016-17 NBA season.
Player Total Entropy Ranking
James Harden 6.3690 1
Victor Oladipo 4.3462 2
DeMar DeRozan 4.2381 3
Klay Thompson 3.1191 9
Bradley Beal 3.7061 7
Gary Harris 3.1051 10
CJ McCollum 3.2963 8
Tyreke Evans 3.7443 6
Jrue Holiday 3.8724 5
Devin Booker 3.9480 4
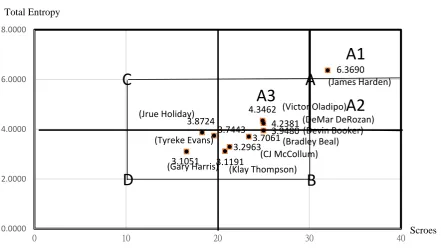
Step 5: Drawing the players’ value assessment matrix.
The total entropy and scores of each player are used to construct the players’ value assessment matrix to evaluate the relative value of each player. The players’ relative values are divided into four zones – A, B, C, and D – in Figure 1. The analysis of their value is as follows:
Level A: Players with i( )j 4 and a score above 20 scores are deemed as high-value shooting guards, which means that they bring investment groups and advertisers the lowest risk in investment and high return on investment. They can not only secure a higher-value contract between the team and the advertiser but also gain higher value as their comprehensive assessment value and scores increase. The training of the players and the team can be further improved to increase the players’ intrinsic value and competitiveness.
Level B: Players with i( )j 4 and a score above 20 scores are considered as high-value guards, but their comprehensive assessment values are lower than those in Level A. Despite the players’ excellent performance in scoring, their four combat skills – rebounds, assists, steals, and blocked shots – require further improvement. It takes time and cost for a team to continue training such players and work towards Level A. The value and the return on investment of the team and advertisers may multiply in the future.
Level C: i( )j 4 and a score below 20 scores mean that the players’ skills in rebounds, assists, steals, and blocked shots are relatively exquisite and stable, but they demonstrate slightly inadequate growth momentum in terms of scoring. It takes time and cost for the team to train this kind of players in the accuracy of shooting and strive towards Level A. The value and return on investment of the team and advertisers may multiply in the future.
Figure 1. Value matrix and positioning model of shooting guards.
5. Conclusions
(1) According to Figure 1, the top 10 shooting guards are located in zones A, B, and D. It shows that, for shooting guards, scoring is the primary focus, and the four comprehensive combat techniques of rebounds, assists, steals, and blocked shots are supplementary. Only James Harden, who ranks first, has a total entropy of over 6 and a score of more than 30 scores as well as a good command of all five combat skills in rebounds, assists, steals, blocked shots, and scores; thus, he is an extraordinary shooting guard. In 2017, James Harden was paid an annual salary of US$28.3 million, and ranked ninth in the League, while the Houston Rockets signed him to a four-year renewal contract at a total value of US$228 million, which is the highest-valued renewal contract in the NBA history. The content of the contract will exceed US$40 million in the 2020-21 season and reach a new high of US$46.87 million in the 2022-23 season, which reflects the value of the No.1 shooting guard (Liu, 2017; Steam, 2017).
(2) DeMar DeRozan, who ranked the 10th in the League, comes third in the total entropy ranking and loses to Victor Oladipo in total entropy by a slight margin of 0.1081, as shown in Table 5. However, in the player’s value matrix shown in Figure 1, regarding the value of score guards, it is clear that DeMar DeRozan is slightly ahead of Victor Oladipo. In the summer of 2016, DeMar DeRozan signed with Raptors a new five-year contract valued US$139 million, doubling his annual salary from US$10.15 million to US$27.74 million in 2017. He also expected his average score per game to increase to over 30 scores.
(3) Given DeMar DeRozan’s expectation that his average scores per game would improve to more than 30 scores, and James Harden’s current average scores per game of 32, the most valuable shooting guards will fall into A1 and A2 in Figure 1. Players can strive towards these two zones and increase their competitiveness accordingly.
(4) This study is to evaluate the top 10 NBA shooting guards to construct a value positioning model. The horizontal axis is based on the score, and the vertical axis is the total entropy assessment value. If basketball teams are to study the value positioning of different roles such
3.9480 3.8724
3.7443
3.2963 3.1051
3.7061
3.1191
4.2381 4.3462
6.3690
0.0000 2.0000 4.0000 6.0000 8.0000
0 10 20 30 40
Total Entropy
A2
A1
Scroes
(James Harden)
(DeMar DeRozan) (Victor Oladipo)
(Devin Booker) (Jrue Holiday)
(Tyreke Evans) (Bradley Beal)
(CJ McCollum) (Klay Thompson) (Gary Harris)
A
B
C
D
as the forwards and center forwards, four evaluation indices including rebounds, assists, steals, and blocked shots can be used as the horizontal axis to analyze the player’s value matrix and positioning model. This allows the teams to review the players’ status, so as to maintain their records.
References
1. Lei, S.; Ghosh, C.; Srinivasan, H., Should They Play? Market Value of Corporate Partnerships With Professional Sport Leagues, J Sport Manage, 24(6), 2010, 702-743.
2. Cai, Y. l., Collective Bargaining Breached Again: NBA Suspended 100 Games. Apple Daily.
https://tw.sports.appledaily.com/daily/20111012/33731470,2011/10/12。
3. Yi, J., The court is like the mall: NBA Economics, Stock Sense Knowledge Base.
https://www.stockfeel.com.tw/%E7%90%83%E5%A0%B4%E5%A6%82%E5%95%86%E5%A0%B4%E7%9
A%84nba%E7%B6%93%E6%BF%9F%E5%AD%B8/, 2016 / 05 / 31.
4. Michael, S., NBA's TV viewership up 32%, highest since 2010-2011 season, USA TODAY,
https://www.usatoday.com/story/sports/nba/2017/11/30/nba-tv-viewership-up-32-espn-tnt-nbatv/910427001/, 2017/11/30.
5. Forbes, (2017), The Business Of Basketball, https://www.forbes.com/sites/thecovercard/2017/02/15/the-business-of-basketball/#37f329fc4894, 2017/2/15.
6. Chen, L. H.; Chiou, T. W., A Fuzzy Credit-rating Approach for Commercial Loans: A Taiwan Case, Omega, Vol. 27, No. 4, 1999, pp. 407-419.
7. Ma, J.; Fan, Z. P.; Huang, L. H., A Subjective and Objective Integrated Approach to Determine Attribute Weights, Eur J Oper Res, Vol. 112, No. 2, 1999, pp. 397-404
8. Pivato, M., Additive Representation of Separable Preferences over Infinite Products, Theory Decis., Vol. 77, No. 1, pp 31-83.
9. Bhabani, K.; Bijwe, S. J., Wear Data Analysis of Friction Materials to Investigate the Simultaneous Influence of Operating Parameters and Compositions, Wear, Vol. 256, No. 6-7, 2004, pp. 797-804.
10. Xu, X., A Note on the Subjective and Objective Integrated Approach to Determine Attribute Weights, Eur J Oper Res, Vol. 156, No. 2, 2004, pp. 530-532.
11. Marichal, J. L., Entropy of Discrete Choquet Capacities, Eur J Oper Res ch, Vol. 137, No. 3, 2002, pp. 612-624.
12. Kojadinovic, I., Estimation of the Weights of Interacting Criteria from the Set of Profiles by Means of Information-theoretic Functionals, Eur J Oper Res, Vol. 155, No. 3, 2004, pp. 741-751.
13. Niu, D.; Li, S.; Dai, S., Comprehensive Evaluation for Operating Efficiency of Electricity Retail Companies Based on the Improved TOPSIS Method and LSSVM Optimized by Modified Ant Colony Algorithm from the View of Sustainable Development, Sustainability, 2018, 10(3), 860.
14. Deng, J. L., “Introduction to Grey System Theory,” The Journal of Grey System, Vol. 1, No. 1, 1989, pp. 1-24.
16. Chard, C. R.; Potwarka, L. R., Exploring the Relative Importance of Factors That Influence Student-Athletes’ School-Choice Decisions: A Case Study of One Canadian University, Journal of Intercollegiate Sport, 10(1), 2017, 22-43.
17. Zhao, H.; Zhang, N.; Guan, Y., Safety Assessment Model for Dangerous Goods Transport by Air Carrier,
Sustainability, 2018, 10(5), 1306.
18. Hu, Q.;He, X., An Integrated Approach to Evaluate Urban Adaptive Capacity to Climate Change,
Sustainability, 2018, 10(4), 1272.
19. NBA Advanced Stats, http://stats.nba.com/, 2018.
20. Hwang, C. L.;Yoon, K., Multiple Attribute Decision Making—Methods and Applications: A State-of-the Art- Survey, Springer- Verlag, New York, 1981.
21. Dan, F., Players’ Abilities Assessment in the 2017-18 NBA Season: Point Guards No. 1-10,
http://bleacherreport.com/users/429923-dan-favale.
22. Liu Y. Y. Sports Income Ranking LeBron James Led 3 Stars to Enter the Top 10. United News.
https://nba.udn.com/nba/story/6780/2511124,2017/6/8.