Open Access Journal of Sports Medicine 2016:7 187–194
Open Access Journal of Sports Medicine
Dove
press
submit your manuscript | www.dovepress.com 187
O R I G I N A L R E S E A R C H
open access to scientific and medical research
Open Access Full Text Article
Incidence and prevalence of elite male cricket
injuries using updated consensus definitions
John W Orchard Alex Kountouris Kevin Sims
1National Cricket Centre, Cricket
Australia, Brisbane, Australia
Background: T20 (Twenty20 or 20 over) cricket has emerged in the last decade as the most popular form of cricket (in terms of spectator attendances). International consensus cricket definitions, first published in 2005, were updated in 2016 to better reflect the rise to prominence of T20 cricket.
Methods: Injury incidence and prevalence rates were calculated using the new international methods and units for elite senior male Australian cricketers over the past decade (season 2006–2007 to season 2015–2016 inclusive).
Results: Over the past 10 seasons, average match injury incidence, for match time-loss injuries, was 155 injuries/1,000 days of play, with the highest daily rates in 50-over cricket, followed by 20-over cricket and First-Class matches. Annual injury incidence was 64 injuries/100 players per season, and average annual injury prevalence was 12.5% (although fast bowlers averaged 20.6%, much higher than other positions). The most common injury was the hamstring strain (seasonal incidence 8.7 injuries/100 players per season). The most prevalent injury was lumbar stress fractures (1.9% of players unavailable at all times owing to these injuries, which represents 15% of all missed playing time).
Discussion: The hamstring strain has emerged from being one of the many common injuries in elite cricket a decade ago to being clearly the most common injury in the sport at the elite level. This is presumably in association with increased T20 cricket. Lumbar stress fractures in fast bowlers are still the most prevalent injury in the sport of cricket at the elite level, although these injuries are more associated with high workloads arising from the longer forms of the game. Domestic and international matches have very similar match injury incidence rates across the formats, but injury prevalence is higher in international players as they play for most of the year without a substantial off-season.
Keywords: injury surveillance, incidence, prevalence, cricket, bowling
Introduction
The first major series of published studies on cricket injuries were made in the late 1980s and early 1990s, with the earliest attempts at recording larger series of inju-ries1–4 and exploring risk factors for lumbar injuries in fast bowlers.5–11 In this era
(1980s–1990s), lumbar injuries in fast bowlers were clearly the major injury concern for the sport. Cricket researchers published the first-ever consensus international injury definitions for a sport in 2005, copublished in four major sports medicine journals.12–15 Since the publication of the initial consensus definitions, a short form of
cricket called T20 (Twenty20 or 20 over) has risen to become one of the most com-mon forms of match play. The initial 2005 definitions contained many definitions that
Correspondence: John W Orchard Sports Medicine at Sydney University, University of Sydney, Corner Western Avenue and Physics Road, NSW 2006, Australia
Tel +61 2 9351 8118
Email [email protected]
Journal name: Open Access Journal of Sports Medicine Article Designation: ORIGINAL RESEARCH Year: 2016
Volume: 7
Running head verso: Orchard et al
Running head recto: Incidence and prevalence of elite male cricket injuries DOI: http://dx.doi.org/10.2147/OAJSM.S117497
Open Access Journal of Sports Medicine downloaded from https://www.dovepress.com/ by 118.70.13.36 on 26-Aug-2020
For personal use only.
This article was published in the following Dove Press journal: Open Access Journal of Sports Medicine
13 December 2016
Dovepress
Orchard et al
were not highly applicable for T20 cricket.16 A new round
of consensus definitions has recently been undertaken with updated definitions published in 2016 in the British Journal
of Sports Medicine.17 Recommended changes to some of
the definitions now require additional injury surveillance publications using the new units and definitions.
In cricket, the majority of injuries are of a noncontact nature and have traditionally been thought of as “overuse” injuries. There is emerging evidence that rapid change in workload is a greater risk factor for many injuries than absolute workload per se,18–22 although the relative
contri-butions between change of workload and absolute workload vary according to injury type.21 The role of workload as a
risk factor for injury is a “hot” topic in almost every major sport.23–25 Cricket is perhaps the best of all the team sports
in which to assess the relationship between workload and injury because many elite players engage in three different forms of the game with marked variations in workload. A bowler can occasionally be required to bowl more than 50 overs (300 balls) in a 4-day period in First-Class cricket,26
and shortly before or after this play in a T20 match and be limited to bowling 4 overs (24 balls) of much greater intensity. The increase in workload variations in the T20 era led to the requirement of revised consensus defini-tions; perhaps the most important of the new definitions was match injury incidence being measured in injuries per 1,000 days of play, which better enabled comparisons between the different forms.
The aim of this study was to present the basic injury epidemiology of elite male cricket using the new definitions for the last decade, then to discuss ways in which injury prevention measures might be successful in the modern era.
Methods
Methods for previous versions cricket injury publications have generally followed the 2005 consensus guidelines.12,14,27,28 In
2016, revised international consensus definitions have been published.17 The major definitional/method changes to
high-light, particularly with respect to this study, are as follows: 1. A “match time-loss” cricket injury in 2005 was defined
as: any injury or other medical condition that either a) prevents a player from being fully available for selection for a major match or b) during a major match, causes a player to be unable to bat, bowl, or keep wicket when required by either the rules or the team’s captain. This definition is retained, but not as the only recommended definition of a cricket injury. Even though other defini-tions are now encouraged (eg, medical attention injuries),
all injury data presented in this paper will still use the “match time-loss” definition, as records for the other injury types do not stretch back over the entire study period for this paper (10 years).
2. For match injury incidence, we have elected in this study to collectively report match injuries from all phases (bat-ting, bowling, and fielding) and to use the unit of injuries per 1,000 team days of play. A result of, say, 220 injuries per 1,000 team days would mean a team of 11 players could expect 220 match time-loss injuries per 1,000 team days. This would convert to 20 injuries per 1,000 player days, or 200 injuries per 10,000 player days if a team was considered to be 11 players.
3. For seasonal injury incidence, our new preferred unit for this paper is (match time-loss) injuries per 100 players per year. This definition is again applied retrospectively. We chose to consider all fully (state/national) contracted players each year as being exposed for “one player per year” for each contracted season. A player contracted to the Big Bash League (BBL T20 competition) only was defined as being exposed for 0.25 of a year (to represent a fair duration in and around the BBL period).
4. Injury prevalence (as defined in consensus) considers the average number of squad members not available for selection through injury or illness for a given time period divided by the total number of squad members. In this context, it is a “period prevalence” type measure that measures contribution to missed match playing time. Injury prevalence is expressed as a percentage, representing the percentage of players missing through injury on average for that team for the season in question. To accurately pair with the injury incidence data in this paper (which considers match time-loss injuries only), we calculate injury prevalence on match days only. New definitions allow injury prevalence to be calculated using a 365-day technique (ie, considering player availability during nonmatch days), but we did not use this method in this paper. An injury prevalence figure of, say, 12% indicates that for the matches played in the 10 years under survey, on average 12% of players were unavailable for those matches because of injury or illness.
We also used the updated injury categories recommended in the new consensus injury definitions.
When presenting injury incidence and prevalence in this paper among the various forms of cricket, we chose to combine international and domestic level injury rates for the T20 form of cricket, but keep domestic and international data separate for the longer forms of cricket. This was done
Open Access Journal of Sports Medicine downloaded from https://www.dovepress.com/ by 118.70.13.36 on 26-Aug-2020
Dovepress Incidence and prevalence of elite male cricket injuries
because in some seasons there were very few international T20 matches and it would be misleading to independently present international T20 injury data for seasons where only a handful of matches were played. In every season, there were a substantial number of One Day International (ODI 50 over) matches and Test matches (First-Class), so annual separation of international matches in these formats was justified.
Data collection for this study has involved one constant process to maintain reliability, which is the recording of player status for every team in every game ie, whether each player 1) played and completed the match in question; 2) played the match but was injured and unable to complete it; 3) was unavailable for selection in the match because of injury; 4) was unavailable for selection in the match for other noninjury reasons; or 5) was available for selection but not selected. At the start of this study, in season 2006– 2007, most of the communications regarding injury details were on request from the first author to team doctors and physiotherapists to explain absence from match play. Within the next few years, Cricket Australia moved to an electronic recordkeeping system where doctors and physiotherapists entered records and the injury surveillance coordinator was given access to download the necessary injury details.
The methods used for Cricket Australia injury surveillance conform to the Code of Ethics of the World Medical Association (Declaration of Helsinki) and the latest National Health and Medical Research Council guidelines for research. They were approved by the Cricket Australia Sports Science Sports Medicine Advisory Group as the relevant institutional review board. This study used de-identified data extracted from the injury surveillance system, which presents no risk of harm to any of the current or past players, so it is also considered to be of negligible risk and therefore requires internal only rather than external ethical review under National Health and Medical Research Council guidelines (statement available from https://www.nhmrc. gov.au/_files_nhmrc/file/guidelines/ethics/human_research/ NS_low_risk_flow_chart.pdf; Accessed May 7, 2016).
Results
Injury incidence
Match injury incidence is presented in Table 1 in the new consensus unit of injuries per 1,000 days of play. Over the decade, match injury incidence was highest in season 2010–2011, followed by season 2011–2012. It was lowest in the first season of the last decade, 2006–2007. For the last three seasons, match injury incidence has been close to the average for the decade.
Average match incidence rates for First-Class cricket were very similar at domestic and international (Test match) levels. Similarly, average match incidence rates for 50-over cricket were very similar at domestic and international (ODI) levels. As discussed in the section “Methods”, the T20 rate presented is a hybrid of domestic and international matches because in some seasons only a handful of international matches are played.
Annual incidence is presented in Table 2, with the cat-egories presented in descending order of injury frequency. The most common (highest incidence) injury over the decade was clearly the hamstring strain (8.7 match time-loss injuries per 100 players per year). It is notable that in 2006–2007, hamstring strains were ranked only fourth in injury incidence for the year (well below the No. 1 injury for the season, side strains). From 2007–2008 onward, though, hamstring strains have been the most common injury every season.
The majority of injuries exhibited fairly constant incidence rates from season to season. Ankle sprains appear to have decreased over the last three seasons. Concussion has increased over the past two seasons, although it should be borne in mind that Table 2 presents only match time-loss injuries.
Injury prevalence
Injury prevalence rates have risen and fallen in similar fashion to incidence rates, with 2010–2011 and 2011–2012 having had the highest rates. Prevalence rates for all four major positions were highest in the two-season period 2010–2011 and 2011–2012.
Table 1 Injury match incidence (new and recurrent injuries/1,000 days of play)
2006– 2007
2007– 2008
2008– 2009
2009– 2010
2010– 2011
2011– 2012
2012– 2013
2013– 2014
2014– 2015
2015– 2016
Average
T20 cricket 200 282 100 91 328 127 172 200 241 220 194
Domestic 50 over 220 233 355 290 323 440 200 250 205 152 271
Domestic First-Class 112 153 150 92 158 160 94 119 110 83 117
ODI (50 over) 222 200 217 256 407 156 250 286 296 500 263
Test cricket 91 143 83 69 122 106 95 107 207 193 118
All matches combined 143 180 167 130 215 184 133 151 160 145 155
Abbreviations: T20, Twenty20; ODI, One Day International.
Open Access Journal of Sports Medicine downloaded from https://www.dovepress.com/ by 118.70.13.36 on 26-Aug-2020
Dovepress
Orchard et al
Table 2 Annual injury incidence (new injuries per 100 players per year)
Body region 2006– 2007
2007– 2008
2008– 2009
2009– 2010
2010– 2011
2011– 2012
2012– 2013
2013– 2014
2014– 2015
2015– 2016
Average
Hamstring strains 3.1 8.2 12.4 7.3 7.9 10.1 11.0 9.4 9.8 7.7 8.7
Side and abdominal strains 5.1 7.1 5.4 6.7 4.7 7.6 7.7 7.2 4.9 4.4 6.1
Wrist and hand fractures 1.5 4.9 4.9 6.1 8.4 3.0 5.0 4.4 6.6 2.8 4.7
Groin injuries 4.1 3.8 4.9 2.2 6.3 5.6 5.5 4.4 4.4 3.9 4.5
Other lumbar injuries 3.1 5.5 1.1 3.3 6.8 5.6 3.3 5.5 4.4 1.7 4.0
Other shin, foot, and ankle injuries 2.0 2.2 4.3 2.2 4.2 5.1 3.3 2.2 2.2 4.4 3.2
Lumbar stress fractures 3.6 1.1 2.7 2.2 3.7 4.0 2.2 2.2 4.9 5.0 3.2
Medical illness 4.1 4.4 3.8 1.1 2.6 4.0 1.7 3.3 2.7 1.7 3.0
Calf strains 3.1 1.6 0.5 2.8 1.6 2.5 2.8 3.3 4.9 6.1 2.9
Quadriceps strains 2.6 1.1 2.7 2.8 1.0 3.5 4.4 4.4 3.3 2.8 2.9
Other wrist/hand injuries 1.5 1.6 2.7 2.2 3.7 3.5 5.0 2.8 1.6 2.2 2.7
Ankle and foot sprains 3.1 3.8 4.3 2.2 3.7 3.5 2.8 1.1 1.6 0.6 2.7
Knee cartilage injuries 3.1 1.6 1.6 4.5 3.1 0.0 1.7 2.8 1.6 0.0 2.0
Shin and foot stress fractures 2.0 1.6 2.7 1.1 1.6 1.5 2.8 1.7 0.5 3.9 1.9
Other knee injuries 1.5 1.1 1.6 1.7 1.6 2.5 2.8 1.7 1.1 1.1 1.7
Shoulder instability 1.0 2.7 1.1 2.2 1.0 0.5 2.2 0.6 0.5 2.8 1.5
Buttock and other thigh injuries 2.0 1.6 1.1 1.7 1.0 2.0 2.2 1.1 0.0 1.1 1.4
Shoulder tendon injuries 2.0 1.1 1.1 1.7 2.1 2.0 0.6 1.1 0.5 0.6 1.3
Other elbow/arm injuries 1.0 1.6 1.1 2.2 1.6 1.0 0.6 0.6 0.5 0.6 1.1
Other shoulder injuries 0.5 1.6 0.0 0.0 0.0 1.5 0.0 2.2 1.6 1.7 0.9
Concussion 0.0 0.5 0.0 0.0 0.5 0.5 0.6 0.0 2.2 4.4 0.9
Chest/abdomen impact injuries 1.0 0.5 0.0 1.1 1.0 1.0 0.6 0.6 1.6 1.1 0.9
Fractured facial bones 0.5 0.5 1.6 0.6 0.5 1.5 0.6 0.6 0.0 0.0 0.6
Other trunk injuries 0.5 0.0 0.5 0.6 0.0 1.5 0.0 0.0 0.5 0.6 0.4
Hip joint injuries 0.5 0.5 0.0 0.0 0.5 0.5 0.6 1.1 0.5 0.0 0.4
Neck injuries 1.5 0.0 0.0 0.0 0.5 0.0 0.0 0.0 0.0 0.6 0.3
Other head and facial injuries 0.5 0.0 0.5 0.0 0.0 0.0 0.0 1.1 0.0 0.0 0.2
Arm/forearm fractures 0.0 0.0 0.0 0.0 0.0 0.0 0.0 0.0 0.5 0.0 0.1
Heat-related illness 0.0 0.0 0.0 0.0 0.0 0.0 0.0 0.0 0.0 0.0 0.0
All injuries 54.6 60.7 62.8 58.6 69.7 74.2 69.5 65.4 63.4 61.2 64.0
Table 3 Injury prevalence by player position 2006–2007 to 2015–2016
2006– 2007
2007– 2008
2008– 2009
2009– 2010
2010– 2011
2011– 2012
2012– 2013
2013– 2014
2014– 2015
2015– 2016
Average
Batsman 5.4% 7.0% 6.7% 7.3% 9.1% 9.2% 5.6% 7.8% 9.8% 5.6% 7.4%
Wicketkeeper 0.5% 1.7% 3.0% 9.0% 8.0% 13.6% 1.2% 3.2% 2.9% 2.8% 4.7%
Pace bowler 18.8% 18.8% 19.7% 21.0% 24.2% 25.0% 19.8% 16.9% 18.7% 21.7% 20.6%
Spinner 4.0% 9.9% 3.8% 3.5% 10.8% 10.4% 10.8% 4.7% 4.7% 6.3% 6.7%
All positions 10.3% 11.4% 11.1% 12.8% 15.9% 16.0% 11.6% 10.8% 12.2% 12.2% 12.5%
Pace bowler injury prevalence was clearly higher than for the other four positions (Table 3), throughout the decade. However, it was less variable from lower years to higher years compared to the other positions.
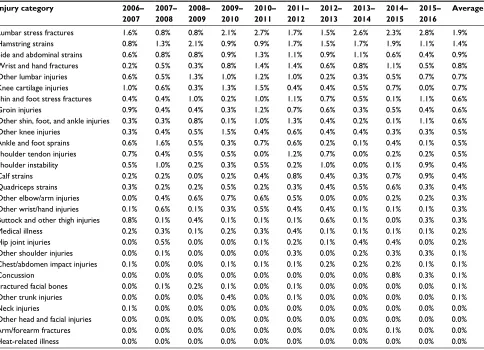
Table 4 shows the injury prevalence across different formats. Across the decade, injury prevalence between all formats did not vary substantially. In recent seasons in particu-lar, international 50-over (ODI) injury prevalence was higher than domestic 50-over injury prevalence. Table 5 shows the injury prevalence by category, with similar patterns to injury incidence by category, ranked in the order of descending contribution to missed playing time. However, it should be
noted that the stress fracture categories, particularly lumbar stress fractures, disproportionately affect injury prevalence compared to incidence. Lumbar stress fractures, with higher prevalence, therefore caused more missed playing time than hamstring strains, even though incidence was lower, the explanation being that greater time was missed for each injury.
Discussion
Over the past decade, injury incidence and prevalence rates have been relatively constant in elite Australian male cricket. Other than for a 2-year period (2010–2011 and 2011–2012), annual injury prevalence has fallen within the range of
Open Access Journal of Sports Medicine downloaded from https://www.dovepress.com/ by 118.70.13.36 on 26-Aug-2020
Dovepress Incidence and prevalence of elite male cricket injuries
Table 4 Comparison of injury prevalence by match type
2006– 2007
2007– 2008
2008– 2009
2009– 2010
2010– 2011
2011– 2012
2012– 2013
2013– 2014
2014– 2015
2015– 2016
Average
T20 cricket 10.2% 11.9% 14.1% 10.6% 15.1% 11.8% 9.7% 10.7% 11.2% 11.2% 11.6%
Domestic 50 over 11.5% 13.5% 9.7% 12.1% 15.7% 16.1% 11.6% 9.9% 11.2% 9.6% 12.3%
Domestic First-Class 10.0% 10.8% 9.2% 12.2% 15.3% 16.4% 10.9% 11.1% 12.9% 13.5% 12.2%
ODI (50 over) 10.8% 12.7% 18.2% 13.8% 21.9% 18.5% 14.6% 12.5% 12.0% 12.5% 14.9%
Test cricket 8.4% 9.6% 14.3% 17.1% 16.0% 17.3% 15.6% 10.0% 10.7% 9.8% 13.6%
Average 10.3% 11.4% 11.1% 12.8% 15.9% 16.0% 11.6% 10.8% 12.2% 12.2% 12.5%
Abbreviations: T20, Twenty20; ODI, One Day International.
Table 5 Comparison of injury prevalence by body area
Injury category 2006– 2007
2007– 2008
2008– 2009
2009– 2010
2010– 2011
2011– 2012
2012– 2013
2013– 2014
2014– 2015
2015– 2016
Average
Lumbar stress fractures 1.6% 0.8% 0.8% 2.1% 2.7% 1.7% 1.5% 2.6% 2.3% 2.8% 1.9%
Hamstring strains 0.8% 1.3% 2.1% 0.9% 0.9% 1.7% 1.5% 1.7% 1.9% 1.1% 1.4%
Side and abdominal strains 0.6% 0.8% 0.8% 0.9% 1.3% 1.1% 0.9% 1.1% 0.6% 0.4% 0.9%
Wrist and hand fractures 0.2% 0.5% 0.3% 0.8% 1.4% 1.4% 0.6% 0.8% 1.1% 0.5% 0.8%
Other lumbar injuries 0.6% 0.5% 1.3% 1.0% 1.2% 1.0% 0.2% 0.3% 0.5% 0.7% 0.7%
Knee cartilage injuries 1.0% 0.6% 0.3% 1.3% 1.5% 0.4% 0.4% 0.5% 0.7% 0.0% 0.7%
Shin and foot stress fractures 0.4% 0.4% 1.0% 0.2% 1.0% 1.1% 0.7% 0.5% 0.1% 1.1% 0.6%
Groin injuries 0.9% 0.4% 0.4% 0.3% 1.2% 0.7% 0.6% 0.3% 0.5% 0.4% 0.6%
Other shin, foot, and ankle injuries 0.3% 0.3% 0.8% 0.1% 1.0% 1.3% 0.4% 0.2% 0.1% 1.1% 0.6%
Other knee injuries 0.3% 0.4% 0.5% 1.5% 0.4% 0.6% 0.4% 0.4% 0.3% 0.3% 0.5%
Ankle and foot sprains 0.6% 1.6% 0.5% 0.3% 0.7% 0.6% 0.2% 0.1% 0.4% 0.1% 0.5%
Shoulder tendon injuries 0.7% 0.4% 0.5% 0.5% 0.0% 1.2% 0.7% 0.0% 0.2% 0.2% 0.5%
Shoulder instability 0.5% 1.0% 0.2% 0.3% 0.5% 0.2% 1.0% 0.0% 0.1% 0.9% 0.4%
Calf strains 0.2% 0.2% 0.0% 0.2% 0.4% 0.8% 0.4% 0.3% 0.7% 0.9% 0.4%
Quadriceps strains 0.3% 0.2% 0.2% 0.5% 0.2% 0.3% 0.4% 0.5% 0.6% 0.3% 0.4%
Other elbow/arm injuries 0.0% 0.4% 0.6% 0.7% 0.6% 0.5% 0.0% 0.0% 0.2% 0.2% 0.3%
Other wrist/hand injuries 0.1% 0.6% 0.1% 0.3% 0.5% 0.4% 0.4% 0.1% 0.1% 0.1% 0.3%
Buttock and other thigh injuries 0.8% 0.1% 0.4% 0.1% 0.1% 0.1% 0.6% 0.1% 0.0% 0.3% 0.3%
Medical illness 0.2% 0.3% 0.1% 0.2% 0.3% 0.4% 0.1% 0.1% 0.1% 0.1% 0.2%
Hip joint injuries 0.0% 0.5% 0.0% 0.0% 0.1% 0.2% 0.1% 0.4% 0.4% 0.0% 0.2%
Other shoulder injuries 0.0% 0.1% 0.0% 0.0% 0.0% 0.3% 0.0% 0.2% 0.3% 0.3% 0.1%
Chest/abdomen impact injuries 0.1% 0.0% 0.0% 0.1% 0.1% 0.1% 0.2% 0.2% 0.2% 0.1% 0.1%
Concussion 0.0% 0.0% 0.0% 0.0% 0.0% 0.0% 0.0% 0.0% 0.8% 0.3% 0.1%
Fractured facial bones 0.0% 0.1% 0.2% 0.1% 0.0% 0.1% 0.0% 0.0% 0.0% 0.0% 0.1%
Other trunk injuries 0.0% 0.0% 0.0% 0.4% 0.0% 0.1% 0.0% 0.0% 0.0% 0.0% 0.1%
Neck injuries 0.1% 0.0% 0.0% 0.0% 0.0% 0.0% 0.0% 0.0% 0.0% 0.0% 0.0%
Other head and facial injuries 0.0% 0.0% 0.0% 0.0% 0.0% 0.0% 0.0% 0.0% 0.0% 0.0% 0.0%
Arm/forearm fractures 0.0% 0.0% 0.0% 0.0% 0.0% 0.0% 0.0% 0.0% 0.1% 0.0% 0.0%
Heat-related illness 0.0% 0.0% 0.0% 0.0% 0.0% 0.0% 0.0% 0.0% 0.0% 0.0% 0.0%
10%–13% for the other years of the decade under study. Being an isolated 2-year period of apparently higher injury rates, we have not undertaken statistical significance tests to determine whether this period is an outlier by chance or for other reasons. Previous study, however, has shown that in the decade prior to the implementation of T20 cricket in the calendar, injury rates were slightly lower than for the current period.29 The
number of T20 games gradually increased over the period 2006–2007 to 2011–2012, with the number of 50-over and First-Class games staying constant.16,29 It is possible that
from 2012–2013 onward, the understanding that change in workload is a significant risk factor for injury19,21,24,29–31 may
have allowed teams to prepare more successfully for phase changes in the calendar. One scheduling improvement, in particular, has been made for the past three seasons, namely, that the domestic 50 over matches have all been played as a stand-alone competition at the start of the season, reducing the need for players to regularly transition between 50-over and First-Class cricket many times during the season.
Absolute load has been implicated for many years as a risk factor for injury in cricket fast bowling.32–35 However,
a sudden increase creating a spike in load is equally if not more important.19,23,36 Workload studies in cricket fast
bowlers have therefore implicated low loads as also being
Open Access Journal of Sports Medicine downloaded from https://www.dovepress.com/ by 118.70.13.36 on 26-Aug-2020
Dovepress
Orchard et al
a risk factor for injury as they imply inability to cope with impending higher loads.19,21,33 Similar findings of workload
spikes being a risk factor for injury have been documented in other sports such as football (soccer),37,38 rugby league,18,20
Australian football,22 and rugby union.39 The relationship of
workload to injury may also depend on the type of injury: tendons most appreciate constant moderate loads; bone stress fracture correlates with medium-term workload on a background of low career workload; and joint injury cor-relates with high career workload.21
One category of injuries that has increased in rates over the past two seasons has been concussion. This is a trend that has been seen in the football codes as well: concussions may have been more common in the recent past than we appreciated, but because they did not cause missed games their incidence was underreported.
The most common injury was the hamstring strain (sea-sonal incidence 8.7 injuries/100 players per season). The hamstring strain has emerged from being one of many com-mon injuries in elite cricket a decade ago29 to being clearly
the most common injury in the sport at the elite level. This is presumably in association with the rise of T20 cricket and, as it commonly occurs, during all of fast bowling, batting (running between the wickets), and fielding. A subtle feature of the data presented is that hamstring strain rates tend to be higher in years where there are more short-form games and fewer Test matches, and vice versa.
The most prevalent injury was lumbar stress fractures, causing 1.9% of players to be unavailable at all times owing to these injuries, which represents 15% of all missed play-ing time. This is still the most prevalent injury in the sport of cricket at the elite level, although these injuries are more associated with high workloads arising from the longer forms of the game. Studies have previously associated workload, player age, and various biomechanical factors with the development of lumbar spine injuries, particularly stress fractures.6,7,9,16,26,40 There is still no published data to
show that coaching intervention to improve technique can prospectively lower the lumbar stress fracture risk for an elite player, although it is assumed that this may be possible.6,9,41
It is unclear whether the failure of biomechanical research to lead to lower lumbar stress fracture rates in young adult elite bowlers is a result of 1) there being not enough time or effort dedicated to this; 2) inability to convert the research on safer bowling techniques to action change in the real world; 3) a perception that generation of pace is in conflict with “safer” actions; or 4) technical changes made that cannot be sustained at match intensity; 5) these injuries being diagnosed more
commonly now because of improved imaging, canceling out any improvements in prevention.
Domestic and international matches have very similar match injury incidence rates across the formats, but injury prevalence is higher in international players as they play for most of the year without a substantial off-season. In general terms, injury incidence and injury prevalence are related by both injury severity and match density. That is, for the same injury incidence, injuries that take on average 8 weeks to recover will contribute more to injury prevalence than injuries that take 4 weeks. However, as the number of fixtures in an 8-week period gradually increases, so will the contribution to missed playing time from a single injury.
Injury prevalence rates recorded in studies arising from Australia have generally been higher than rates reported by other countries.42–44 There are multiple potential reasons for
this, all of which may contribute but require further study to prove or disprove the hypotheses. Australia is a country with a relatively high bias toward fast bowling (compared to spin bowling), the player position that is most prone to injury. Australia plays a high amount of cricket at the international level, particularly Test cricket, more so than all other countries (although at the domestic level the amount of cricket played in England is greater than that played in Australia). Australian grounds are generally the biggest in the world of cricket, so that batsmen and fieldsmen perhaps run more during play than in countries where the grounds are smaller. The Australian medical attitude toward diagnosis and management of lumbar stress fracture in fast bowlers is probably more conservative than it is in other countries. That is, Australian medical teams have a low threshold for performing high-quality magnetic resonance imaging scan (ie, 3T scan with volumetric interpolated breath-hold examination sequences) in lumbar pain, and a high threshold for return to fast bowling (demonstration of bony healing preferred before return). This may lead to a higher amount of missed time due to lumbar stress fractures among contracted players but, hopefully, a lower retirement rate of fast bowlers due to chronic lumbar degenerative changes. Although the latter is not formally measured, we believe the early retirement rate from fast bowling is now very low, particularly compared to previous eras where the culture was traditionally to “push through” pain associated with lumbar stress fractures. Finally, in view of the existence of an ongoing injury surveillance system, we believe that our measures of injury prevalence are more accurate. For an injury report that focuses on a single tournament or single season, players with chronic injuries can be excluded from the cohort at the start because they are not expected to play over
Open Access Journal of Sports Medicine downloaded from https://www.dovepress.com/ by 118.70.13.36 on 26-Aug-2020
Dovepress Incidence and prevalence of elite male cricket injuries
the course of the study. All contracted players (injured and uninjured) are included in our study over the entire decade. Nevertheless, the variations in injury rates between countries require further specific study rather than speculation to determine the reasons for the patterns exhibited. The recent injury definition updates will, hopefully, lead to more accurate and consistent reporting from all cricket playing nations.
Workload monitoring and analysis has allowed a greater understanding of the risk factors for injury and could potentially lead to greater injury prevention in the future. It is possible that the lower injury rates of the most recent four seasons may be related to better preparation of players, given a greater understanding of workload upgrades as a risk factor for injury.19,21 However, two structural factors
act as impediments to major reductions in injury rates, even though in theory it is quite possible to keep injury rates low by keeping workload constant. The first hurdle is the schedule of cricket, involving First-Class multiday matches being scheduled in close proximity to T20 matches. If there is an expectation that fast bowlers want to play in both these forms of matches, and their contracts generally expect them to do so at the present time, then rapid changes in match bowling workloads are almost unavoidable. The second hurdle is the inability to substitute players in cricket in First-Class matches, putting the onus on fast bowlers to potentially be exposed to very high workload upgrades if a teammate is unable to bowl through injury or simply that the opposition cannot be dismissed.45 If there was better ability to control bowling
workload within a match, then substantial injury prevention could be achieved. Although there are good arguments to change the rules and/or schedule from an injury prevention viewpoint, the status of cricket as a professional sport emphasizes entertainment as the primary consideration, and this entails respecting most of the traditions of a sport. The purpose of playing cricket at the professional level is not to avoid injury but to be involved in a contest that spectators feel engagement with.
Disclosure
All three authors are employed by Cricket Australia to provide medical services to players. Other than this relationship, no author has any financial conflict with the material presented in this study. The authors report no other conflicts of interest in this work.
References
1. Hoy G. Survey of Victorian cricket injuries 1979–80 to 1983–84. In: Payne W, editor. Melbourne, Australia: Sports Coach; 1987. 2. Stretch R. Injuries to South African cricketers playing at first-class level.
S Afr J Sports Med. 1989;4(1):3–20.
3. Smith C. Cricket injuries while on tour with the South African team in India. SAMJ. 1992;7:20–24.
4. Stretch RA. The incidence and nature of injuries in first-league and provincial cricketers. S Afr Med J. 1993;83(5):339–342.
5. Crisp T. Cricket: fast bowler’s back and thrower’s shoulder. Practitioner. 1989;233(1469):790–792.
6. Foster D, John D, Elliott B, Ackland T, Fitch K. Back injuries to fast bowlers in cricket: a prospective study. Br J Sports Med. 1989;23(3):150–154.
7. Annear PT, Chakera TM, Foster DH, Hardcastle PH. Pars interarticularis stress and disc degeneration in cricket’s potent strike force: the fast bowler. Aust N Z J Surg. 1992;62(10):768–773.
8. Bell PA. Spondylolysis in fast bowlers: principles of prevention and a survey of awareness among cricket coaches. Br J Sports Med. 1992;26(4):273–275.
9. Elliott B, Hardcastle P, Burnett A, Foster D. The influence of fast bowl-ing and physical factors on radiological features in high performance young fast bowlers. Sports Med Train Rehabil. 1992;3:113–130. 10. Hardcastle P, Annear P, Foster DH, et al. Spinal abnormalities in young
fast bowlers. J Bone Joint Surg Br. 1992;74(3):421–425.
11. Reilly T, Chana D. Spinal shrinkage in fast bowling. Ergonomics. 1994;37(1):127–132.
12. Orchard J, Newman D, Stretch R, Frost W, Mansingh A, Leipus A. Methods for injury surveillance in international cricket. Br J Sports
Med. 2005;39(4):E22.
13. Orchard J, Newman D, Stretch R, et al. Methods for injury surveillance in international cricket. N Z J Sports Med. 2004;32(4):90–99. 14. Orchard J, Newman D, Stretch R, et al. Methods for injury surveillance
in international cricket. J Sci Med Sport. 2005;8(1):1–14.
15. Orchard J, Newman D, Stretch R, et al. Methods for injury surveillance in international cricket. S Afr J Sports Med. 2005;17(2):18–28. 16. Orchard J, James T, Kountouris A, Portus M. Changes to injury profile (and
recommended cricket injury definitions) based on the increased frequency of Twenty20 cricket matches. Open Access J Sports Med. 2010;1:63–76. 17. Orchard J, Ranson C, Olivier B, et al. Consensus statement on
injury surveillance in cricket: 2016 update. Br J Sports Med. 2016;50(20):1245–1251.
18. Gabbett T, Domrow N. Relationships between training load, injury, and fitness in sub-elite collision sport athletes. J Sports Sci. 2007;25(13):1507–1519.
19. Hulin B, Gabbett T, Blanch P, Chapman P, Bailey D, Orchard JW. Spikes in acute workload are associated with increased injury risk in elite cricket fast bowlers. Br J Sports Med. 2014;48:708–712.
20. Hulin B, Gabbett T, Lawson D, Caputi P, Sampson JA. The acute:chronic workload ratio predicts injury: high chronic workload may decrease injury risk in elite rugby league players. Br J Sports Med. 2016;50(4):231–236.
21. Orchard J, Blanch P, Paoloni J, et al. Cricket fast bowling workload patterns as risk factors for tendon, muscle, bone and joint injuries. Br
J Sports Med. 2015;49(16):1064–1068.
22. Rogalski B, Dawson B, Heasman J, Gabbett TJ. Training and game loads and injury risk in elite Australian footballers. J Sci Med Sport. 2013;16(6):499–503.
23. Soligard T, Schwellnus M, Alonso JM, et al. How much is too much? (Part 1) International Olympic Committee consensus statement on load in sport and risk of injury. Br J Sports Med. 2016;50(17):1030–1041. 24. Blanch P, Gabbett TJ. Has the athlete trained enough to return to play
safely? The acute:chronic workload ratio permits clinicians to quantify a player’s risk of subsequent injury. Br J Sports Med. 2016;50(8): 471–475.
25. Drew M, Finch C. The relationship between training load and injury, illness and soreness: a systematic and literature review. Sports Med. 2016;46(6):861–883.
26. Orchard J, James T, Portus M, Kountouris A, Dennis R. Fast bowlers in cricket demonstrate up to 3- to 4-week delay between high workloads and increased risk of injury. Am J Sports Med. 2009;37:1186–1192. 27. Orchard J, James T, Portus M. Injuries to elite male cricketers in Australia
over a 10-year period. J Sci Med Sport. 2006;9(6):459–467.
Open Access Journal of Sports Medicine downloaded from https://www.dovepress.com/ by 118.70.13.36 on 26-Aug-2020
Dovepress
Open Access Journal of Sports Medicine
Publish your work in this journal
Submit your manuscript here: http://www.dovepress.com/open-access-journal-of-sports-medicine-journal
The Open Access Journal of Sports Medicine is an international, peer-reviewed, open access journal publishing original research, reports, reviews and commentaries on all areas of sports medicine. The journal is included on PubMed. The manuscript manage-ment system is completely online and includes a very quick and fair
peer-review system. Visit http://www.dovepress.com/testimonials.php to read real quotes from published authors.
Dove
press
Orchard et al
28. Orchard J, James T, Alcott E, Carter S, Farhart P. Injuries in Australian cricket at first class level 1995/1996 to 2000/2001. Br J Sports Med. 2002;36:270–275.
29. Orchard J, Kountouris A, Sims K, Orchard J, Beakley D, Brukner P. Changes to injury profile of elite male cricketers in the T20 era. N Z J
Sports Med. 2015;42(1):13–17.
30. Blanch P, Orchard J, Kountouris A, Sims K, Beakley D. Different tissue type categories of overuse injuries to cricket fast bowlers have differ-ent severity and incidence which varies with age. S Afr J Sports Med. 2015;27(4):108–113.
31. Orchard J, Blanch P, Paoloni J, et al. Fast bowling match workloads over 5–26 days and risk of injury in the following month. J Sci Med Sport. 2015;18:26–30.
32. Orchard JW, James T, Portus M, Kountouris A, Dennis R. Fast bowl-ers in cricket demonstrate up to 3-to 4-week delay between high workloads and increased risk of injury. Am J Sports Med. 2009;37(6): 1186–1192.
33. Dennis R, Farhart P, Goumas C, et al. The relationship between fast bowling workload and injury in first-class cricketers (vol 6, pg 359, 2003). J Sci Med Sport. 2003;6(4):522–522.
34. Dennis R, Farhart R, Goumas C, Orchard J. Bowling workload and the risk of injury in elite cricket fast bowlers. J Sci Med Sport. 2003; 6(3):359–367.
35. Dennis R, Finch C, Farhart P. Is bowling workload a risk factor for injury to Australian junior cricket fast bowlers? Br J Sports Med. 2005; 39:843–846.
36. Olivier B, Taljaard T, Burger E, et al. Which extrinsic and intrinsic factors are associated with non-contact injuries in adult cricket fast bowlers?
Sports Med. 2016;46(1):79–101.
37. Ehrmann F, Duncan C, Sindhusake D, Franzsen WN, Greene DA. GPS and injury prevention in professional soccer. J Strength Cond Res. 2016;30(2):360–367.
38. Owen A, Forsyth J, Wong del P, Dellal A, Connelly SP, Chamari K. Heart rate-based training intensity and its impact on injury incidence among elite-level professional soccer players. J Strength Cond Res. 2015;29(6):1705–1712.
39. Cross M, Williams S, Trewartha G, et al. The influence of in-season training loads on injury risk in professional rugby union. Int J Sports
Physiol Perform. 2016;11(3):350–355.
40. Cricket under stress [editorial]. Lancet. 1992;340(8814):279–280. 41. Elliott B, Khangure M. Disk degeneration and fast bowling in cricket:
an intervention study. Med Sci Sports Exerc. 2002;34(11):1714–1718. 42. Frost W, Chalmers D. Injury in elite New Zealand cricketers 2002-2008:
descriptive epidemiology. Br J Sports Med. 2014;48:1002–1007. 43. Mansingh A, Harper L, Headley S, King-Mowatt J, Mansingh G. Injuries
in West Indies Cricket 2003–2004. Br J Sports Med. 2006;40:119–123. 44. Newman D. A prospective study of injuries at first class counties in
England and Wales 2001 and 2002 seasons. In: Stretch RA, editor.
Second World Congress of Science and Medicine in Cricket. 2003:83–84.
45. Orchard J, Dhillon M, Farhart P, Blanch P, Kountouris A. Injury data and arguments to support a rule change to allow substitutes in Test and first class cricket. Sports Physio. 2012;4:20–23.
Open Access Journal of Sports Medicine downloaded from https://www.dovepress.com/ by 118.70.13.36 on 26-Aug-2020