IJSRR, 8(2) April. – June., 2019 Page 2046
Research article Available online www.ijsrr.org
ISSN: 2279–0543
International Journal of Scientific Research and Reviews
A Study on Job Satisfaction of Employees in Education Industry
Ashima Saxena
BBA Department, Jagannath International Management School,Kalkaji, New Delhi, India Email ashima.saxena@jagannath.org, Mob no-9811755664
ABSTRACT
Job satisfaction in regards to one’s feeling or state of mind regarding nature of their work. Job can be influenced by variety of factors like quality of one’s relationship with their supervisor, quality of physical environment in which they work, degree of fulfillment in their work, etc. Positive attitude towards job are equivalent to job satisfaction whereas negative attitude towards job has been defined variously from time to time. In short job satisfaction is a person’s attitude towards job. In this research paper, the level of job satisfaction in education industry has been studied. Primary data is collected with 50 respondents who are involved in teaching. It was seen that
KEYWORDS:
Job Satisfaction, Education industry, Job Security, Team Spirit.*Corresponding author:
Ashima Saxena
BBA Department,
Jagannath International Management School, Kalkaji, New Delhi, India
IJSRR, 8(2) April. – June., 2019 Page 2047
INTRODUCTION
Different authors give various definitions of job satisfaction. Some of them are taken from the book of D.M. Pestonjee “Motivation and Job Satisfaction” which are given below: Job
satisfaction is defined as a pleasurable, emotional, state resulting from appraisal of one’s job. Job satisfaction is defined, as it is result of various attitudes the person hold towards the job, towards
the related factors and towards the life in general. According to Pestonejee, Job satisfaction can be taken as a summation of employee’s feelings in four important areas.
1. Job-nature of work (dull, dangerous, interesting), hours of work, fellow workers, opportunities on the job for promotion and advancement (prospects), overtime regulations, interest in work, physical environment, and machines and tools.
2. Management- supervisory treatment, participation, rewards and punishments, praises and blames, leaves policy and favoritism.
3. Social relations- friends and associates, neighbours, attitudes towards people in community, participation in social activity sociability and caste barrier.
4. Personal adjustment-health and emotionality.
Job satisfaction is an important indicator of how employees feel about their job and a predictor of work behavior such as organizational citizenship, Absenteeism, Turnover. Job satisfaction benefits the organization includes reduction in complaints and grievances, absenteeism, turnover, and termination; as well as improved punctuality and worker morale. Job satisfaction is also linked with a healthier work force and has been found to be a good indicator of longevity. Job satisfaction is not synonyms with organizational morale, which the possessions of feeling have being accepted by and belonging to a group of employees through adherence to common goals and confidence in desirability of these goals.
LITERATURE REVIEW
As per Hoffman Miller,“Job satisfaction focuses on three components of organizational behavior: that is cognitive, affective, and behavioral and is widely used to determine overall satisfaction in human capital management”. According to SHRM, there are number of factors that influence job satisfaction and the factors keep on changing from time to time. (SHRM, 2012)
IJSRR, 8(2) April. – June., 2019 Page 2048
Motivation or employee rewards come in various forms such as improving working conditions, providing opportunities for growth, and recognizing employee accomplishments or remuneration, however, using intrinsic motivators like providing a sense of belonging for the employee and recognition of a job well done goes a long way in making them excited about their jobs. Similarly, job enrichment17, empowerment and sharing power help some employees feel motivated at work (Honore, 2009, DiPietro et al 2014).
OBJECTIVES
To determine the level of commitment faculties have in Education industry.
To estimate whether the employees have Job Security in Education industry.
To understand whether employees get adequate opportunities to grow in future.
To understand weather employees are paid adequate according to their job assigned.
RESEARCH METHODOLOGY
Data collection: Primary data-The primary data will comprise of information survey directly from the respondent with the help of structured questionnaires.
Secondary data-The secondary data will be collected from internet, journals, newspaper & References from Library.
Sample size: A sample of 50 people is to be taken on the basis of convenience. Target Audience: Faculty involved directly with teaching the students.
ANALYSIS & FINDINGS
1. Responses regarding whether the respondents are satisfied with the present job in the organization
Table 1: Satisfaction level with present job
Satisfaction level No. of respondents Percentage
Strongly satisfied 16 32
Satisfied 24 48
Slightly satisfied 6 12
Dissatisfied 2 4
IJSRR, 8(2) April. – June., 2019 Page 2049
Figure 1: Satisfaction level with present job
The data shows that 48% employees are strongly satisfied with their present job. The data also shows that 4% are strongly dissatisfied.
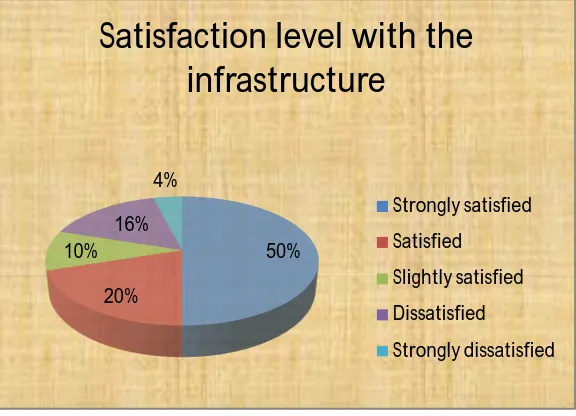
2. Responses regarding whether the respondents are satisfied with the infrastructure of organization
Figure 2: Satisfaction level with the infrastructure
The data shows the level of satisfaction with the infrastructure of the organization. 50% of the respondents are strongly satisfied with the infrastructure, whereas 4% are strongly dissatisfied
3. Responses regarding whether the respondents are satisfied with the canteen facility provided by organization.
Table 3: Level of satisfaction with the canteen facility
Satisfaction level No. of respondents Percentage
Strongly satisfied 28 56
Satisfied 9 18
Slightly satisfied 7 14
Dissatisfied 4 8
Strongly dissatisfied 2 4
32%
48%
12% 4% 4%
Satisaction level in the current
job
Strongly satisfied
Satisfied
Slightly satisfied
Dissatisfied
Strongly dissatisfied
50%
20% 10%
16% 4%
Satisfaction level with the
infrastructure
Strongly satisfied
Satisfied
Slightly satisfied
Dissatisfied
IJSRR, 8(2) April. – June., 2019 Page 2050
Figure 3: Level of satisfaction with the canteen facility
Above table shows that 56% employees are strongly satisfied with the canteen facility provided by the organization. Only 4% employees are strongly dissatisfied with canteen facility.
4. Responses regarding whether the respondents are satisfied with the implementation of rules and regulations.
Table 4: Level of satisfaction with the implementation of rules and regulations.
Satisfaction level No. of respondents Percentage
Strongly satisfied 22 44
Satisfied 18 36
Slightly satisfied 4 8
Dissatisfied 6 12
Strongly dissatisfied 0 0
Figure 4: Level of satisfaction with the implementation of rules and regulations.
Above table shows that 56% employees are strongly satisfied with the canteen facility provided by the organization. Only 4% employees are strongly dissatisfied with canteen facility.
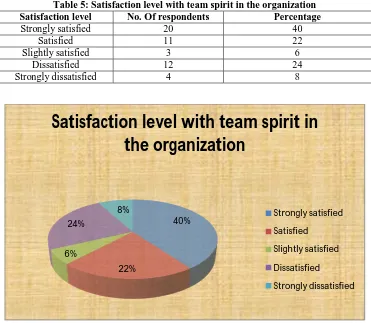
5. Responses regarding whether the respondents are satisfied with team spirit in the Organization
56%
18% 14%
8% 4%
Level of satisfaction with the
canteen facility
Strongly satisfied
Satisfied
Slightly satisfied
44%
36% 8%
12% 0%
Level of satisfaction with the
implementation of rules and
regulations.
Strongly satisfied
Satisfied
Slightly satisfied
Dissatisfied
IJSRR, 8(2) April. – June., 2019 Page 2051
Table 5: Satisfaction level with team spirit in the organization Satisfaction level No. Of respondents Percentage
Strongly satisfied 20 40
Satisfied 11 22
Slightly satisfied 3 6
Dissatisfied 12 24
Strongly dissatisfied 4 8
Figure 5: Satisfaction level with team spirit in the organization
Above table shows that 40% employees strongly feels that the team spirit in the organization are most convenient for them. Other 22% employees are satisfied with the team spirit while 24% employees are not much satisfied with the team spirit
6. Responses regarding whether the respondents are satisfied with Job security
Table 6: Job security
Satisfaction level No. of respondents Percentage
Strongly satisfied 4 8
Satisfied 9 18
Slightly satisfied 8 16
Dissatisfied 6 12
Strongly dissatisfied 23 46
40%
22% 6%
24%
8%
Satisfaction level with team spirit in
the organization
Strongly satisfied
Satisfied
Slightly satisfied
Dissatisfied
IJSRR, 8(2) April. – June., 2019 Page 2052
Figure 6: Job security
Above table shows that only 8% employees are strongly satisfied with the job security. And 46% of employees are strongly dissatisfied with the job security provided by the organization.
7. Responses regarding whether the respondents are satisfied with the opportunities of promotions
Table 7: Opportunities of promotions
Satisfaction level No. of respondents Percentage
Strongly satisfied 4 8
Satisfied 7 14
Slightly satisfied 3 6
Dissatisfied 13 26
Strongly dissatisfied 23 46
Figure 7: Opportunities of promotions
Only 8% of the employees are satisfied with the opportunities of promotions given by organization. And most of the employees nearly 46% are not satisfied with opportunities of promotions.
8%
18%
16%
12% 46%
Job security
Strongly satisfied
Satisfied
Slightly satisfied
Dissatisfied
Strongly dissatisfied
8%
14%
6%
26% 46%
Opportunities of promotions
Strongly satisfied
Satisfied
Slightly satisfied
Dissatisfied
IJSRR, 8(2) April. – June., 2019 Page 2053
FINDINGS & INFERENCES
1. From the above data it is clear that 48% employees are strongly satisfied with their present job and 4% are strongly dissatisfied
2. From the above data collected it is clear that 50% of the respondents are strongly satisfied with the infrastructure, whereas 4% are strongly dissatisfied.
3. Above table shows that 56% employees are strongly satisfied with the canteen facility provided by the organization. Only 4% employees are strongly dissatisfied with canteen facility.
4. Above table shows that 56% employees are strongly satisfied with the canteen facility provided by the organization. On the other hand, only 4% employees are strongly dissatisfied with canteen facility.
5. Above table shows that 40% employees strongly feels that the team spirit in the organization are most convenient for them. Other 22% employees are satisfied with the team spirit while 24% employees are not much satisfied with the team spirit.
6. Above table shows that 40% employees strongly feels that the team spirit in the organization are most convenient for them. Other 22% employees are satisfied with the team spirit while 24% employees are not much satisfied with the team spirit
7. Only 8% of the employees are satisfied with the opportunities of promotions given by organization. And most of the employees nearly 46% are not satisfied with opportunities of promotions.
CONCLUSION
Morale in an organization is an attitude of emotional readiness, which enables an employee to improve his productivity. When an organization motivates its employees to a high degree, resultant morale in the organization will be equally high. Motivation is the process and morale is the product. Therefore, continuous monitoring and improvement of morale is necessary for an organization. In a dynamic environment like the Education industry, it is a challenge to keep pace with new and emerging trends on a continuous basis. The only way to stay afloat and ahead of competition is by creating an environment of continuous learning for the individual and elevating organizational skills.
After the analysis of statistical data and findings arrived, it can be concluded that employees of both
the schools nurture differential level of satisfaction across organizational variables such as Growth,
Payroll System, and other facilities allocated to them in forms of Canteens, transportation etc.
IJSRR, 8(2) April. – June., 2019 Page 2054
convenient working hours, safe working environment, may enhance job satisfaction and morale of employees in both the schools. Regardless of the school status, teacher’s qualification or teaching experience, a safe working environment, supportive administration, and involved parents are connected with high levels of teacher satisfaction. Equally important are the teachers’ feelings of sovereignty. The results of this study imply that involving teachers in school policy, decisions and giving them some degree of control in their classrooms are associated with high levels of career satisfaction. It is not possible to say, however, whether these factors result in high levels of teacher satisfaction, or whether highly satisfied teachers seek out or create environments that provide them with greater satisfaction. In the end of the conclusion of this research the researcher, want to open this fact that most teachers of both the schools do not share their responses in a sincerely manners. So these insincerely responses of the teachers may affect the results of this research.
BIBLIOGRAPHY
1. Cho YJ, Perry JL. Intrinsic motivation and employee attitudes: Role of managerial trustworthiness, goal directedness, and extrinsic reward expectancy. Review of Public
Personnel Administration. Dec, 2012;32(4):382-406.
2. Hwang J, Lee JJ, Park S, Chang H, Kim SS. The impact of occupational stress on employee's turnover intention in the luxury hotel segment. International Journal of Hospitality &
Tourism Administration. Jan 2, 2014;15(1):60-77.
3. Kianto A, Vanhala M, Heilmann P. The impact of knowledge management on job satisfaction. Journal of Knowledge Management. Jul 11, 2016;20(4):621-36.
4. Pestonjee DM. Stress and coping: The Indian experience. Sage Publications Ltd; 1992.
5. Victor J. Employee job satisfaction and engagement: How employees are dealing with uncertainty. V poročilu raziskave od The Society for Human Resource Management.
Alexandria: SHRM. 2012.