Synthetic Aperture Radar Ship Detection Using Modified Gamma
Fisher Metric
Meng Yang*
Abstract—This article proposes a novel ship detection method for high-resolution SAR images. Our goal is to look at this question from a information geometry point of view. The method consists of two steps: construction of revised metric and Riemann structure, and extraction of targets. For the first step of the process, a revised metric is introduced on Gamma 2-manifold. We construct a special Riemannian structure by using the proposed metric. For the second step, the regions of interest (ROIs) are extracted out based on the Riemann structure. Experimental results of the detection method on SAR images show that the algorithm presented is effective.
1. INTRODUCTION
Automatic synthetic aperture radar (SAR) image processing has received increasing attention recently due to the development of the sensor techniques [1, 2]. Ship detection from high-resolution SAR imagery shows the great usefulness of reducing the analysts’ workload in wide-area surveillance for major public events by directing their attention to the regions of interest (ROIs). In particular, modern SAR sensors can generate large amounts of SAR image data in a short period of time, which promote the need for automatic detection of targets of interest [3].
In the field of ship detection, many SAR-based algorithms have been proposed recently [4, 5]. Among them, there are two fundamentally different means of ship detection in SAR images: adaptive threshold algorithms for ship detection and feature representation for ship detection. For the adaptive threshold algorithms, the window sizes should be related to the size and shape of the targets and the relationship between threshold and the false alarm rate will need to be determined by the detection problem in hand. Parameters are typically designed to search for bright pixel values compared to those in the background. Constant false alarm rate (CFAR) algorithm is one of the simple and effective adaptive threshold algorithms [6]. The difficulty of CFAR detector is to choose the design parameters to achieve a desired false-alarm rate [7]. These parameters, especially when the taken detectors are not CFAR for the SAR image, are often set empirically. Only the detection problem at hand can give hints about distribution and parameter choices. It will also need to consider calculation complexity. Due to the simplicity and effectiveness, it is expected to improve the CFAR detection performance by incorporating modern analytic methods.
Feature analysis is an important topic in the area of pattern recognition theory. Feature representation techniques can be used to identify the relevant features from the original set of SAR data [8]. Unlike in optical images, there are many possible variations of the shape and structure of the targets in SAR images. Targets in SAR images do not have clear texture and edges. The feature selection for target detection will be determined by the detection problem, which should be evaluated in relation to the practical application scenarios. Additionally, the resolution of most satellite SAR images is often not high enough to extract detailed ship information.
Received 8 April 2017, Accepted 18 May 2017, Scheduled 7 June 2017
* Corresponding author: Meng Yang ([email protected]).
Information geometry is a method of investigating the geometrical structure by means of modern geometry [9]. It has inevitably been influenced by Riemann geometry theory, since the Riemann metric is a quadratic differential form [10]. Information geometry becomes an effective tool in many fields of research, such as statistical inference, machine learning, signal processing and optimization [11]. The aim of this study is to apply information geometry to study detection problems and the induced information structures. It allows information geometry theory to be applied to problems in target detection of SAR images.
The main contributions in the proposed method are as follows: 1) a Gamma metric is presented on Gamma 2-manifold; 2) we construct a special geometrical structure using the proposed metric; 3) a novel devised framework for detection of ships with high accuracy is exploited based on information geometry.
2. PROPOSED METHOD
In this section, the concepts and framework under which detector is designed are described in a way which is practically useful and intuitively understandable. The motivation for using Riemann structure is that the targets are persistent over time while the clutter is more random. The geometrical features will therefore be different when targets are present. In the adaptive detection applications of SAR images, a crucial problem is modeling the background statistically. Experience has shown that the Gamma distribution is an appropriate model (although still not perfect) for describing the statistical behaviors of real SAR imagery. The Gamma distribution starts at the origin and has a flexible shape. The differential geometric structure might be investigated by the family of Gamma density functions which is given by
{p(x;γ, κ)|γ >0, κ >0} (1)
In the following, we will propose the Gamma manifold (denoted byM) based on the family of Gamma density functions. A parameter distribution choice for clutter statistics is equivalent to specifying the probability density function (PDF). The two-parameter Gamma probability density function [12] is expressed by
p(x;γ, κ) =
x γ
κ−1
1 γΓ (κ)exp
−x γ
, x >0 (2)
whereκ is the shape parameter,γ the scale parameter, and Γ the gamma function. Setν= 1/γ. Then the PDF has the form
p(x;ν, κ) =νκx κ−1
Γ (κ)exp (−νx) (3)
The logarithm of Gamma density function can be written as
logp(x;ν, κ) = (κ−1) logx−νx−(log Γ (κ)−κlogν) (4)
The corresponding potential function is given by
φ(ν, κ) = log Γ (κ)−κlogν (5)
Information geometry constitutes a statistical model as a manifold. For a given parametric model, the Fisher information matrix can be regarded as a natural Riemannian metric. In [9], the Fisher metric is given by the Hessian of corresponding potential function. [9] gives the Fisher metric with respect to natural coordinates:
[gij] (ν, κ) =∂ij2φ(ν, κ) (6)
For Eq. (6), the metric matrix elements are calculated by the differential method:
∂2φ ∂ν2 =
κ
ν2 (7)
∂2φ
∂ν∂κ = −
1
ν (8)
∂2φ ∂κ2 =
d2
It is a Riemannian metric which naturally follows from the underlying properties of PDFs. We believe that it must have important practical significance, but it should be evaluated in relation to the practical application scenarios.
Our starting point was the study of a family of Gamma distribution for intrinsic metrics in real manifolds. Our goal is to look at this question from a differential geometric point of view, with the hope of possibly application in SAR image process field. For this purpose, we present a modified Gamma Fisher metric with respect to natural coordinates:
g11(ν, κ) = g22(ν, κ) =
1
κν2 (10)
g12(ν, κ) = g21(ν, κ) =−
1
νκ (11)
For our study, Riemannian structure is proposed as a means of determining which tangent vectors contain information about targets. It is an important signal/data analytic tool to show the structure of the signal/data effectively. We are investigating the structure of Riemannian 2-manifolds. The Riemannian structure of the modified Gamma Fisher metric is defined as a form:
F(ν, κ) =ν2g11+ 2νκg12+κ2g22 (12)
By the above definition, F is a pseudo Riemannian length. And we hope that the possibly new perspectives on Riemannian information geometry introduced in this article will eventually lead to new results in this field; and in particular in geometric detection and recognition theory of SAR targets, where this work started.
The main steps of the proposed detection algorithm are described as follow:
Step 1) Given an SAR image I, with I(i, j) ∈ [0,1], we extract all local patches pij centered at pixel (i, j), in the image. The local patchpij is represented as a vector of size h×h, whereh×h is the spatial size of the patch.
Step 2) By using the maximum likelihood estimation method, the unknown parametersκandγ for the Gamma distribution datapij =pij+μof sizeh×h are solved, whereμis a large positive constant. Therefore, based on the Gamma manifold we obtain
dij =Fij(ν, κ)ν2+κ2 (13)
according to Eq. (12).
Step 3) The standard method of maximum classes square error (Otsu method) is implemented to locate regions of interest (ROIs) in matrix
D= [|dij|]0≤i≤M,0≤j≤N (14)
where| • |denotes the absolute value of the elements.
3. RESULTS AND DISCUSSION 3.1. Experimental Results
In order to analyze the effectiveness of the proposed method, an ERS (European Remote Sensing Satellite) SAR image is used. The input ERS SAR image I with a size of 131×320 is shown in Fig. 1. Experiments are carried out using a PC with Windows-based 64-bit core i3 machine and 4-GB random access memory. The program codes have been written in the MATLAB 2013a and R 3.3.2 simulation platforms. The detection results are obtained with ah= 9 sliding window for the estimation of parametersκ andγ. The parameterμ= 102 is used. If we increase the valueμ, the detection results will stand.
Figure 1. ERS SAR image.
Figure 2. Saliency matrix by using the proposed method.
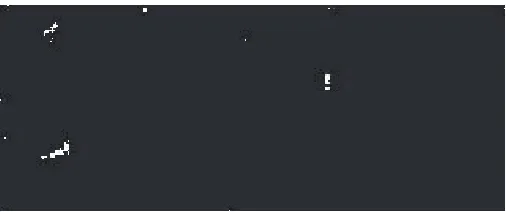
Figure 3. Detection result (binary image) by using the proposed method.
Figure 4. Detection result (binary image) by using the Gamma-based CFAR detector.
the high contrast image. Fig. 3 shows the qualitative result for the SAR imageI. The average processing time on the 131×320 pixels image is 54.2 s.
Gamma clutter. It is greatly affected by speckle and has many false alarms. During the experiments, the target-window size 15×15 pixels and the false alarm rate (FAR)Pfa = 10−4 are used for detection.
3.2. Efficiency Discussion
Generally, based on the principle of SAR imaging, SAR images are inherently affected by a multiplicative noise known as speckle (as shown in Fig. 5). The analysis of the statistic characteristics of SAR image is essential for the SAR image analysis and processing. In this article, we formulate a multiplicative clutter model with the parameterization of Gamma distributed texture.
The proposed saliency descriptor is formed by the same statistical feature extraction and metric functions. Riemannian structure is adopted and saliency map is formed based on contrast of neighboring sampling nodes. It utilizes the Riemannian structure to measure the similarity between targets and background represented by their statistical properties.
Figure 5. A mesh plot of I for the image shown in Fig. 1.
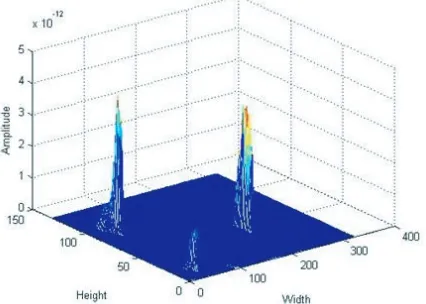
Figure 6. A mesh plot of and its 3-D layout for the detected result by using the proposed framework of the Riemannian structure, where selected parameterμ= 102.
Because of the ships superstructure, the saliency matrix D, regarded as an image, can achieve a higher contrast between ship targets and background. Fig. 6 shows the 3-D layout for the image shown in Fig. 2. Compared to Gamma-based CFAR algorithm, the proposed algorithm can reduce the influence of SAR sea clutter, by means of a combination of the spatial distribution and the non-Euclidean metric spaces of SAR images.
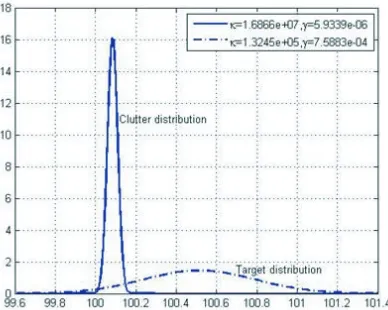
We treat the manifold M of 2-parameter Gamma distribution with parameters κ and γ. In this article, the maximum log-likelihood method is used to give the estimates of the parameters κ and γ of the Gamma distribution given the values in each image patch of pij. Fig. 7 discloses the difference between clutter distribution and target distribution over the experimental image patches. According to the result presented in Fig. 6, we may conclude that our method can be not only more robust in the detection of salience points, but also more effective as a clutter suppressor.
For the proposed method, we consider the efficient estimation of the tail distribution of the maximum of correlated Gamma random variables. Fig. 8 shows that the local patches pij centered at pixel (i, j) in SAR image have difficult to achieve a higher contrast between ship targets and background, because they lose statistical power with small sample sizes. We propose a simple remedy: to rely on alternative small samples,pij =pij +μ, according to the tails of the PDF. The remedy can reduce the influence of SAR ambiguities and sea clutter. From Fig. 8, it is easy to find that, if the value μis low, this will lead to a false alarm.
Figure 7. Gamma densities with differing values of the estimated parametersκ and γ for different two patches of the experimental image.
Figure 8. A mesh plot of and its 3-D layout for the detected result by using the proposed framework of the Riemannian structure, where selected parameterμ= 0.
Figure 9. 3-D layout for the detected result by using the Fisher metric proposed in [9], where selected parameterμ= 102.
Figure 10. 3-D layout for the detected result by using the Fisher metric proposed in [9], where selected parameterμ= 0.
further illustrate the effectiveness of the proposed method, we use this metric to establish the detection algorithm under the proposed framework of the Riemannian structure. For the experiment, the second derivatives of logarithmic Gamma functions are calculated using the maximum log-likelihood method. Fig. 9 and Fig. 10 show the 3-D layout for the detected results. As can be seen, the proposed Fisher metric provides better saliency maps for the SAR image.
4. CONCLUSION
method can achieve a good performance for inhomogeneous sea state, which has a great application value.
It should be pointed out that this article has focused on incorporation of Riemannian metric and vector field into salience-mapping algorithms for single-channel high-resolution SAR images. Some interesting research topics are on the improvement of detection models via the utilization of the additional information contained in polarimetric SAR data. These topics will be investigated in the future research.
ACKNOWLEDGMENT
This study was supported in part by the National Natural Science Foundation of China (No. 61501152).
REFERENCES
1. Isernia, T., A. Massa, A. F. Morabito, and P. Rocca, “On the optimal synthesis of phase-only reconfigurable antenna arrays,” European Conf. Antennas and Propagation, 2074–2077, 2011. 2. Qin, F., S. Gao, Q. Luo, C. Mao, C. Gu, G. Wei, J. Xu, J. Li, C. Wu, K. Zheng, and S. Zheng, “A
simple low-cost shared-aperture dual-band dual-polarized high-gain antenna for synthetic aperture radars,”IEEE Trans. Antennas Propagation, Vol. 64, No. 7, 2914–2922, 2016.
3. Marino, A. and I. Hajnsekand, “Statistical tests for a ship detector based on the polarimetric notch filter,” IEEE Trans. Geosci. Remote Sens., Vol. 53, No. 8, 4578–4595, 2015.
4. Touzi, R., J. Hurley, and P. Vachon, “Optimization of the degree of polarization for enhanced ship detection using polarimetric RADARSAT-2,” IEEE Trans. Geosci. Remote Sens., Vol. 53, No. 10, 5403–5424, 2015.
5. Zilman, G., A. Zapolski, and M. Marom, “On detectability of a ship’s Kelvin wake in simulated SAR images of rough sea surface,” IEEE Trans. Geosci. Remote Sens., Vol. 53, No. 2, 609–619, 2015.
6. Tao, D., S. Anfinsen, and C. Brekke, “Robust CFAR detector based on truncated statistics in multiple-target situations,” IEEE Trans. Geosci. Remote Sens., Vol. 54, No. 1, 117–134, 2016. 7. Schwegmann, C., W. Kleynhans, and B. Salmon, “Manifold adaptation for constant false alarm
rate ship detection in south African oceans,” IEEE J. Sel. Topics Appl. Earth Observ., Vol. 8, No. 7, 3329–3337, 2015.
8. Schwegmann, C., W. Kleynhans, and B. Salmon, “Synthetic aperture radar ship detection using Haar-like features,” IEEE Geosci. Remote Sens. Lett., Vol. 14, No. 2, 154–158, 2017.
9. Arwini, K. A. and C. T. J. Dodson, Information Geometry — Near Randomness and Near Independence, Springer-Verlag, Heidelberg, 2008.
10. Nielsen, F. and R. Bhatia, Matrix Information Geometry, Springer-Verlag, Heidelberg, 2013. 11. Amari, S., Information Geometry and Its Application, Springer, Tokyo, 2016.