EFFECT OF FIRM CHARACTERISTICS ON FINANCIAL DISTRESS
OF NON-FINANCIAL FIRMS LISTED AT NAIROBI SECURITIES
EXCHANGE, KENYA
GATHECHA JOHN WANGIGE
D58/CTY/PT/22360/12
A RESEARCH THESIS SUBMITTED TO THE SCHOOL OF BUSINESS
IN PARTIAL FULFILLMENT OF THE REQUIREMENT FOR THE
AWARD OF THE DEGREE OF MASTER OF SCIENCE IN FINANCE
IN THE SCHOOL OF BUSINESS OF KENYATTA UNIVERSITY
i
DECLARATION
This project is my original work and has not been presented for a degree in any other
university or for any other award.
JOHN WANGIGE GATHECHA
____________________________ ____________________________
Sign Date
This is to confirm that this thesis has been carried out by the candidate under our supervision
as the appointed Kenyatta University Supervisor.
____________________________ ____________________________
Sign Date
DR. EDDIE MUNGAMI SIMIYU
Department of Accounting and Finance,
Kenyatta University.
____________________________ ____________________________
Sign Date
MR. GERALD ATHERU
Department of Accounting and Finance,
ii
DEDICATION
I dedicate this research project to Almighty God whose grace has been sufficient so far in my
life. I also wish to dedicate this research project to my wife Ann and my children, Alvin,
Claudia and Telvin. This work would not have been possible without their moral support that
iii
ACKNOWLEDGEMENT
First and foremost, I express my appreciation to the Almighty God my savior, who have
enabled me achieve my dream in pursuing my degree in Masters in Science Finance Option.
Special appreciation goes to my supervisors Dr. Eddie Simiyu, Dr. Lucy Wamugo and Mr.
Gerald Atheru for their continuous support, motivation and endurance in my work. I
appreciate them for equipping me with immense knowledge which has led to value addition
to this body of knowledge. I would also like to thank my seniors at St. Paul’s University who
ensured that I had enough time to carry out my research work. Special thanks go to Dr. Paul
Gesiba, for his tireless effort accorded to me during the research work. My appreciation goes
to my fellow students, whom we teamed up to help one another, my workmates, I salute you
and may the living God bless you all abundantly. Finally, I wish to appreciate my immediate
family; Jane, Jacinta, Nancy, Catherine, Ann, Felister, George and my mum Rosemary who
iv
TABLE OF CONTENTS
DECLARATION... i
DEDICATION... ii
ACKNOWLEDGEMENT ... iii
LIST OF FIGURES ... viii
LIST OF TABLES ... ix
OPERATIONAL DEFINITION OF TERMS ... x
ABBREVIATION AND ACRONYMS ... xii
ABSTRACT ... xiii
CHAPTER ONE: INTRODUCTION ... 1
1.1 Background of the Study ... 1
1.1.1 Firm Characteristics ... 4
1.1.2 Bankruptcy Act in Kenya ... 5
1.1.3 The Nairobi Security Exchange ... 5
1.2 Statement of the Problem ... 6
1.3 General Objective ... 8
1.3.1 Specific Objectives ... 8
1.4 Research Hypothesis ... 8
1.5 Significance of the Study ... 9
1.5.1 Policy Perspective ... 9
1.5.2 Industrial Perspective ... 9
1.5.3 Theoretical Perspective ... 9
v
1.7 Limitation of the Study ... 10
1.8 Assumptions of the Study ... 10
1.9 Organization of the Study ... 10
CHAPTER TWO: LITERATURE REVIEW ... 11
2.1 Introduction ... 11
2.2 Theoretical Review ... 11
2.2.1 Pecking order Theory ... 11
2.2.2 Agency Theory... 12
2.2.3 Keynesians theory ... 12
2.2.4 Wreckers theory of Financial Distress ... 13
2.3 Empirical Review ... 13
2.4 Conceptual Framework ... 19
CHAPTER THREE : RESEARCH METHODOLOGY ... 21
3.1. Introduction ... 21
3.2 Research Philosophy ... 21
3.3 Research Design ... 21
3.4 Panel Logit Regression Model ... 22
3.5. Operationalization and measurement of variables ... 25
3.6 Target Population ... 26
3.7 Sampling... 27
3.8 Data collection Instrument ... 27
3.9 Data collection Procedure ... 27
vi
3.11 Diagnostic testing ... 28
3.11.1 Multicollinearity ... 28
3.11.2 Heteroscedasticity ... 28
3.11.3 Overall evaluation of the model using likelihood ratio test ... 29
3.12 Ethical Standards ... 29
CHAPTER FOUR : DATA ANALYSIS AND PRESENTATION ... 30
4.1 Introduction ... 30
4.2 Summary of Descriptive Statistics ... 30
4.3 Diagnostic Tests ... 31
4.3.1 Heteroscedasticity Test ... 31
4.3.2 Mann-Whitney Wilcoxon test ... 32
4.4 Correlation Among Variables ... 34
4.5 Panel Logit Regression Results ... 36
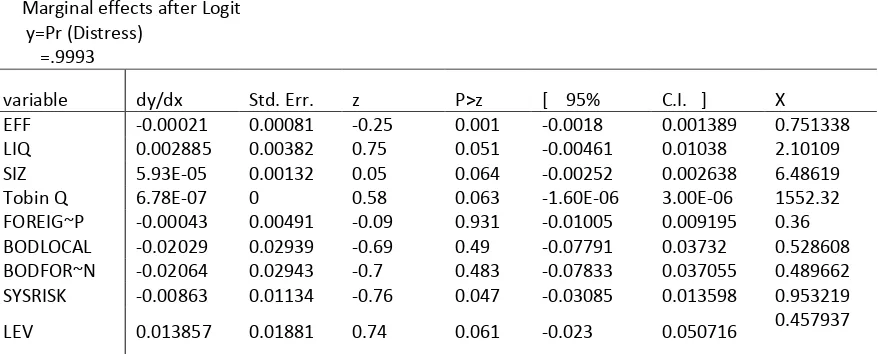
4.6 Marginal Effects (mfx) ... 38
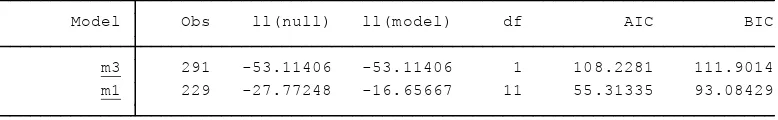
4.7 Likelihood Ratio Test ... 39
4.8 Multicollinearity Diagnostics ... 40
4.9 Discussions ... 41
CHAPTER FIVE : SUMMARY, CONCLUSION AND RECOMMENDATIONS ... 43
5.1 Introduction ... 43
5.2 Summary of the findings ... 43
5.3 Conclusion ... 45
5.4 Recommendations and Policy Implications ... 46
vii
REFERENCES ... 48
APPENDICES ... 54
Appendix I: Data Graphs... 54
Appendix II: Kernel Density Graphs ... 54
viii
LIST OF FIGURES
Figure 2.1: Conceptual framework ... 20
ix
LIST OF TABLES
Table 2.1: Summary of Literature review ... 17
Table 3.1: Operationalization and measurement of study variables ... 25
Table 4.1: Summary of Descriptive Statistics... 31
Table 4.2: Wilcoxon-Mann-Whitney test ... 33
Table 4.3: Pearson correlation ... 35
Table 4.4: Panel Logistic Regression ... 36
Table 4.5: Marginal Effects (mfx) ... 39
x
OPERATIONAL DEFINITION OF TERMS
Business Cycle This is a process under which a business entity under goes during its lifetime. It includes four stages namely; recession,
depression, recovery and finally boom.
Financial Distress Process This is a continuous process which befalls a firm when it fails to meet its obligation resulting to financial distress. It is a slow
process which takes a long period and results to bankruptcy if
no interventions are made.
Financial Impairment This is a situation in a firm when the book value of a non-current asset exceeds the recoverable amount. This means that
such an asset has diminished in value.
Firm Characteristics These are factors that affect the firm directly. These are internally generated within a firm. They include financial and
non- financial factors. Financial factors includes: efficiency,
liquidity, and leverage. Non-financial factors include;
Shareholding, labour, age of the firm and board of director
characteristics.
Restructuring This refers to the re-organization of the organization in terms of ownership, management or structure wise in order to make the
firm become more profitable. This is done to avoid bankruptcy,
repositioning or buyout.
Non Bankrupt This relates to the current position of a firm, when it has a positive profit after tax.
Insolvency /Solvency Solvency refers to a situation where the current assets of an entity exceed current liability. Insolvency entails lack of
liquidity within an entity. Insolvency is also referred to as
xi
Macroeconomic Variables These are factors that affect a firm due to economic changes. Economic changes include; Interest rates, systematic risks,
Gross domestic product, money supply among others.
Systematic Risk This is risk inherent to the entire market segment. It is normally referred as ‘diversifiable risk’ ‘’or ‘market risk’ volatility. The
risk affects the entire market and is unpredictable neither can it
be avoided can be mitigated by hedging. The study computed
CAPM on each firm selected.
Leverage This refers to the firm’s ability to buy assets using borrowed funds with believes that income generated from that asset was
more than the cost of borrowing.
Efficiency This is a ratio used by firms in order to evaluate their current performance.
xii
ABBREVIATION AND ACRONYMS AIES Artificial Intelligence and Expert Systems
CAMELS Capital Adequacy, Assets, Management Capability, Earnings, Liquidity, Sensitivity
CAPM Capital Asset Pricing Model
CARAMELS Capital Adequacy, Asset Quality, Reinsurance, Adequacy of Claim Provisions, Management, Earning Quality, Liquidity,
Subsidiaries/Self-dealing.
CBR Case Based Reasoning Model.
CHIN Scaled Change In Net Income.
EBIT/TA Earnings before Interest and Taxes to Total Asset
GDP Gross Domestic Product.
IRA Kenya Insurance Regulatory Authority.
MWW Mann-Whitney Wilcoxon Test
MDA Multiple Discriminant Analysis.
MVE/ TL Market Value of Equity to Total Liability.
NACOSTI National Commission for Science, Technology and Innovation
NI/TA Net Income to Total Asset.
SVM Support Vector Machine
xiii
ABSTRACT
1
CHAPTER ONE INTRODUCTION 1.1 Background of the Study
Every decision made by management, determines the direction the firm takes in future.
However, decisions are based on shareholding composition, financial prospects based on
current firm potential, corporate governance and the economic condition prevailing in the
market (Changing, 2011). Financial distress relates to a broad concept with several situations
in which a firm faces financial difficulty. These common situations defining financial distress
include bankruptcy, insolvency and failure (Maina and Sakwa, 2012). Schmidt (2010) defines
financial distress as a situation that affects the firm under unclear circumstances. Senbet and
Wang (2012) relate financial distress to a situation where the firm’s contract to creditors are
broken or honored with difficulty. Financial distress falls in tight cash situations when the
firm is not able to pay the owed amount within the due date. This is in line with the leverage
position of a firm. If no interventions are injected, this condition can force a firm into
bankruptcy or liquidation (Hu, 2011). This condition arises from wrong financial decisions
made by firm managers in the long run operations of a firm (Filberk and Krueger, 2005).
Financial distress has affected many investors and huge cash outflow has been lost as a result
of this problem, Baker (2011). Business failure is problematic to both developed and
developing economies. There is therefore the need to investigate the main determinants of
financial distress specifically for developing markets specifically Kenyan economy Kemboi
(2012).
According to Pandey (2005), creditors, suppliers and investors, react differently on firm’s
facing financial problems. Suppliers, automatically discontinue granting credit to the firm due
2
additional capital to the distressed firm or set high cost with rigid terms and conditions.
Shareholders on the other hand may be tempted to undertake risky projects. If this project
succeeds, they gain but if it fails, the creditors will suffers loss.
Over the last four decades, academics and practitioners have carried out vigorous research on
financial distress without drawing consensual conclusions; Among the studies done
includes, Akbar (2013), Dimitras, Zanakis & Zopudinis. (1996) Zmijewski’s (1984) and
Ohlson (1980). Business failure prediction models remain unsolved puzzle to date. In
addition, various models have been developed. Akbar (2013) carried a study using Falmer
and Toffler models in financial distress prediction suggesting superiority of Falmers’ model
in prediction. Dimitras et al., (1996) conducted a multi- dimensional research on business
crisis prediction. Altman model has several draw backs; it is an outdated model and would
not be best to use in classification of todays’ firm. In addition, researchers using the model
assume that their model is stable across economic conditions that change with time. The
business environment in 1968 may not be the same as today. The model only relied on
manufacturing firms which is not practicable today. The main demerit of Olson Logit model
is that by use a dependent variable that is not binomial, the researcher is required to test the
assumption of linearity before including it in the model. Zmijewski’s model is limited to
financial ratios therefore does not incorporate other factors. Panel Logit regression overcomes
these problems experienced in the above models and has binomial output. The researcher is
able to monitor firm’s state at different stages; healthy state, impairment state, and recovery
states and determine whether the firm is bankrupt or not. The study adopted panel Logit
regression model which have a dichotomous output of being failed or non-failed firm.
According to Outechever (2007), financial distress is a gradual dynamic process where a
3
stages have specific attributes and consequences as they contribute differently to business
failure. Financial distress varies with time. Therefore as a firm enters one state, it does not
stay in the same state until it recovers or is liquidated. The change in financial condition
triggers the transition from one state of financial distress to another. If these conditions are
not aggravated, this may lead the firm into bankruptcy problems. Aasen (2011) points out two
types of financial distress costs. Direct bankruptcy costs comprising of legal and
administrative costs, and indirect bankruptcy costs which relates to the difficulty of managing
a firm during bankruptcy.
Business failure symptoms include internal organization problems which are characterized
by financial signals resulting from weak performance leading to bankruptcy and finally to
financial distress. The firm takes a downward spiral trend due to inadequate resource
deployment, resulting to a weak strategic positioning which is evidenced by significant drop
in sales, poor profitability, and decline in cash flow and liquidity levels (Crutzen and Van
Caillie 2007).
According to Rose et al,. (1996) bankruptcy is the legal status in an entity which cannot repay
debts to its creditors; this may lead to liquidation or administration. Insolvency on the other
hand, is a financial condition within an entity when its liabilities exceed the assets, a situation
referred to as “balance sheet insolvency”. This calls for immediate action to rectify the
situation in order to avoid bankruptcy. Such actions include minimizing overhead costs,
negotiating current debts and debt repayments. Cash flow insolvency; entails lack of liquidity
to honor debts when they fall due while balance sheet insolvency refers to presence of
4
1.1.1 Firm Characteristics
Determinants of financial distress can be classified into three categories financial factors,
non-financial factors and macro-economic factors. Financial factors include leverage,
liquidity, firm size and investment among others. According to Brealey et,.al. (2000)
,liquidity is the ability of an asset to be converted into cash quickly and at low cost. Firm size
has a major influence in determination of whether a firm is distress or not. This is due to the
fact that large firms can access external finance cheaply due to their ability to influence the
rate of interest to their advantage. Large firms can also survive during crisis than small firms
due to accumulated reserves (Ooghe & Prijcker, 2008). Firms efficiency also referred as
turnover ratios, measures the productivity level of a firm after using its assets Brealey et al.
(2000). Leverage is the firm’s ability to buy assets using borrowed funds with believe that
income generated from that asset will be more than the cost of borrowing. In this case, the
risk of borrowing cost is presumed to be larger than income generated from the asset leading
to losses in the long run. During recession firms borrow more funds in order to pay off debts
as they mature. Such firms with high leverage are likely to end up with potential risk of
bankruptcy Khalid (2012). Firms’ efficiency ratio is used to evaluate current performance. It
relates to the operating expenses computed as percentage over revenue. An increase of this
ratio indicates increase in cost or reduction in revenue Taylor (2008).Investment on the other
hand incorporates market value of all companies on the stock market and is computed by
using the market value of a firm divided by the replacement value of the entity’s asset.
Non-financial factors relates to corporate governance factors of a firm; Board of directors’
composition is in line with local and foreign directors within the management of a firm.
These are the decision making organ in a firm. Firm’s ownership comprises of major and
minor shareholders. Major shareholders have a large influence in decision made within a firm
5
the financial markets. Risk depends on the type of portfolio investors have undertaken.
Systematic risk is computed using capital asset pricing model Acharya et al.,(2010).
1.1.2 Bankruptcy Act in Kenya
Bankruptcy Act CAP 53 Laws of Kenya demonstrates the relationship between the debtor
and the creditor. In addition, the act demonstrates the relationship between the firms and
external parties. This Act has its base on the England statutes (Committee of Experts, 2010).
The Act however, is faced by many challenges. First, the act is too old and no amendments
have been made in relation to incorporate the current market dynamics. Despite the fact that
the act exists in Kenyan laws, many firms have pending litigations which have not been
concluded to date. This has caused some entities to go into liquidation while others have
restructured themselves for survival. The main demerit of the law is that despite its existence,
many firms have failed to survive and have closed down despite its existence.
1.1.3 The Nairobi Security Exchange
The study focused ideally on financial distress prediction on listed firms on Nairobi security
market. NSE is regulated by the capital market authority (CMA). The study is of importance
since the problem has prevailed for several decades in the Nairobi security market since
1990s’. Nairobi security exchange was constituted in 1954 under the society’s Act as a
voluntary association for stock brokers and was restricted to European community only. After
the attainment of independence in 1963, the share dealing business was opened to the resident
of European community, NSE (2014).
However after independence the security market activities slumped as a result of uncertainty
on Kenya’s future independence trend. The NSE has been privatized since 1988 by the
6
Depository and Settlement Corporation (CDSC). NSE has been operating currently with 62
listed firms. Firms listed in NSE are expected to be financially stable in order to build
investors’ confidence and contribute to economic growth. During listing period, these firms
must meet the set criteria set by NSE. However, despite meeting the set listing requirements,
firms are exposed to market dynamics which affect them either positively or negatively.
These dynamics may be caused by the government policies, risk perceptions, management
decisions and investment decisions (NSE, 2014). Currently, many firms have been delisted
due to financial distress problem with others being placed on receivership and therefore the
need for the study.
1.2 Statement of the Problem
Firms are presumed to be operating on a going concern basis and hence have perpetual life.
In reality, this may not be the case as companies often fail under unforeseen circumstances
(Schmidt, 2010). Despite good rating and aggressive strategies, firms still encounter financial
distress problems. Business success depends heavily on the ability of financial managers and
the stakeholders in the execution of business operations. In Kenya, some firms have been
placed under statutory management, (Wamugo, Makau and Kosimbei, 2014). Financial
distress is a global problem affecting both developed and developing economies. In Kenya
specifically, several firms have been delisted from stock market; Mumia sugar, Eveready
Lonho East Africa, Pearl dry cleaners, East African Packaging and Uchumi supermarkets are
good examples. Mumia Sugar Company currently has been undergoing serious financial
distress. The company has been in the news lately with reported incidences of directors being
hauled to courts Kakah (2015) and Mburu (2014). The share price of the company has
dropped significantly from a high of Sh. 60 per share to the current average of Sh. 2 per
7
been revamped by the government by injecting additional capital to prevent its closure.
Uchumi supermarket having over 30years of operation was declared bankrupt in 2006 and
was put under specialized receiver manager (SRM) and interim management. Through
government intervention in 2010, the company had a turnaround and was relisted in NSE
(NSE 2010). Currently the firm has closed down some of its branches and has challenges in
paying its creditors. The question then arises on what factors really cause financial distress in
Kenya? The study sought to examine these individual factors and determine the extent to
which they affect financial distress of non-financial firms listed in NSE using Logit model.
Much of empirical evidence has relied on financial models in financial distress prediction
incorporating different factors. These models have proved that firm characteristics cannot be
ignored during decision making process. Among these models includes Falmer and Toffler
models, Akbar (2013) and Altman’s model (2008) among others. Memba and Abuga (2013)
carried a study on the causes of financial distress and its effects on firms. The study
concluded that financial distress is caused by poor capital decisions, poor internal
management shortage of skilled labor and lack of access of credit. Mandi (2014) carried out
an assessment using Z score model on Kenyan sovereign risk, concluding that financial
factors contribute heavily on firm’s future direction. Talian (2012) concluded that financial
variables were more reliable when predicting financial distress in Kenya.
The influence underlying non-financial and macro-economic factors have been ignored to the
detriment of many firms. This implies that studies done on causes of financial distress
incorporating firm characteristics have not given proper attention by the concerned
shareholders. None of the above studies examined the effect of shareholding composition,
share ownership, leverage and systematic risks on listed non-financial firms in Kenya. The
8
firm from being financially distressed. This is the research gap that the study sought to fill.
The focal point of the study is to test the effect of firm characteristics on financial distress on
Kenyan firms.
1.3 General Objective
The main objective of the study is to establish the effects of firm characteristics on financial
distress on listed non-financial firms in NSE, Kenya.
1.3.1 Specific Objectives
(i) To establish the effect of financial factors on financial distress of listed non-financial
firms in NSE, Kenya.
(ii)To determine the impact of financial variables on financial distress on listed
non-financial firms in NSE, Kenya.
(iii)To establish the moderating effect of systematic risk on the relationship between firm
characteristics and financial distress of listed firms in NSE, Kenya.
1.4 Research Hypothesis
The study seeks to test the following null hypothesis:
H01: Financial factors have no influence on financial distress on listed firms in NSE,
Kenya.
H02: Non-financial factors have no influence on financial distress of listed firms in NSE,
Kenya.
H03: Systematic risk has no moderating effect on the relationship between firm
9
1.5 Significance of the Study
The significance of the study was based on the following perspectives: The policy
perspective (Government through Capital market authority), industrial perspective
(Investors), and theoretical perspective (scholars).
1.5.1 Policy Perspective
The study adds knowledge to policy decision makers the government, through Capital
market authority. The government should develop policies and regulation framework that will
ensure that non-financial firms do not encounter challenges of financial distress. The
government should set market trends indicators and thus evaluate early symptoms of
bankruptcy. Through this framework, the government will put interventions where possible;
example, during inflation it may implement monetary policies.
1.5.2 Industrial Perspective
The study boosts market trends analysis by investors, who have different motives towards the
market. Financial institutions that lend money will need to evaluate financial health of such
firms in order to determine their debt repayment potential and probability of default.
Creditors (Suppliers) will be able to analyze firms’ ability to meet its obligations and if not,
develop strategies to settle obligations in case of bankruptcy. Auditors are mainly concerned
with the going concern of the firm as watchdogs, acting on behalf of shareholders who have
pegged their interests on returns of their investments in form of dividends.
1.5.3 Theoretical Perspective
The study provides a base to scholars and researchers as for secondary literature in emerging
markets specifically in Kenya. In this case, the study boosts the existing body of knowledge
10
1.6 Scope of the Study
The scope of the study on non-financial firms listed in Nairobi securities exchange, Kenya
covered the period between 2004-2012. This helped in monitoring market risk trend, during
various business cycle stages. Insurance and commercial banks have separate regulatory
bodies which regulate them. During this period, many firms faced financial distress problems
with some being closed down.
1.7 Limitation of the Study
The study focused on firm characteristics of listed non-financial firms in NSE only hence the
results do not represent all firms listed in NSE in Kenya.
1.8 Assumptions of the Study
The diagnostic tests used in the study were carried out to ensure that the data suits the basic
assumptions of Logit regression model.
1.9 Organization of the Study
The study is structured as follows: Chapter one provides research background, research
objectives, and significance of the study, scope and the limitation of the study. Chapter two
comprises the literature review on theories and conceptual framework. Chapter three entails
the methodology of the study and various bankruptcy models. Consecutively, the findings
and interpretation are presented in chapter four with conclusions and suggestions of the study
11
CHAPTER TWO LITERATURE REVIEW 2.1 Introduction
The following literature provides research background on theoretical and empirical review of
financial distress. The chapter lays emphasis on financial distress stages, research gap on
previous research and their findings. The literature survey includes both local and
international research. Local research is included to provide an indication of financial distress
within NSE, listed firms in Kenya.
2.2 Theoretical Review
There are three theories which support the research objectives. These theories discuss the
effects of financial, non-financial and systematic risk variables on financial distress.
2.2.1 Pecking order Theory
The Peking order theory by Donaldson, (1961) is a capital structure theory. The theory was
modified by Myers and Majluf. According to Myers and Majluf (1984) businesses adhere to
a hierarchy of financing sources. Hence prefer internal sources when available, debt is
preferred over equity. Finance managers who are assumed to have a better perspective of the
firm’s true condition than investors may make adverse decision which would affect the firm
performance. Example, Managerial decisions on new equity may lead to overvaluation of the
firm hence drop in share price. Too much leverage in a firm is dangerous to a firm. Debt
finance has a tax shield advantage. However in the long-term, increase in cost of debt may
lead the firm to be financially overstretched leading financial distress crisis, (Frank and
Goyal, 2005). The management must therefore evaluate financial variables fully before
12
2.2.2 Agency Theory
Agency theory was proposed by Jensen and Meckling (1998). The theory relates to decisions
made by firm by managers (C.EOs) and shareholders. This is a principal agent relationship.
The theory states that, with low monitoring level to the organization and low discipline in
decision making, managers might decide to invest in projects with negative net present
values. In situations where shareholding is regulated by few individuals being the major
shareholders, decision making power, vests on them unlike the CEOs. In such situations,
managers have no say on the firms’ growth direction. Alternatively, where the B.O.D has
corporate governance problems, the firm is faced with financial decision problems.
According to Ngugi (2008), shareholders can manipulate liquid asset at the expense of
debt-holders using it as a proxy for asset substitution. According to Jensen (1986) availability of
free cash flow makes managers invest in projects with negative NPVs due to conflict of
interest. Decisions on non-financial variables may affect the firm heavily in the long run and
if no interventions are made, this may lead to financial distress.
2.2.3 Keynesians theory
Keynesian theory is an economic theory proposed by Maynard Keynes (1936). According to
Keynes (1936), liquidity preference is the main reason why firms hold cash during tough
economic times. The multiplier effect causes a small decrease in consumption or investment
which in return causes a decline throughout the economy. This theory brought about
structural inadequacies such as unemployment which causes imbalance in demand leading to
contraction in the economy. Most businesses under go business cycle process. The cycle is
influenced by macroeconomic factors majorly systematic risks. Most firms experiencing
systematic risk embark on hedging in order to mitigate this problem. In circumstances where
13
production concurrently. In circumstances where the economy is not regulated, the cost of
borrowing increases and unemployment level rises. If regulations by the government are not
enforced, firms become overstretched financially and may not able to meet their obligations
leading to financial distress. Such interventions by the government include fiscal and
monetary policies Duda and Schmidt (2010).
2.2.4 Wreckers theory of Financial Distress
According to Daniel, Hirshleifer, and Subrahmanyam, (1998); Fama, (1998) the authors
independently explored the concept that stocks of financially distressed firms consistently
underperform those of financially sound firms. This is normally motivated by the desire
among investors to opt out before the firm ultimately fails and they lose their investment. The
act of withdrawing funds from already financially distressed firms who quite to the contrary
badly need those funds is referred to as “wrecking”. The action can also be explained as the
process of pre-emptive destruction of a company before its value ultimately plummets to a
value beyond salvage. Investors withdraw resources from the firm as private, non-dividend
benefits. Financially distressed firms shareholders will only suffer opportunity cost if the firm
recovers, however if it defaults on its obligations, the withdrawal of funds is deemed to be a
free source of funds which can be reinvested somewhere else for an acceptable return. This
act is compared to the traditional concept of ripping apart an old ship which is beyond or too
expensive to repair and utilizing its individual parts to put another newer one hence not
economically worth (Kalckreuth, 2005).
2.3 Empirical Review
The section reviews various empirical studies in view of the study variables.
Hamid & Nasil (2014) carried a study on Pakistanian manufacturing sector from July 2003 to
14
exchange. The study used Zmijewski model to test the distress level on these companies. The
findings revealed that the probit model performed well on predicting financially distressed
firms and non-distressed firms, based on; Net income, Shareholders equity and cash flows.
The study however relied heavily on ratios ignoring other factors that lead to financial
distress.
Warutere (2013) conducted a study on the applicability of logistic regression in financial
distress prediction in Nairobi security exchange. The study was conducted on sixteen
companies between the ranges 1997-2011. The findings revealed that Logit regression was
successful in prediction of business failure one year before it occurred. The study relied on
secondary data obtained from CMA and NSE. The study used financial ratios in financial
distress prediction. Moreover, the study did not factor in other factors that cause financial
distress within the regression model so as to make it more reliable such as corporate
governance.
Samira (2012) investigated on listed companies in Nairobi security exchange from 1996 to
2012. The study tested the utility of statistical technique majorly multiple discriminant
analysis (MDA) in bankruptcy prediction on these listed firms. The firm used ratios to
determine bankruptcy levels. The study used descriptive research designs and relied on
secondary data. The finding from the study revealed the accuracy of the Z score multi
discriminant financial analysis model in bankruptcy prediction of non-manufacturing firms.
This study was only limited to financial ratios excluding other non-financial variables which
also contribute to financial distress.
Taliani (2012) study used financial ratios to predict financial distress. The independent
15
study revealed the ability of financial ratios in determining the firm going concern. The study
used secondary data obtained from the banks’ financial statements. The study used a
discriminant model and incorporated all the above ratios. The study revealed that, none of
activity and turn over ratios was critical in predicting financial distress in commercial banks
in Kenya. However, the study differed with those of Altman (1968) who concluded that
profitability and efficiency ratios were most crucial and that liquidity ratios were not
significant. The study however relied on financial ratios only ignoring other factors.
Jiming and Weiwei (2011) carried out a study focusing on 50 manufacturing firms listed in
China stock market during 2005-2007. The study incorporated financial and non–financial
variables and used Logit regression model. The independent variables used were; profitability
operating capacity, cash-flow indicators, ownership concentration and board characteristics.
The findings revealed that, the model with non-financial indicators proved to be more reliable
in financial distress prediction and the timeliness and long-run validity of the mix model was
much better in comparison with the model with only financial indicators. However, the study
ignored the macro-economic variables which contribute significantly, specifically during
business cycle period.
Wu, Gaunt and Gray (2011), carried out a study on developing a bankruptcy model. They
selected various factors from Z –score, O –score, Probit, Hazard, and Hillegeist Keating,
cram and Lundstedt (2004) models and used ratios in financial distress prediction. They also
included one fresh factor as proxy for diversification level in a company. The findings
revealed a negative relationship on new factor with financial distress. This model proved to
be more reliable than the previous ones, when it was subjected to a sample as well as outside
16
Odipo and Sitati (2010) conducted a study using Altman’s model in bankruptcy prediction at
the Nairobi securities exchange. The study used twenty firms listed between 1989 and 2008.
The study used Altman’s model which incorporated, total assets, retained earnings, earnings
before interest and taxes, book value of equity, and sales as independent variables. The
findings of the study revealed that Altman’s model was found to be applicable with 80%
successful prediction. The study relied on secondary data from NSE and CMA. However,
this study was only limited to financial ratios in bankruptcy prediction.
In a study on assessing corporate financial distress in South Africa, Bothwell (2010)
investigated to develop a model for bankruptcy prediction. The study used 28 companies and
grouped 64 ratios, classifying firms into failed and non-failed firms. The independent
variables used were Times Interest Earned, Cash to Debt and Working Capital to Turnover.
The findings revealed that the model correctly classified about 75% of failed and non-failed
firms. The study used simple random sampling design and used multiple discriminant model
methodology. This study however relied only on ratios ignoring other factors which
contribute to financial distress.
In a study conducted to test bankruptcy and financial distress prediction in the mobile Telkom
industry in Ghana, Kpodoh (2010) used Z score bankruptcy prediction model. The study used
qualitative and quantitative data (modified single case design) which was collected using
questionnaires issued using survey method. Secondary data was obtained from financial
statements. The findings revealed the strength of Z score in bankruptcy prediction. It also
confirmed the correlation between corporate governance and corporate failure. The study
however concentrated on ratios and corporate governance excluding macroeconomic factors
17
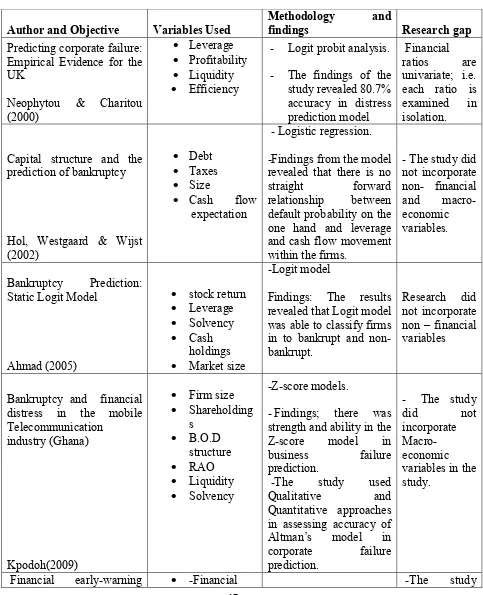
The tabulation below reveals various researches carried out, methodology used and the
research gap in research studies.
Table 2.1: Summary of Literature review
Author and Objective Variables Used
Methodology and
findings Research gap
Predicting corporate failure: Empirical Evidence for the UK
Neophytou & Charitou (2000)
• Leverage • Profitability • Liquidity • Efficiency
- Logit probit analysis.
- The findings of the study revealed 80.7% accuracy in distress prediction model
Financial ratios are univariate; i.e. each ratio is examined in isolation.
Capital structure and the prediction of bankruptcy
Hol, Westgaard & Wijst (2002)
• Debt • Taxes • Size
• Cash flow expectation
- Logistic regression.
-Findings from the model revealed that there is no straight forward relationship between default probability on the one hand and leverage and cash flow movement within the firms.
- The study did not incorporate non- financial and macro- economic variables.
Bankruptcy Prediction: Static Logit Model
Ahmad (2005)
• stock return • Leverage • Solvency • Cash
holdings • Market size
-Logit model
Findings: The results revealed that Logit model was able to classify firms in to bankrupt and non- bankrupt.
Research did not incorporate non – financial variables
Bankruptcy and financial distress in the mobile Telecommunication
industry (Ghana)
Kpodoh(2009)
• Firm size • Shareholding s • B.O.D structure • RAO • Liquidity • Solvency -Z-score models.
- Findings; there was strength and ability in the Z-score model in business failure prediction.
-The study used Qualitative and Quantitative approaches in assessing accuracy of Altman’s model in corporate failure prediction.
- The study did not incorporate Macro-economic variables in the study.
18
models on cross-holding groups.
Lieu, Lin & Yu (2008)
structure, • -Solvency, • -Profitability, • -Cash flow
indicators • Corporate
governance.
-Logit regressions model.
-The finding of the study was that financial ratio variables were the key variables for predicting corporate failure unlike non-financial variables such as corporate governance.
majorly relied on financial and non-financial variables excluding macroeconomi c variables.
Review of the prediction power of Altman & Ohlson Models in predicting bankruptcy of Listed Companies in Tehran Stock Exchange – Iran
Moghadam, & Mohammad Fard (2010)
• Size • Working
capital over total assets • Retained Earnings over total assets • Earnings before
interest and tax (EBIT) to total assets • Equity
market value to book value of Total assets
• A Net worth to Total Liabilities • Sales to Total
assets
-Altman and Ohlson Models.
-The findings revealed that Original Ohlson (1980) model had more power in prediction of bankruptcy issue on Iranian listed companies than the Altman model.
The study did not consider non-financial and macro-economic variables.
An Empirical Study on the Corporate Financial Distress Prediction Based on Logistic Model: Evidence from China’s Manufacturing Industry • Financial • Profitability • Operating capacity (T/O) • Cash-flow indicators • Ownership concentration • Board characteristic s -Logistic Model
The model with non-financial indicators proved to be more reliable in financial distress prediction and the timeliness and long-run validity of the mix model was much better in comparison with the model with only financial
The model incorporated financial and non- financial variable
19
Jiming & Weiwei (2011). indicators.
Bankruptcy prediction of firms listed at the Nairobi securities exchange
Mohamed (2012)
• Leverage • Profitability • Liquidity • Efficiency • Asset turn
over • Earning
power
Altman’s Z –score model.
- Financial ratios can be used to predict bankruptcy. Altman’s (1993) Z” score model is an efficient tool in predicting bankruptcy prediction.
-The model relied only on financial ratios hence did not incorporate non- financial factors.
Discriminant Analysis and the Prediction of Corporate Bankruptcy in the Banking Sector of Nigeria
Pam (2013)
• Leverage • Profitability • Liquidity • Efficiency • Asset turn
over • Security
prices
- Altman’s model (Multiple Discriminant Analysis)
-The findings revealed that MDA model was found to be a potent tool in the prediction of the potential of failure
-The model did not consider
macro-economic and non-financial variables.
Source: Author (2015)
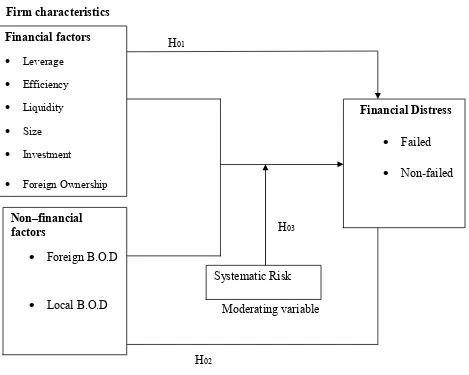
2.4 Conceptual Framework
A conceptual framework is diagrammatical representation showing the relationship between
independent and dependent variables in the study. The conceptual framework shows how
firm characteristics under the three categories affected financial distress. The independent
variables were classified into financial variables, non-financial variable and systematic risk as
a moderating variable. Financial variable included leverage, efficiency, liquidity and Size.
Non-financial variables included shareholdings and Board of director’s characteristics. This
revealed how corporate governance could lead to financial distress to a firm. Systematic risk
was the moderating variable between the independent variables and dependent variable. The
dependent variable under investigation was financial distress which had a binary output
20
adopted Altman’s decision rule in predicting financial distress on the dependent variable. A
score below 1.8 meant that the company was probably headed for bankruptcy hence failed
firm, while companies with scores above 3.0 were not likely to go bankrupt hence non-failed
firm. The lower / higher the score, the lower / higher the likelihood of bankruptcy.
Independent Variables Dependent
Firm characteristics
H01
H03
Moderating variable
H02
Figure 2.1: Conceptual framework
Source: Author (2015)
Systematic Risk
Non–financial factors
• Foreign B.O.D
• Local B.O.D
Financial Distress
• Failed
• Non-failed
Financial factors • Leverage
• Efficiency
• Liquidity
• Size
• Investment
21
CHAPTER THREE
RESEARCH METHODOLOGY 3.1. Introduction
This chapter presents the research methodology used in the study. It covers the research
philosophy, modeling, research design, target population, data collection instruments and
procedures, data analysis tool and diagnostic tests was carried out on the study.
3.2 Research Philosophy
This study was based on Positivism research philosophy. Positivism is based on believe of
stable reality which can be described from an objective perspective (Saunders & Lewis,
2000). In this case, the phenomena being studied is not interfered with. Positivism involves
manipulation of reality with variations on single independent variable in order to identify
regularities and establish the relationship that exists between the elements in social world.
Positivism supports this study since it aims at working with observable reality (testing the
effect of firm characteristics on financial distress on listed firms on Nairobi securities
exchange market). In this case the researcher collected data independently and analyzed it
with statistical tools. Neither the subject influenced the researcher nor did the researcher
influence the subject.
3.3 Research Design
A research design is the blue print of every research and outlines the procedure for collecting
and analyzing data. According to Kothari(2004), a research design is arrangement of the set
condition for data collection and analysis. This arrangement is done in such a manner that its
aims at combining relevance to the study with the economy in procedure. It defines the
22
design. This is in line with Ghauri and Gronhaug (2005) who defined causal research as
research with cause and effects with the main task being to isolate the causes and attempt to
conclude the extent of these causes. Causal research design helped to establish the cause and
effects of the relationship between independent variables and dependent variable hence
testing the hypothesis set for the study. The aim of the study was to establish the effect of
firm characteristics on financial distress on non-financial firms operating in different sectors
on NSE, Kenya.
3.4 Panel Logit Regression Model
This study adopts the Panel Logit model. Panel Logit model is a probabilistic statistical
model which measure the relationship between dependent variables and one or more
independent variables Agresti (1996). According to Pallant (2007), there are three
assumptions underpinning logistic regressions. The assumption concerning the number of
cases in the sample and the number of independent variables included in the model. Research
analysis might have problems with small samples with large number of independent
variables. The second assumption requires checking for interconnections among independent
variables or multicollinearity. These variables have to be strongly related to dependent
variables but not strongly related to each other. This implies that highly intercorrelating
variables have to be removed (Pallant, 2007). Third assumption refers to checking for the
presence of outliers within the logistic regression model. Outliers can influence the results of
logistic regression.
Panel Logit regression regression reflects the interactions terms and non-linearity random
effect of maximum-likelihood estimation of Logit regression that simultaneously relates to
explanatory variables. The regression is based on a panel of 42 non-financial firms with some
23
as a continuous process where a firm moves from one state to another. In this case, the
process of a firm from healthy state, distress state and recovery can be easily traced by using
the model. Panel Logit regression output has a dependent dummy binary variable. The
variable expresses a financial state, where it takes the value 1 if the specific company
in the certain time period is on financial distress and value 0 if is characterized by
financial stability.
Panel Logit model is computed using dependant variable which are dichotomous. In this
study the output y is a binary dummy variable taking value 1 if is a financial distress
period and value zero (0) otherwise (financial stability period). The independent
predictor variable can take any form. The model aims at discovering the relationship between
variables (Tabachnick & Fidell 1996). Where panel Logit represents the probability of
financial distress for the firm,
x
1 represents the set of n independent variables for the firm.These independent variables are ratios which were computed using the firms financial
statements. The intercept and coefficients of these independent variables are denoted by α
and β . This model is based on maximum likelyhood- estimation procedure. The independent
variables in the study can be analyzed in the model as follows:
i) Leverage = Total liabilities/ Total asset(X1,LEV)
ii) Efficiency = EBITDA/Total asset (X2,EFF)
iii) Liquidity = working capital/ Total assets (X3LIQ)
iv) Firm size = (natural logarithm of assets) = ln(assets) (X4. FSZ)
v) Investment (Tobin Q) = Total Market value of firm/ Total asset (X5 TBQ)
24
vii) Board of director characteristics= Local/foreign (X7 BOD)
viii) Systematic risk (X8,SMR)
The model can be analyzed as follows:
Logit (E[Yі| x1,i ………xm,i]) = Logit (pi) = ln Pi = β0+β1,x1, m i +…+βmxm,i +
ᶓ
01 - Pi
Therefore the empirical model:
Logit (pi)= β0+ β1(LEV)im+ β (EFF) im + β (LIQ) im + β 4(FSZ) im + β 5(INV) im + β 6(SHG) im + β7(BOD im)+ β 8(SMR) im + ᶓ0
Where; i = observations
ᶓ
0 = Error termm = 2004-2012 (Period/ time) β = the coefficient of the predictor variables
x = variables
The decision criterion on the dependent variable was based on Altman’s Z - score model. A
score below 1.8 meant that the firm was probably headed for bankruptcy, while firms with
scores above 2.99 were not likely to go bankrupt. The lower or higher the score, the lower or
25
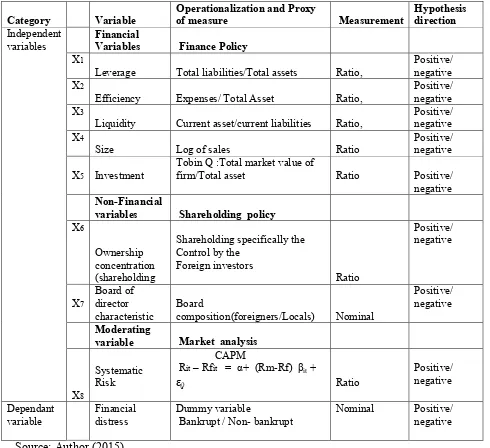
3.5. Operationalization and measurement of variables
The table below shows how the independent variables and the dependent variables have been
operationized. In addition, the proxy of measure and the direction of the hypothesis is
tabulated.
Table 3.1: Operationalization and measurement of study variables
Category Variable
Operationalization and Proxy
of measure Measurement
Hypothesis direction
Independent variables
Financial
Variables Finance Policy
X1
Leverage Total liabilities/Total assets Ratio,
Positive/ negative X2
Efficiency Expenses/ Total Asset Ratio,
Positive/ negative X3
Liquidity Current asset/current liabilities Ratio,
Positive/ negative X4
Size Log of sales Ratio
Positive/ negative
X5 Investment
Tobin Q :Total market value of
firm/Total asset Ratio
Positive/ negative
Non-Financial
variables Shareholding policy X6
Ownership concentration (shareholding
Shareholding specifically the Control by the
Foreign investors Ratio Positive/ negative X7 Board of director characteristic Board
composition(foreigners/Locals) Nominal
Positive/ negative
Moderating
variable Market analysis
Systematic Risk
CAPM
Rit – Rfit = α+ (Rm-Rf) βit +
ᶓ0 Ratio
Positive/ negative X8 Dependant variable Financial distress Dummy variable
Bankrupt / Non- bankrupt
Nominal Positive/ negative
26
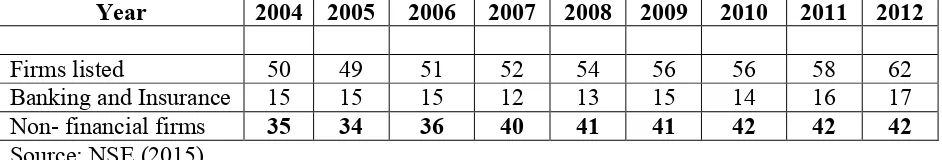
3.6 Target Population
The target population consisted of all non-financial firms listed in Nairobi securities
exchange (NSE). The NSE had 42 listed non-financial firms out of 62 listed firms by 31st
December 2012. This is in line with Ogula (2005) who defined a target population as a group
of objects which have similar characteristics. The criterion on failed firms was based on the
fact that, some firms have been suspended or delisted up to the current date. Banking and
insurance firms was excluded from the sample. Banking institutions are highly regulated by
the central bank in Kenya and uses Capital Adequacy, Assets, Management Capability,
Earnings, Liquidity, Sensitivity (CAMEL) rating model for bankruptcy prediction, Santos
(2001). Insurance firms are regulated by Insurance regulation Authority (IRA) and use
Capital adequacy, asset quality, reinsurance, adequacy of claim provisions, Management,
Earning quality, Liquidity, Subsidiaries (CARAMEL) models in bankruptcy prediction. This
study adopted a census approach due to the small number of non- financial firms listed at the
NSE. According to (Saunders, Thornhill and Lewis 2009) the approach enhances data
validity by ensuring inclusion of certain vital information for the study. Listed firms at NSE
are classified in the following categories; Agriculture, commercial and services,
telecommunication, Automobile and accessory, Banking, energy and petroleum, Insurance,
Investment, manufacturing, construction and allied and growth enterprise market segment
sectors.
27
Table 3.3 Target Population
Source: NSE (2015)
3.7 Sampling
The resercher conducted a census of all non financial firms using the inclusion exclusion
criteria derived from different characteristics. This is in line with Bhatnagar (1995) who
stated that inclusion charactristics being prospective subjects must have if they are to be
included in the study, while exclusion criteria are those characteristics that disqualify
prospective subjects from inclusion in the study.
3.8 Data collection Instrument
The study used secondary data. Data for all variables was arranged in Panels. Data
incorporated all non-financial companies including delisted ones in order to avoid
survivorship biasness in the study.
3.9 Data collection Procedure
This study used panel data. This enhanced quantity and quality of data at all levels.
According to Kothari (2004), when deciding on data collection procedure, one needs to
safeguard against bias and unreliability of the procedure used. This study used secondary data
from NSE hand books and published financial statements. In addition, the study collected
secondary data from investment funds. From the financial statements the researcher
considered income statement, statement of financial position and notes to the accounts for the
stated period of the study. Data was arranged in data collection schedules. All listed firms
Year 2004 2005 2006 2007 2008 2009 2010 2011 2012
28
were given equal chance regardless of their delisting period. This controlled biasness within
the study.
3.10 Data Analysis and Presentation
Quantitative data is analyzed using inferential statistics which include; panel multiple
regression correlation and analysis of variance. The output of data analysis through Stata 13.0
was presented in a tabular form. For clear presentation the output data was cleaned for better
interpretation.
3.11 Diagnostic testing
The study carried out the following diagnostic tests on the data.
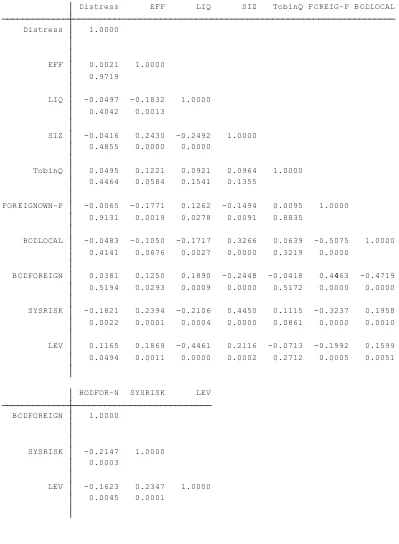
3.11.1 Multicollinearity
Multicollinearity refers to a situation in which two or more explanatory variables in a
multiple regression model are highly linearly related. In order to check multicollinearity in
the nine factors, the study checked on the interconnection among these factors.
Multicollinearity occurs when these factors are highly correlated with the value of r being
less than 0.9 (Tabachick and Fidell, 2007. This test was carried out under Pearson correlation
and the output was explained in chapter four.
3.11.2 Heteroscedasticity
Heteroscedasticity is a serious problem for Logit as it causes the estimates to be inconsistent. Verbeek (2009) argued that since these models are usually estimated using
cross-sectional data then the problem likely to be encountered quite often. The study carried
29
3.11.3 Overall evaluation of the model using likelihood ratio test
A logistic model is said to provide a better fit to the data if it demonstrates an improvement
over the intercept-only model (also called the null model). Likelihood ratio test is based on
the difference in deviance without any predictor in the model minus the deviance with all
predictors in the model. An intercept-only model serves as a good baseline because it
contains no predictors (Peng et al., 2002). In this study, all observations were predicted to
belong to the largest outcome category. An improvement over this baseline was examined by
using the likelihood ratio inferential statistical tests.
3.12 Ethical Standards
This is in line with the moral principles guiding the research work all the way from inception,
completion to publication of the research work. The researcher ensured that the study
obtained a valid consent on every person from whom the data was gathered from. The
researcher wrote emails and used official research letters from NACOSTI and University to
seek this consent. In addition, the researcher ensured confidentiality on the information.
Information obtained from participants during the study was treated as confidential unless
otherwise advised. In situations where confidentiality would not be guaranteed, the
participants were informed in advance before engaging them in the study. The researcher also
exercised justice on equitable selection of the participants. All the stake holders involved in
30
CHAPTER FOUR
DATA ANALYSIS AND PRESENTATION 4.1 Introduction
This chapter presents data analysis. It contains statistical summary and results from empirical
analysis and the interpretations of the statistical inferences derived from the compiled data
strived to accomplish the objective of the study. The econometric evaluation of the model
was conducted by the use of Logit model with output being either, failed or non-failed firms
in financial distress.
The secondary data was obtained from the annual NSE hand books, published financial
statements and investment funds. From the financial statements the researcher considered
income statement, statement of financial position and notes to the accounts for the stated
period of the study (2004-2012) of eight years.
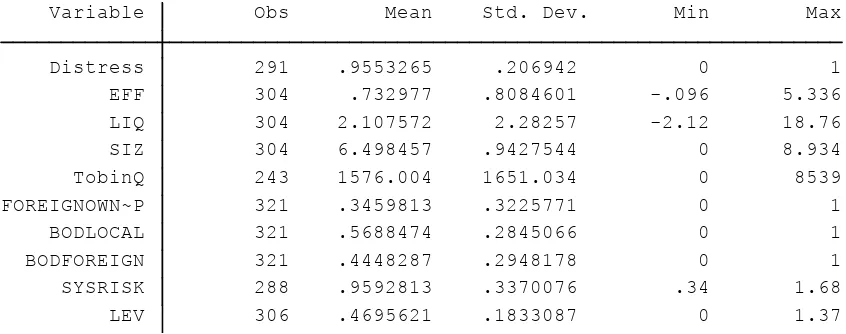
4.2 Summary of Descriptive Statistics
The study carried out descriptive statistics of the eleven study variables and are presented in
31
Table 4.1: Summary of Descriptive Statistics
LEV 306 .4695621 .1833087 0 1.37 SYSRISK 288 .9592813 .3370076 .34 1.68 BODFOREIGN 321 .4448287 .2948178 0 1 BODLOCAL 321 .5688474 .2845066 0 1 FOREIGNOWN~P 321 .3459813 .3225771 0 1 TobinQ 243 1576.004 1651.034 0 8539 SIZ 304 6.498457 .9427544 0 8.934 LIQ 304 2.107572 2.28257 -2.12 18.76 EFF 304 .732977 .8084601 -.096 5.336 Distress 291 .9553265 .206942 0 1 Variable Obs Mean Std. Dev. Min Max
Source: Research data, 2015.
The Table 4.1 presents the summary of the all variables under study that explained the
financial distress of the non financial firms listed in the NSE. All of the variables were
converted in ratio formats before analysis. A mean of 0.732 [.808] was obtained on
efficiency, liquidity had mean of 2.11[2.28], firm size had mmean of 6.50 [0.943], TobinQ
mean of 1576 [1651.03], foreign ownership had a mean of .346 [.322], local BOD
composition had a mean of .569[.284], foreign BOD composition had a mean of .445[.295],
leverage and systemic risk had mean of .470 [.183] and .960 [.337] respectively.
4.3 Diagnostic Tests
4.3.1 Heteroscedasticity Test
The Pagan test is designed to detect any linear form of heteroscedasticity.
Breusch-Pagan / Cook-Weisberg test, the null hypothesis that the error variances are all equal versus
32
Breusch-Pagan test was carried out and high Chi value obtained (259.32) with significant p
value (<0.05) indicates presence of heteroscedasticity among the study variables.
Figure 4.1: Breusch-Pagan Heteroscedasticity test
Prob > chi2 = 0.0000 chi2(1) = 259.32
Variables: fitted values of Distress Ho: Constant variance
Breusch-Pagan / Cook-Weisberg test for heteroskedasticity
Source: Research data, 2015.
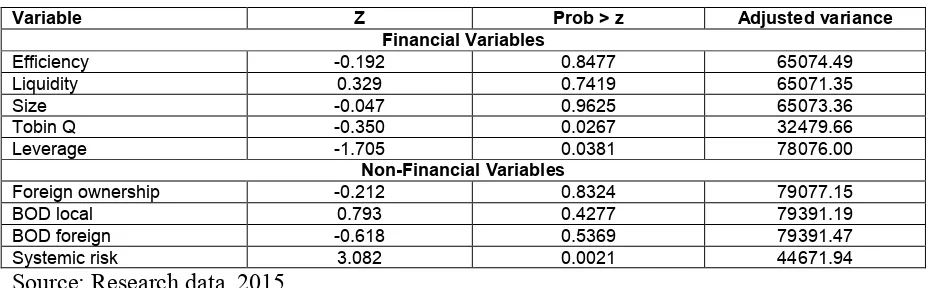
4.3.2 Mann-Whitney Wilcoxon test
The Wilcoxon-Mann-Whitney test is a non-parametric analog to the independent samples
t-test and can be used when one does not assume that the dependent variable is a normally
distributed interval variable. It is normally referred as the Mann-Whitney U test or the
Wilcoxon rank sum test. Anderson, Sweeney and Williams (2008) concluded that both the
Mann-Whitney U test and Wilcoxon rank sum test are equivalent. The test was developed
jointly by Mann, Whitney and Wilcoxon. Therefore, present studies refer these two tests as
the Mann-Whitney-Wilcoxon (MWW) test. The Wilcoxon-Mann-Whitney test was carried
and the results are presented Table 4.2. The MWW test was used to test hypothesis 1,
hypothesis 2, and hypothesis 3. The test revealed key factors that were significant in
explaining financial distress in listed non- financial firms in NSE.
The study sought to test the following hypotheses.
H01: Financial factors have no influence on financial distress on listed firms in