Genetic Variation of Kenyan Populations of
Warburgia ugandensis
,
an Important East African Highlands Medicinal Tree Species
Alice Muchugi1,2, Roland Kindt1, Geoffrey M. Muluvi2, Edward Muge1, Hillary Kipruto1and Ramni H. Jamnadass1
1 World Agroforestry Centre (ICRAF). P.O. Box 30677 00100 Nairobi, Kenya 2Department of Biochemistry and Biotechnology, Kenyatta University,
PO. Box 43844 00100 Nairobi, Kenya
KEYWORDS African Medicinal Species. AFLP. Genetic Variation. Kenyan Rift Valley
ABSTRACT Warburgia ugandensis is an important medicinal tree species in Eastern Africa used to treat several ailments. Wild populations are under great threat due to unsustainable harvesting for medicines and indiscriminate felling of trees for timber and firewood. There is an urgent need for developing and implementing conservation strategies of this species and information on genetic structure is a crucial input. Analysis of molecular variance (AMOVA), which employed 141 AFLP markers revealed most genetic variation to be among individuals within populations (59%, P< 0.0001),but variation among populations (41%, P< 0.0001) was highly significant as well. Constrained ordination analysis illustrating the relationship among populations showed a clear distinction between W. ugandensis from Uganda and western Kenya and other W. ugandensis
populations. No correspondence was shown in some cases on pair-wise genetic distances and geographic distances among populations. These findings suggested that conservation strategies for the species in Kenya should place relatively more emphasis on the revealed genetic structuring within the country.
Address for correspondence:
Alice Muchugi,
Department of Biochemistry and Biotechnology, Kenyatta University
PO Box 43844-00100 Nairobi, Kenya
E-mail: amuchugi@gmail.com
INTRODUCTION
The World Health Organisation estimates that 80% of the world’s population rely on tra-ditional herbal remedies (WHO 2002). However, over-harvesting and poor harvesting techniques of plants with medicinal value, as well as en-croachment of their natural habitat, threaten their survival and conservation. Warburgia ugandensis is one of such species. It is widely used by the local communities to cure several ailments such as such as stomach ache, consti-pation, toothache, common cold, cough, fever, muscle pains, weak joints, candidiasis, measles and malaria, (Beentje 1994; Kokwaro 1976). It is also used in treating livestock diseases, for example, trypanasomiasis (Kioy et al. 1990; Olila et al. 2001). Stem and root barks as well as leafy twigs are harvested and their raw ex-tract used singly or in combination with other herbal plants.
The species extracts have high antibacterial (Olila et al. 2001; Wube et al. 2005), antifungal (Taniguchi and Kubo 1993) and molluscidal (Kubo et al. 1983). Important phytochemicals isolated from W. ugandensis extracts are mainly
drimane sesquiterpenes such as muzigadial, ugandensial, polgodial, mukadial, warburganal, ugadensial and ugadensiolide (Kioy et al, 1990; Kubo et al. 2005; Olila et al. 2001; Taniguchi and Kubo 1993). With the positive results in vivo and in vitro trials against economically important tropical diseases such as malaria (Muregi et al. 2003) and measles (Olila et al. 2001), there is great potential for W. ugandensis pharmaceutical products in the commercial markets. In Kenya and Uganda, a few herbal-ists have started packaging W. ugandensis ex-tracts for the local markets (www.naturally africanplatform). Extracts from a species in the same genus that has a wider distribution in southern African countries, W. Salutaris, are commercially processed in South Africa and marketed internationally at highly competitive prices (Botha et al. 2004).
defined use are not. To enhance the W. uganden-sis conservation and utilisation, planting of the species on farms is being encouraged. A pre-requisite for the efficient use of genetic resources in any planting program is a detailed under-standing of the extent and distribution of ge-netic variation available within a species. A pre-liminary study involving the species of genus Warburgia showed significant genetic differen-tiation within and among W. ugandensis popu-lations (Muchugi et al. 2008) and unique clus-tering in the ordination analysis linked to the population geographical position with relation to the eastern arm of the Rift Valley. This study therefore carried further analysis to assess the genetic structuring among W. ugandensis popu-lations from Kenya and two reference popula-tions from Tanzania and Uganda, with a pri-mary objective of determining more efficient management strategies for the species at national and regional levels.
Fig. 1. Geographical location of Warburgia ugandensis populations sampled for the study
MATERIALS AND METHOD
Genomic DNA was isolated from leaf mate-rial taken from 77 individuals sampled from seven populations of W. ugandensis (Fig. 1, Table 1). AFLP analysis was carried following the standard procedures described in Vos et al. (1995). Data generated was analysed using the GENALEX 6.2 (Peakall and Smouse 2006) to give genetic diversity and genetic distance mea-sures which were used to derive distance-based constrained ordination (Legendre and Ander-son 1999) was used to show correlation among populations. Analysis of molecular variance (AMOVA; Excoffier et al. 1992) was analysed using the Arlequin 3.1 (Schneideret al. 1997) package. Further analysis was carried out to assess the relationship between the species geo-graphic location and genetic diversity using the stepping stone model.
Population Points Rift Valey Faultlines Administrative Boundary Lakes
N 0 50 100 200
Table 1: Mean diversity estimates (H) for eight populations of Warburgia ugandensis generated from 141 AFLP markers for 77 individuals sampled from Kenya, Tanzania and Uganda. ‘Position’ denotes the population geographic position with relation to the Kenyan arm of the Rift Valley; east within or west. The percentage polymorphic loci (% loci) and sample size (N) are also shown
Country Population Position Sample H (SE)
name size (N)
Kenya Karura east 10 0.157 (0.016) Kitale west 10 0.161 (0.016) Cherangani west 10 0.126 (0.015) Laikipia within 10 0.163 (0.016) Masai Mara within 10 0.128 (0.015) Taita east 7 0.120 (0.014) Tanzania Lushoto east 10 0.135 (0.015) Uganda Kibale west 10 0.168 (0.015)
RESULTS
The AFLP analysis using four primer com-binations; EcoRI+ACA/MseI+CAA, EcoRI+ ACT/MseI+CAT, EcoRI+ACT/MseI+CAG and EcoRI+AGC/MseI+CAG, gave a total of 141 polymorphic markers. Frequencies of allele products generated with AFLP markers were calculated and used to estimate the genetic di-versity, H, within populations (Table 1). Results showed that the populations sampled were quite diverse with the Kibale population from Uganda having the highest diversity estimate (H = 0.168). Kenyan Masai Mara population showed the lowest diversity estimate (H = 0.120). Analy-sis of molecular variance (AMOVA) showed that most of the genetic variation (59%) was retained within the populations (Table 2). Further tured AMOVA analysis with populations struc-tured with reference to the Rift Valley revealed this regional differentiation accounting for 35% of genetic variation. Constrained ordination analyses (Fig. 2) showed clear split between in-dividuals from Kitale and Cherangani tions from Kenya and Ugandan Kibale
popula-tion on the right side quadrants, from the other four Kenyan populations (Karura, Laikipia, Masai Mara and Taita) and the Tanzanian popu-lation from Lushoto, which were in the left side quadrants. The Kenyan Cherangani population Kitale and Ugandan Kibale populations differ-entiated clearly, with each population falling in its own quadrant on the left side. Clear group-ing was also evident in the Kenyan Taita and Tanzanian Lushoto populations in the lower part of the left side quadrant while Karura, Laikipia and Masai Mara (all from Kenya) were on the upper part of the left side quadrant.
An assessment of the relationship between pair- wise genetic distance and geographic dis-tance among populations indicated that genetic distances from the focal population clearly had non-linear relationships with geographic tances (Figs. 3 and 4, Table 3). The genetic dis-tance did not always increase with geographic distance; for example, the investigation with Cherangani as the focal population and the Nei genetic distance showed that genetic distance decreased from the Karura stepping stone popu-lation (genetic distance in between Cherangani and Karura = 0.319) to the Kibale next step-ping stone (Nei genetic distance in between Cherangani and Kibale = 0.146), whereas the geographic distance from the focal population increased from 295 to 509 km (Fig. 3, Table 3). Indeed several genetic distances increased at a greater rate than the change in geographic dis-tance (Table 3, numbers indicated in bold) while in others genetic distances decreased at a greater rate than the change in geographic distance (Table 3, underlined numbers). Taking the ear-lier example, the change in genetic distance between the Karura and Kibale stepping stones was -1.19 ([0.146 – 0.319] / 0.319), which cor-responds to a larger absolute change in distance than the change in geographic distance of 0.72
Table 2: Analysis of molecular variance (AMOVA) based on 141 AFLP markers for 77 individuals sampled from Kenya, Tanzania and Uganda. Nested analysis was undertaken on population regional basis with respect to the Kenyan arm of the Rift Valley (east, within and west). Degrees of freedom (df), sum of squares (SS) mean squared deviation (MSDs) and the % variances are shown
Source of variation d.f. SS MSD % of total P value
variance
Among all populations 7 677.79 96.83 41.0 0.0001 Among individuals within populations 69 876.34 12.70 59.0 0.0001
Among regions 2 380.44 190.22 23.0 0.0001
Fig. 2. Ordination diagram for eight populations of Warburgia ugandensis generated with Jaccard distance-based redundancy analysis using longitude and latitude of individual trees as explanatory variables with 141 AFLP markers. These two constrained ordination axes explain 16.6% of squared Jaccard distances (P = 0.001 based on 1000 permutations). Spiderplots summarise the distribution of individuals of the same population
([509 - 295] / 295). For each focal population, the number of instances where genetic distance changed significantly in between two stepping stone populations was counted and then classi-fied changes in genetic distances in terms of changes between stepping stones that occurred in the same geographic region (Table 4) and changes that occurred in between geographic regions (Table 5).
On the analysis where other populations were sorted out as stepping stones from each focal population based on their geographic dis-tance, significant changes were not expected for stepping stone populations that occurred within the same geographic region,. However, Kitale and Cherangani (two populations occurring closely on the western side of the Rift Valley) showed significant changes (Table 4). For focal populations from the west (Kibale) and from the east (Taita and Lushoto), Cherangani had a sig-nificantly larger genetic distance than Kitale. For focal populations from the Rift Valley, Cherangani was significantly closer to Laiki-pia, whereas Kitale was significantly closer to the Masai Mara. Another odd pattern occurred where the Masai Mara was significantly closer to Taita (East) than to Lushoto (East).
DISCUSSION
Although population densities of W. ugandensis trees in the sampled populations were quite low in the ecological survey, genetic diversity was high within these populations when compared to other molecular studies on other indigenous tree species within the same region (Dawson and Powell 1999; Kadu et al. 2006; Lengeek et al. 2006; Muchugi et al. 2006). This was contrary to the expectations as low population densities have been linked to reduc-tion in populareduc-tion heterozygosity and gene di-versity (Dusan 1992), which is attributed to re-stricted maternal mother trees and genetic drift. This is because mating between related individu-als (inbreeding) accelerates the reduction in heterozygosity by reducing the effective popu-lation size (Hamrick and Godt 1989). However, in this case, the low population is recent (occa-sioned by felling of mature trees) and the ob-served high genetic diversity is resulting from remnant trees of the previous wide distribution. The high genetic diversity is important for the species adaptation to changing user require-ments in different environrequire-ments. In collection of W. ugandensis germplasm material for
plant-CHERANGANI KARURA KIBALE KITALE LAIKIPIA LUSHOTO MASAI_MARA TAITA
-2 -1 0 1 2
-1
0
1
2
CAP 2
Fig. 3. Change in the Nei genetic distance from a focal population west of the Rift Valley in respect to geographic distance. The arrow indicates a significant decrease in genetic distance from Karura to Kibale for the investigation for the Cherangani focal population. Populations are indicated by symbols, whereas investigations from the same focal population are connected by the same line type
Fig. 4. Change in the Nei genetic distance from a focal population east of the Rift Valley in respect to geographic distance Graphs for the focal populations from the. The arrow indicates a non-significant increase in genetic distance from Lushoto to Kibale from the Karura focal population. Populations are indicated by symbols, whereas investiga-tions from the same focal population are connected by the same line type
Kibale focal Kitale focal Cherangani focal East
Rift West
Nei distance (GenAIEx)
0.35
0.3
0.25
0.2
0.15
0.1
0.05
0
0 200 400 600 800 1000 1200
Geographic distance (km)
Nei distance (GenAIEx)
0.35
0.3
0.25
0.2
0.15
0.1
0.05
0
0 200 400 600 800 1000 1200
Geographic distance (km)
Table 3: Geographic and pairwise genetic distances among populations from each focal population and the other populations are sorted as stepping stones. Distances in bold showed a significant increase in genetic distance compared to the previous stepping stone population, whereas distances that were underlined indicate a significant decrease in genetic distance
Pairwise Stepping stone Focal population (abbreviation)
distance populations
CHE KIB KIT LAI MAS KAR LUS TAI
Geographic Cherangani 0 509 31 155 274 295 696 613
Kibale 509 0 479 640 575 717 1028 998
Kitale 31 479 0 184 283 319 716 637
Laikipia 155 640 184 0 221 157 561 467 Masai Mara 274 575 283 221 0 171 469 424 Karura 295 717 319 157 171 0 405 318 Lushoto 696 1028 716 561 469 405 0 132
Taita 613 998 637 467 424 318 132 0
Nei distance Cherangani 0.000 0.146 0.135 0.247 0.297 0.319 0.273 0.276
Kibale 0.146 0.000 0.099 0.089 0.128 0.162 0.109 0.089 Kitale 0.135 0.099 0.000 0.169 0.179 0.186 0.192 0.208 Laikipia 0.247 0.089 0.169 0.000 0.036 0.054 0.033 0.021 Masai Mara 0.297 0.128 0.179 0.036 0.000 0.053 0.026 0.060 Karura 0.319 0.162 0.186 0.054 0.053 0.000 0.066 0.083 Lushoto 0.273 0.109 0.192 0.033 0.026 0.066 0.000 0.037 Taita 0.276 0.089 0.208 0.021 0.060 0.083 0.037 0.000
Average Cherangani 0.337 0.723 0.570 0.826 0.818 0.789 0.829 0.881
Jaccard Kibale 0.723 0.618 0.665 0.827 0.806 0.786 0.817 0.860
Kitale 0.570 0.665 0.352 0.745 0.709 0.669 0.747 0.819 Laikipia 0.826 0.827 0.745 0.534 0.589 0.561 0.616 0.670 Masai_Mara 0.818 0.806 0.709 0.589 0.406 0.511 0.523 0.650 Karura 0.789 0.786 0.669 0.561 0.511 0.375 0.556 0.647 Lushoto 0.829 0.817 0.747 0.616 0.523 0.556 0.460 0.658 Taita 0.881 0.860 0.819 0.670 0.650 0.647 0.658 0.540
Number of Cherangani 84 36 48 30 36 28 33 33
homo- Kibale 36 51 33 25 27 22 27 26
geneous Kitale 48 33 70 33 40 38 36 37
loci Laikipia 30 25 33 70 55 52 53 55
Masai_Mara 36 27 40 55 84 57 67 62
Karura 28 22 38 52 57 74 53 54
Lushoto 33 27 36 53 67 53 81 62
Taita 33 26 37 55 62 54 62 82
Table 4: Changes in genetic distance between two stepping stone populations from the same region for population genetic distances (Pop, 9 tests), average distances between individuals (Ind, 9 tests) and number of loci that were homozygous (Loc, 3 tests). Bold figures indicate situations were more than 50% of tests resulted in significant changes
Group Previous Stepping Focal Pop Ind Loc
stepping stone
stone
West Kitale Cherangani Kibale 9 0 5 0 0 0
Kitale Kibale Lushoto 0 4 0 0 0 0
Kitale Kibale Taita 0 0 0 0 0 0
Cherangani Kitale Masai Mara 0 9 0 9 0 1
Cherangani Kitale Taita 0 8 0 8 0 1
Cherangani Kitale Lushoto 0 9 0 9 0 0
Cherangani Kitale Laikipia 9 0 7 0 2 0
Rift Masai Mara Laikipia Taita 1 2 1 2 0 0 Masai Mara Laikipia Kibale 0 6 0 1 0 0 Masai Mara Laikipia Lushoto 7 0 0 0 0 0 Laikipia Masai Mara Karura 4 1 1 3 0 0 Laikipia Masai Mara Kitale 0 0 0 0 0 0 Laikipia Masai Mara Cherangani 0 0 0 0 0 0
East Taita Karura Lushoto 0 0 0 0 0 0
Taita Lushoto Masai Mara 0 9 0 6 0 0
Taita Lushoto Kitale 0 0 0 2 0 0
Taita Lushoto Kibale 6 0 5 1 0 0
Taita Lushoto Laikipia 4 0 0 0 0 0
Taita Lushoto Cherangani 0 0 1 0 0 0
Lushoto Karura Taita 0 0 0 0 0 0
Karura Taita Kibale 0 4 0 0 0 0
ing programs, proper sampling should aim at maximizing conservation of the high intra-popu-lation genetic diversity found in the natural populations. Distribution of planting material with high genetic base will cushion subsequent generations of founder effects (Simons et al. 1993). For all categories of AMOVA analyses in both markers, results showed most of the ge-netic variations being retained within individu-als among sampled populations rather than among populations. This is quite in agreement with previous finding where tropical woody pe-rennials were found to maintain most of the genetic variation within populations (Hamrick et al. 1992). Focusing on a few populations for conservation purposes at national level would therefore capture the genetic differentiation.
Both the ordination and cluster analysis showed that the Kitale populations from Kenya clustered together with the Kibale population from Uganda rather than with other geographi-cally closer Kenyan populations. A similar grouping was observed among Kenyan
popula-tions of Prunus africana (Muchugi et al. 2006). This study further confirmed the implied theo-ries of African floral evolution (White 1983), which considers western Kenya as the most east-ern remnant of the Guineo-Congolian phyto-choria while eastern Kenya populations fall within the Somalia-Masai centre of endemism. Such genetic differentiation reflects the differ-ent evolutionary history of the species in the different ecological niches combined with dif-ferent gene dispersal mechanisms (White 1983). Previous work by Martinelli et al. (1986) showed that at a macrogeographic scale across Africa, the composition P. africana bark extract depends on the origin of material. Accordingly, phy-tochemical analyses on active ingredients in W. ugandensis extracts associated with the herbal therapy may show similar diversity between these grouping and may influence the selection of superior material for domestication. It is therefore important that conservation of the spe-cies in Kenya must inevitably consider anthro-pogenic impacts on W. ugandensis germplasm distribution as the species cultivation increases.
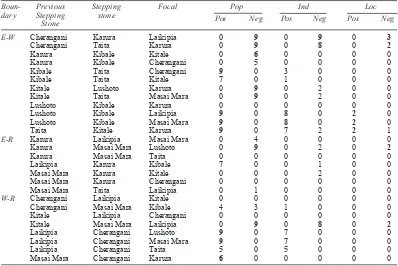
Table 5: Changes in genetic distance between two stepping stone populations from different regions derived from population genetic distances (Pop, 9 tests), average distances between individuals (Ind, 9 tests) and number of loci that were homozygous (Loc, 3 tests). Bold figures indicate situations were more than 50% of tests resulted in significant changes
Boun- Previous Stepping Focal Pop Ind Loc
dary Stepping stone
Stone
E-W Cherangani Karura Laikipia 0 9 0 9 0 3
Cherangani Taita Karura 0 9 0 8 0 2
Karura Kibale Kitale 0 6 0 0 0 0
Karura Kibale Cherangani 0 5 0 0 0 0
Kibale Taita Cherangani 9 0 3 0 0 0
Kibale Taita Kitale 7 0 1 0 0 0
Kitale Lushoto Karura 0 9 0 2 0 0
Kitale Taita Masai Mara 0 9 0 2 0 0
Lushoto Kibale Karura 0 0 0 0 0 0
Lushoto Kibale Laikipia 9 0 8 0 2 0
Lushoto Kibale Masai Mara 9 0 8 0 2 0
Taita Kitale Karura 9 0 7 2 2 1
E-R Karura Laikipia Masai Mara 0 4 0 0 0 0
Karura Masai Mara Lushoto 0 9 0 2 0 2
Karura Masai Mara Taita 0 0 0 0 0 0
Laikipia Karura Kibale 7 0 0 1 0 0
Masai Mara Karura Kitale 0 0 0 2 0 0
Masai Mara Karura Cherangani 0 0 0 0 0 0
Masai Mara Taita Laikipia 0 1 0 0 0 0
W-R Cherangani Laikipia Kitale 0 0 0 0 0 0 Cherangani Masai Mara Kibale 4 3 1 0 0 0
Kitale Laikipia Cherangani 0 0 0 0 0 0
Kitale Masai Mara Laikipia 0 9 0 8 0 2
Laikipia Cherangani Lushoto 9 0 7 0 0 0 Laikipia Cherangani Masai Mara 9 0 7 0 0 0
Laikipia Cherangani Taita 5 0 5 0 0 0
Masai Mara Cherangani Karura 6 0 0 0 0 0
A regular decrease of genetic similarity with increasing geographic distance was predicted by the theory of isolation by distance and by the stepping stone model (Cox and Durrett 2002) under the assumption that movement connected with mating is usually restricted to short dis-tances. Results from the analysis of geographic and pairwise genetic distances among popula-tions from each focal population and the other populations are sorted as stepping stones showed interesting patterns. In case that stepping stone population was from the same region as the fo-cal population, a significant decrease in genetic distance was expected while in case that the previous stepping stone population was from the same region as the focal population, then a sig-nificant increase in genetic distance was ex-pected. This pattern was observed in most cases which explained further the genetic differentia-tion shown by AMOVA and constrained ordi-nation analysis. However two odd patterns were identified. The first odd pattern showed that the genetic distance decreased in between Karura and the Masai Mara for the focal population of Lushoto, whereas an increase was expected since Lushoto and Karura both occur on the eastern side of the Rift Valley. The second odd pattern was obtained for the change in distance from Cherangani to the Masai Mara with the Kibale focal population as four population genetic dis-tances confirmed an increase (as expected since Cherangani and Kibale belong to the same re-gion), whereas three population genetic dis-tances confirmed a decrease. The seven cases investigated did not confirm significant change. For example, there was no significant change from the Karura-Lushoto genetic distance to the Karura-Kibale genetic distance whereas had a significant decrease was expected as Karura and Lushoto occur on the east whereas Kibale oc-curs on the west. Checking for the Nei genetic distance showed that the Karura-Lushoto dis-tance was 0.066 and the Karura-Kibale genetic distance was 0.162 (Table 3). However, for these populations, the change in genetic distance (0.59) was smaller than the change in geo-graphic distance (0.77) so that the test concluded that there was no significant change.
CONCLUSION
Warburgia ugandensis populations in Kenya display significant regional genetic
differentia-tion with respect to Rift Valley. These results confirm earlier suggestion that other evolution-ary factors rather than geographic distances are responsible for the genetic differentiation within the W. ugandensis populations in Kenya.
RECOMMENDATIONS
Conservation strategies of W. ugandensis in Kenya must put into consideration the genetic disjunction displayed by the populations across the Rift Valley so that unique regional germ-plasm is not lost through over exploitation. In addition, there is need to assess the active in-gredients in W. ugandensis extracts associated with the herbal therapy across the species range in Kenya to establish whether it will positive correlation to the genetic disjunction.
ACKNOWLEDGEMENTS
Funding for this research was provided by International Foundation for Agricultural Re-search (IFAR) and the core financial support from European Commission and USAID to the World Agroforestry Centre (ICRAF).
REFERENCES
Beentje HJ 1994. Kenya Trees, Shrubs and Lianas. Nairobi, Kenya: National Museums of Kenya.
Botha J, Witkowski ETF, Shackleton CM 2004. The impact of commercial harvesting on Warburgia salutaris
(pepper-bark tree) in Mpumalanga, South Africa.
Biodiversity and Conservation, 13: 1675-1698. Cox JT, Durrett R 2002. The stepping stone model: New
formulas expose old myths. The Annals of Applied Probability, 12(4): 1348–1377.
Dawson IK, Powell W 1999. Genetic variation in the Afromontane tree Prunus africana, An endangered medicinal species. Molecular Ecology, 8: 151-156. Doyle JJ, Doyle JL 1987. CTAB DNA extraction in plants.
Phytochemical Bulletin, 19: 11-15.
Dusan G 1992. Effects of origin on the genetic diversity of Norway spruce (Picea abies Karst) populations. Forest Ecology and Management, 54: 215-223.
Excoffier L, Smouse PE, Quattro JM. 1992. Analysis of molecular variance inferred from metric distances among DNA haplotypes: Applications to human mitochondria DNA restriction data. Genetics, 131: 479-491.
Hamrick JL, Godt MW 1989. Allozyme diversity in plant species. In: ADH Brown, MT Clegg, AL Kahler, B Weir (Eds.): Plant Population Genetics, Breeding and Genetic Resources. Sunderland Massachusetts: Sinauer Press, pp. 43-63.
Hamrick JL, Godt MW, Sherman-Broyles SL 1992. Factors influencing genetic diversity in woody plants species.
Haraguchi H 1998. Mode of action of antimicrobial substances in plants. Recent Research Developments in Agricultural and Food Chemistry, 2: 259-268. Kadu CAC, Imbuga M, Jamnadass R, Dawson IK 2006.
Genetic management of indigenous fruit trees in southern Africa: A case study of Sclerocarya birrea based on chloroplast and nuclear variation. South African Journal of Botany, 72: 42-427.
Kioy D, Gray AI, Waterman PG 1990. A comparative study of the stem-bark drimane sesquiterpenes and leaf volatile oils of Warburgia ugandensis and S. stuhlmannii. Phytochemistry, 29(11): 3535-3538.
Kokwaro JO 1976. Medicinal Plants of East Africa. Nairobi, Kenya: East African Literature Bureau.
Kubo I, Fujita K, Lee SH, Joung Ha T 2005. Antibacterial activity of Polygodial. Phytotherapy Research, 19: 1013–1017.
Legendre P, Anderson MJ 1999. Distance-based redundancy analysis: Testing species responses in multi-factorial ecological experiments. Ecological Monographs, 69(1): 1-24.
Lengkeek AG, Muchugi AM, Agufa CAC, Ahenda JO, Dawson IK 2006. Comparing genetic diversity in agroforestry systems with natural forest: A case study of the important timber tree Vitex fischeri in central Kenya. Agroforestry Systems, 67: 293-300.
Martinelli EM, Seragli R, Pifferi G 1986. Characterisation of
Pygeum africanum bark extracts by high-resolution gas chromatography with computer assistance. Journal of High Resolution Chromatography and Chromato-graphy, 9: 106-110.
Muchugi A, Lengkeek AG , Kadu CAC, Muluvi GM, Njagi ENM, Dawson IK 2006. Genetic variation in the threatened medicinal tree Prunus africana Cameroon and Kenya: Implications for current management and evolutionary history. South African Journal of Botany,
72: 498-506.
MuchugiA, Muluvi GM,Kindt R, Kadu CAC,Simons AJ, Jamnadass RH 2008. Genetic structuring of important medicinal species of genus Warburgia as revealed by AFLP analysis. Trees Genetics and Genome, 4: 787-795.
Muregi WF, Njagi ENM, Ndiege IO, Chabbra SC, Langat-Thorwa C, Njue E, Omar SA, Mkoji GM 2003. In vivo anti-malarial activity of some Kenyan plants and their effects in combination with chloroquine. Journal of Ethnopharmacology, 84(2-3): 237-241.
Olila D, Olwa-Odyek B, Opuda-Asibo J 2001. Antibacterial and antifungal activities of extracts of Zanthoxylum chalybeum and Warburgia ugandensis. African Health Sciences, 1(2): 66-72.
Peakall R, Smouse PE 2006. GENALEX 6: Genetic analysis in Excel: Population genetic software for teaching and research. Molecular Ecology, 6(1): 288-295. Schneider S, Kueffer JM, Roessli D, Excoffier L 2000.
Arlequin ver. 1.1: A Software for Population Genetic Data Analysis. Switzerland: University of Geneva. Simons AJ, MacQueen DJ, Stewart JL 1993. Strategic
concepts in the domestication of non-industrial trees. In: RRB Leakey, AC Newton (Eds.): Tropical Trees: The Potential for Domestication and the Rebuilding of Forest Resource London, UK: HMSO, pp. 91-102. Sneath PHA, Sokal RR 1973. Numerical Taxonomy. San
Francisco, USA.: Freeman.
Taniguchi M, Kubo I 1993. Ethnobotanical drug discovery based on medicine men’s trials in the African savannah: Screening of East African plants for anti-microbial activity II. Journal of Natural Products, 56: 1539-1546.
Vos P, Hogers R, Bleecker M, Reijans V, Lee T, Hornes M, Freijters A, Pot J, Peleman J, Zabeau M 1995. AFLP: A new technique for DNA fingerprinting. Nucleic Acid Research, 23: 4407-4414.
White F 1983. The Vegetation of Africa: A Descriptive Memoir to Accompany the UNESCO/AETFAT/UNSO Vegetation Map of Africa by F. White. Natural Resources Research Report XX. Paris, France: UNESCO. WHO (World Health Organisation) 2002. Traditional
Medicine Strategy 2002–2005. From <www.who.int/ medicines/library/trm/trm_strat_eng.pdf> (Retrieved 15 July, 2007).