Western University Western University
Scholarship@Western
Scholarship@Western
Electronic Thesis and Dissertation Repository
10-26-2016 12:00 AM
Energy Subtraction Methods as an Alternative to Conventional
Energy Subtraction Methods as an Alternative to Conventional
X-Ray Angiography
Ray Angiography
Christiane S. Burton
The University of Western Ontario
Supervisor
Ian A. Cunningham
The University of Western Ontario
Graduate Program in Medical Biophysics
A thesis submitted in partial fulfillment of the requirements for the degree in Doctor of Philosophy
© Christiane S. Burton 2016
Follow this and additional works at: https://ir.lib.uwo.ca/etd
Part of the Medical Biophysics Commons, and the Physical Sciences and Mathematics Commons
Recommended Citation Recommended Citation
Burton, Christiane S., "Energy Subtraction Methods as an Alternative to Conventional X-Ray Angiography" (2016). Electronic Thesis and Dissertation Repository. 4213.
https://ir.lib.uwo.ca/etd/4213
This Dissertation/Thesis is brought to you for free and open access by Scholarship@Western. It has been accepted for inclusion in Electronic Thesis and Dissertation Repository by an authorized administrator of
Abstract
Cardiovascular diseases (CVD) are currently the leading cause of death worldwide and
x-ray angiography is used to assess a vast majority of CVD cases. Digital subtraction
an-giography (DSA) is a technique that is widely used to enhance the visibility of small vessels
obscured by background structures by subtracting a mask and contrast image. However,
DSA is generally unsuccessful for imaging the heart due to the motion that occurs between
mask and contrasted images which cause motion artifacts. An alternative approach, known
as dual-energy or energy subtraction angiography (ESA) is one that exploits the iodine
k-edge by acquiring images with a low and high kV in rapid succession. The idea for ESA is
to bring the benefits of DSA to cardiac imaging without motion artifacts. However, it was
concluded in 1970’s that image quality for ESA could not compete with that of DSA, and
the approach was abandoned. We believe that this was due to technical limitations. In our
work we show that conclusions about iodine SNR for ESA were based on limitations of
early technical components that are no longer relevant. The goals of this thesis were to: 1)
develop a theoretical model of iodine SNR that is independent of technology for DSA and
ESA and validate our theory with experiment, and then factor in technical components; 2)
optimize the iodine SNR for ESA based on parameters that a user can control; 3) image
ESA in an anthropomorphic phantom to visualize bone suppression. It is shown that scatter
and read noise were technical components that degraded iodine SNR for ESA in the past
and both can overcome today. It is concluded that, when these conditions are satisfied, ESA
iodine SNR equal to that of DSA for low iodine mass loadings (sufficient for artery sizes)
for the same patient entrance exposure, and therefore may provide alternatives to DSA in
situations where motion artifacts are expected to render a study as non-diagnostic, such as
in coronary applications. In the future this will have important applications for subtraction
Keywords
x-ray angiography, dual energy imaging, energy subtraction imaging, x-ray image quality,
Co-Authorship
This thesis contains material from manuscripts either published or submitted for
pub-lication. Permission to reproduce manuscripts published in Medical Physics (American
Institute of Physics) is included in Appendix .
Chapter 2 is based on an article “Energy subtraction angiography is comparable to
digital subtraction angiography in terms of iodine Rose SNR” by Christiane S. Burton, John
R. Mayo and Ian A. Cunningham that has been accepted for publication in Medical Physics
(in press). I was responsible for study concept, mathematical developments, experimental
design and execution, data simulation, data analysis and interpretation, and manuscript
preparation, all of which was performed under the supervision of I. A. Cunningham.
Chapter 3 is based on the manuscript “Optimizing iodine SNR per root air KERMA for
energy subtraction methods” by Christiane S. Burton, John R. Mayo, and I. A.
Cunning-ham that has been submitted to Medical Physics for consideration for publication. I was
responsible for study concept, mathematical developments, data simulation, data analysis
and interpretation, and preparation of the manuscript, all under the supervision of I. A.
Cunningham.
Chapter 4 is based on the manuscript “Energy-subtraction method in RANDO
anthro-pomorphic phantom” by Christiane S. Burton, John R. Mayo and Ian A. Cunningham that
will be submitted for consideration for publication in Medical Physics. I was responsible
for study concept, mathematical developments, experimental design and execution, data
simulation, data analysis and interpretation, and manuscript preparation, all of which was
Acknowledgements
My greatest acknowledgement is to my supervisor Dr. Ian A. Cunningham for all of his
patience and guidance during my project in helping me develop skills that are necessary to
be a successful scientist. It has been an honour to work with such a brilliant scientist and
mentor. He has inculcated important skills in me such as cogency in my communication
and forward thinking in my research that are required in science and everyday life (even
grocery shopping!). I want to thank him for his patience and helping me to understand what
it means to be a very good scientist. Dr. Cunningham’s continued enthusiasm for asking
important scientific questions in the field of medical imaging is inspiring and has made my
graduate studies an enjoyable and rewarding yet challenging experience.
I would like to thank my advisory committee (in no particular order), Dr. Aaron So, Dr.
George Hajdok, and Dr. Eugene Wong, for their valuable time and for keeping my project
on track and helping me plan and address important scientific questions for my papers and
thesis.
I would like to thank the administrative support of Barb Citton and Wendy Hough from
the Department of Medical Biophysics, and Janice Kroenig from the Imaging
Laborato-ries at Robarts Research Institute. Barb and Wendy provided invaluable guidance
regard-ing submission procedures for graduate scholarship applications and Janice was especially
helpful when it came to filling out expense reports.
I would like to thank the Cunningham group’s laboratory assistant Michael (Mike)
Mc-Donald, MEng. Mike was very helpful in the construction of phantoms, and during our
lab meetings has always provided valuable insight on my research. I would also like to
acknowledge the scientific discussions I have had with Dr Jesse Tanguay, PhD, whom was
very helpful at the beginning of my degree when I was trying to pick up where he left
off. I would like to thank the newest additions to our lab, PhD candidate Tomi Nano and
MSc candidate Terenz whom gave me ideas on how to present my work and who were
I would like to thank Dr Jerry Battista and Dr Robert Stodilka for all of their hard work
in developing the CAMPEP stream in Medical Biophysics. The CAMPEP program would
not be successful without their efforts. I would also like to thank Dr Grace Parraga, the
current chair of the department of Medical Biophysics, for her contribution in developing
the CAMPEP program at Western University and for ensuring that we complete all
re-quirements for our degree on time. I would like to thank Ilma Xhafellari for overseeing
the Quality Assurance program and for all the late Monday nights she pulled with us when
equipment did not to work.
I would like to thank Dr David Holdsworth’s and Dr Maria Drangova’s lab, particularly
Ali Tavalleai, PhD, and Danny Gelman, PhD candidate, for engineering questions, and
Christopher Norley, PhD, for physics questions, and Maria and David for answering any
questions that I had and providing me with suggestions of where my project could go next.
The research presented in this thesis would be impossible without financial support. I
wish to acknowledge the financial support from the Ontario Graduate Scholarship Program,
the Canadian Institute of Health Research Strategic Training Program, and the Western
Graduate Research Scholarship for shaving off half of my exorbitant tuition fee.
I would also like to thank all of my professors and the administrative assistant, Sally
Noce, from my undergraduate school, Ryerson University. Even though I graduated 4 years
ago, they still ensure that I am on track with achieving my career goals.
I would like to acknowledge my peers in the Medical Biophysics and Biomedical
Engi-neering program whom kept me motivated and encouraged and my friendships with people
outside the research lab. I would like to thank the following people (in no particular order)
for showing me a good time: Chelsea, Cristina and Sofia, Claudio and Joel, Sherry,
Christo-pher, Fiona, Julia, Marta, Anastasija, Sonia, Tasha, Harini, Aradhana and Dann, Meaghan,
Cricks, Shahad, Lisa and Frank, Michael and Jordana, and Strechy to name a few. I would
like to thank Owen and Ali for raising the best triplets ever. I also want to thank the PRIDE
Last but not least I would like to thank my family. I would like to thank my younger
sister Michaela Burton whom inspires me everyday and has taught me that I can overcome
obstacles in my life, and that with enough ambition, passion, and hard work, it is possible
to achieve goals that can seem initially overwhelming. I would like to thank my parents
Maureen and Charles Burton for helping me move from one apartment to a cheaper
apart-ment and cheering me on every step of the way. I would like to thank my Auntie Anne
and Uncle Ern for showing me a great time and having a good laugh with over all the road
blocks in life. I would like to thank my Aunt Teresa, Uncle Geoff and cousin Tyler for
being my family during stay in London and being supportive and understanding. Your love
Contents
Abstract i
Co-Authorship Statement iii
Acknowledgements iv
Contents vii
List of Tables x
List of Figures xi
List of Symbols xviii
List of Abbreviations xx
1 Introduction 1
1.1 Prevalence and forms of cardiovascular diseases (CVD) . . . 1
1.1.1 Coronary Artery Disease . . . 2
1.1.2 Other forms of CVD . . . 2
1.1.3 History of diagnostic techniques for CVD . . . 2
1.1.3.1 Electrocardiogram limitation . . . 3
1.1.3.2 X-ray imaging . . . 3
1.2 Cardiac catheterization . . . 4
1.2.1 Conventional angiography . . . 5
1.2.2 Necessity for subtraction methods for angiography . . . 6
1.2.2.1 Digital subtraction angiography . . . 6
1.2.2.2 Problem with digital subtraction angiography . . . 7
1.2.3 The need for energy-dependent angiography . . . 7
1.2.3.1 Introduction to dual-energy subtraction angiography . . . 7
1.2.3.2 K-edge subtraction . . . 8
1.2.3.3 Triple-energy subtraction angiography . . . 9
1.2.3.4 Dual-energy . . . 10
1.2.3.5 Approaches to dual-energy . . . 11
1.2.3.6 Limitations of early dual-energy studies . . . 12
1.2.3.7 Current state of dual-energy subtraction angiography . . 13
1.3 Research problem . . . 13
1.3.1 Research objectives . . . 14
1.4 Thesis outline . . . 15
1.4.1 Chapter 2: Energy subtraction angiography can compete with dig-ital subtraction angiography in terms of iodine Rose SNR . . . 15
1.4.2 Chapter 3: Optimizing iodine SNR per root air KERMA for energy-subtraction methods . . . 16
1.4.3 Chapter 4: Residual bone signal for dual-energy subtraction an-giography . . . 18
1.4.4 Goals and objectives . . . 20
1.5 References . . . 20
2.2 Theory . . . 41
2.2.1 Rose SNR . . . 41
2.2.2 Rose SNR/√KERMA . . . 43
2.2.2.1 DSA Rose SNR . . . 45
2.2.2.2 ESA Rose SNR . . . 46
2.2.3 Patient Entrance Air KERMA . . . 48
2.3 Methods and materials . . . 48
2.4 Results . . . 52
2.4.1 Experimental validation of Rose SNR model . . . 52
2.4.2 Acceptable detector quantum efficiency . . . 52
2.4.3 Acceptable detector readout noise . . . 55
2.4.4 Acceptable scatter . . . 55
2.5 Discussion . . . 56
2.6 Conclusions . . . 58
2.7 Acknowledgements . . . 59
2.8 References . . . 60
3 Optimizing iodine SNR per root air KERMA for energy subtraction methods 64 3.1 Introduction . . . 64
3.2 Theory . . . 67
3.2.1 Optimal mAs ratio . . . 68
3.2.1.1 Rose Model . . . 71
3.2.1.2 Sum of Variances . . . 71
3.2.2 Heat units . . . 73
3.2.3 Detector type . . . 73
3.3 Methods and materials . . . 73
3.4 Results . . . 75
3.5 Discussion . . . 82
3.6 Conclusion . . . 83
3.7 Acknowledgements . . . 84
3.8 References . . . 84
4 Energy-subtraction method in RANDO anthropomorphic phantom 89 4.1 Introduction . . . 90
4.2 Theory . . . 91
4.3 Methods and Materials . . . 92
4.4 Results . . . 94
4.5 Discussion . . . 96
4.6 Conclusion . . . 98
4.7 References . . . 99
5 Conclusions 105 6 Future Work with Preliminary Results 109 6.1 Implementation of fast kV-switching x-ray system . . . 109
6.1.1 Solenoid system and filter design . . . 109
6.1.2 Spinning disk system and filter design . . . 112
6.1.3 Future filter design and experiment setup . . . 119
6.2 Gadolinium as an ESA Contrast Agent . . . 120
6.2.1 Results . . . 121
6.2.2 Conclusion . . . 125
6.3 References . . . 125
List of Tables
2.1 Exposure techniques used in an experimental comparison of DSA and ESA.
The phantom KERMA was measured with the phantom removed and does
not include scatter. The detector KERMA was measured with a large air
gap and does not include scatter. . . 49
3.1 Summary of parameters affecting iodine SNR and patient exposure in
dual-energy imaging. Only dependent parameters can be optimized on an
indi-vidual patient basis. . . 68
3.2 Density of elements that are used in detectors . . . 73
3.3 The kV and mAs combination used to calculate heat units for ESA and
DSA exposures with the same Rose FOM. . . 81
6.1 Specifications for copper . . . 119
List of Figures
1.1.1 Attenuation properties of materials. Mass attenuation coefficients of
io-dine, calcium, bone, water, and gadolinium. . . 4
1.2.1 a) Mask image (left), b) DSA (center), c) and DSA with motion artifacts
(right). Figure demonstrates how DSA images can be compromised by
pa-tient motion between mask and contrast images. (Permission to use images,
image a) taken from reference [10] copyright line © 2008 IEEE, image b)
taken from reference [10] copyright line © 2008 IEEE, and image c) taken
from reference [10] copyright line © 2008 IEEE). . . 6
1.2.2 DSA (left) and ESA (right) images of an IV injection of the heart acquired
in the 1990’s. (Image taken from Ref. [135] Permission to reproduce is in
Appendix.) . . . 8
2.2.1 Schematic illustration of iodine-filled step-wedge immersed in 20 cm of
water with incident quantaqo, transmitted quantaqWandqIin non-iodinated
and iodinated regions, respectively, and scattered quantaqS. Corresponding
average binned pixel values aredWanddI. . . 43
2.2.2 Average energy absorbed in binned pixel per interacting photon,Ea(E) =
(Eab(E) +E)/2 whereEab is the tabulated absorbed energy.[161] . . . 44
2.3.1 Energy spectra of x-ray photons interacting in detector used for DSA and
ESA calculations (20-cm water, 0.01-g cm-2 iodine, 0.5-mm CsI)
2.3.2 The quantum-limit exposure is the detector exposure at which readout noise
variance (horizontal line) and quantum noise variance (sloped line with
data points) intersect. Quantum noise was estimated as measured noise
mi-nus readout noise. By changing the mAs setting, it was determined to be
approximately 0.0016 µGy at 80 kV as illustrated, although this
determi-nation was rather imprecise due to difficulties in achieving a sufficiently
low detector exposure without substantial changes in spectral shape from
additional filtration. . . 50
2.3.3 Average of measured ratio of summed discrete auto-covariance ∑Kd to
varianceσR2of binned pixels as a function of number of pixels binned in a
square ROI. . . 51
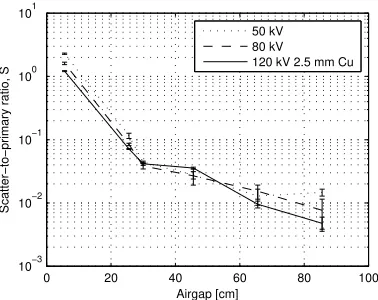
2.3.4 Measured scatter-to-primary ratio as a function of air gap for 50, 80, and
120 kV spectra. . . 52
2.4.1 DSA and ESA images of iodinated step wedge immersed in 20 cm of water
with 0.024, 0.096, 0.22, 0.29, and 0.36 g cm−2 of iodine for total patient
entrance exposures of 331 and 293µGy, respectively. . . 53
2.4.2 Comparison of theoretical (lines) of DSA and ESA iodine SNR per root
patient air KERMA with experiment (points). . . 53
2.4.3 Theoretical calculation of iodine SNR per root patient air KERMA as a
function of detector CsI thickness (0.1 g/cm2iodine, no scatter, no readout
noise). . . 54
2.4.4 Theoretical calculation of iodine SNR per root detector air KERMA as
a function of detector read noise expressed as the detector quantum-limit
exposure at 50 keV (no scatter, 0.3 mm CsI). . . 54
2.4.5 Theoretical calculation of acceptable scatter-to-primary ratio as a function
of iodine mass loading for iodine signal and variance (0.3 mm CsI, no
3.2.1 Schematic illustration of iodine-filled step-wedge immersed in 20 cm of
water with incident quantaq0, transmitted quantaqWandqIin non-iodinated
and iodinated regions, respectively. Corresponding average binned pixel
values aredWanddI. . . 69
3.3.1 Plot showing theoretical (line) polyenergetic Rose (left) and SOV (right)
calculations for iodine SNR/√K (no scatter, no read noise) as a
func-tion of mAs ratio with corresponding experimental validafunc-tion (points) for
water thicknesses of 20 cm for a fixed high kV of 120 kV with 2.5 mm
copper filtration and low kV of 50, 60, and 70 kV, for iodine mass loading
0.048 (upper) and 0.24 g cm-2(lower). The bold line segments show iodine
SNR/√K values that are within 10% of the optimal iodine SNR/√K . . 74
3.4.1 Optimal mAs ratio as a function of low kV that produces a maximum FOM
(SNR/√K ) for Rose (left) and SOV (right) methods using iodine mass
loadings of 0.048 g cm-2(upper) and 0.24 g cm-2 (lower). The dashed line
gives a near-optimal mAs ratio that is within 10% of the peak FOM at a
low-kV setting of both 50 and 60 kV. The two solid lines bound a range in
mAs ratio values in which the FOM is within 10% of the peak FOM for 50,
60 and 70 kV. . . 75
3.4.2 Contour plots showing polyenergetic calculations for Rose (left column)
and SOV (right column) iodine SNR/√K as a function of water thickness
(cm) and mAs ratio using low kV values of 50, 60, and 70 kV for iodine
mass loading of 0.048 g cm-2with lines of best fits through optimal iodine
3.4.3 Contour plots showing monoenergetic calculations for Rose (left column)
and SOV (right column) iodine SNR/√K as a function of water
thick-ness (cm) and mAs ratio using low kV of 50, 60, and 70 kV for iodine
mass loading of 0.048 g cm-2with lines of best fits through optimal iodine
SNR/√K values and values that is 10% to that of optimal iodine SNR/√K . 78
3.4.4 Comparion lines of best fits through optimal iodine SNR/√K values and
values that is 10% to that of optimal iodine SNR/√K between
polyener-getic and monoenerpolyener-getic calculations. . . 79
3.4.5 Theoretical polyenergetic iodine SNR/√K as a function of mAs ratio for
CsI, Se and Gd2O2S detector converter materials for an iodine mass loading
of 0.048 g cm-2 for 20 cm of water for a fixed high kV (120 kV) and low
kV of 50 and 60 kV. . . 80
3.4.6 Optimal mAs ratio as a function of water thickness for low kVs of 50, 60,
and 70 kV with fixed high kVp of 120 kV with 2.5 mm copper filtration for
monoenergetic spectra. . . 81
4.3.1 Phantom setup with DEXA wedge material. Iodine stepwedge not shown. . 93
4.3.2 RANDO anthropomorphic phantom setup with DEXA wedge material.
Io-dine stepwedge not shown. . . 93
4.4.1 Transmission of DEXA wedge as a function of DEXA wedge thickness
(left). . . 94
4.4.2 ESA signal as a function of the iodine mass loading using water weighted
and DEXA material weighted with 0 bone thickness. . . 95
4.4.3 Images showing DEXA stepwedge superimposed on iodine stepwedge for
optimal soft-tissue cancellation (top) and thin DEXA wedge cancellation
4.4.4 a) Conventional single-kV (80 kV) contrast image of RANDO
anthropo-morphic phantom and thin slab of water containing iodine-filled tubing.
b)...f) ESA images at 60/120 kV with 2.5 mm copper for 120 kV using
dif-ferent weighting factors. The optimal weight appears to be approximately
0.55. . . 97
6.1.1 X-ray system design and setup showing the connection between different components and type of connection between . . . 110
6.1.2 Timing diagram for solenoid filter design . . . 111
6.1.3 Solenoid filter design (top) top view and (bottom) front view. . . 111
6.1.4 Timing diagram for system design . . . 113
6.1.5 Timing diagram for filter design . . . 113
6.1.6 Sideview and topview of filter design for spinning disk. . . 114
6.1.7 Schematic illustration of iodine-filled step-wedge immersed in 20 cm of water with an incident spectrumqeo[quanta mm-2], and interacting spectra e qW andqeI, and pixel values deW anddeI, in water and iodinated regions of the image respectively. . . 118
6.2.1 Mass attenuation coefficients . . . 121
6.2.2 GadoliniumSNR/√Kas a function of low kV for a gadolinium mass load-ing of 0.048 g cm-2for a fixed high kV of 120 kV. . . 122
6.2.3 Gadolinium SNR as a function of mAs ratio (low/high) . . . 122
6.2.4 Energy spectra of x-ray photons interacting in detector used for ESA cal-culations (0.5-mm CsI, 20-cm water, 150-cm source-image distance). with low and high-kV spectra (50 and 120 kV, 20 mAs each, 2.5 mm Cu high-kV filter). . . 123
6.2.5 Plot showing the iodine and gadolinium SNR as a function of mass loading 123 6.2.6 Image of gadolinium-filled stepwedge with uniform background . . . 124
6.2.8 Dual-energy images of gadolinium-filled stepwedge each next to a cylinder
of calcium with a 3 cm radius with soft-tissue removal (left) and
List of Symbols
In the following, overhead ˜ indicates a random variable, superscript † indicates a
sam-pled detector signal consisting of a uniformly spaced distribution ofδ-functions scaled by
element signals, and RPP indicates a random point process consisting of a spatial
distribu-tion of randomly posidistribu-tionedδ-functions in the image plane.
Symbol Definition
qo,qb mean numbers of quanta per unit area[mm−2](image brightness) in
object and background regions, respectively
A areaof pixel
C object contrast (relative incremental change in scene brightness),
(qo−qb)/qb
Nb mean number of background quanta measured in areaA
σNb standard deviation in the number of background quanta measured in
areaA
dI ,dW uncorrelated pixels with mean values in iodinated and non-iodinated
regions
σdW
NA×NA number of pixels in binned pixel
Kd[∆] discrete auto-covariance function,∆6=0 only for uncorrelated pixels
R(NA) Ratio of auto-covariance function
qS number of scatteredquanta per unit area[mm−2]
k constant of proportionality [keV-1]
α detector quantum efficiency
Ea average energy absorbed in the binned pixel with each interaction
σR2 detector additive readout noise
DW,DI binned pixel values in iodinated and non-iodinated regions of a
log-subtracted image
∆DD,4DE difference between binned pixel values for DSA, ESA
m,c identify mask and contrast images for DSA
TI iodine transmission
σ∆2D
D,σ 2
∆DE obtained by differentiating∆DD,4DEwith respect todw
σc2 Pixel variance in photon-counting image.
l,h low and high kV spectra
w ratio between mass attenuation coefficients of water at effective
energiesElandEh
Kq Patient entrance air KERMA [µGy]
µen
List of Abbreviations
Symbol Definition
CVD Cardiovascular Diseases
CAD Coronary Artery Disease
ECG Electrocardiograph
DSA Digital Subtraction Angiography
ESA Energy Subtraction Angiography
ERA Energy Resolving Angiography
SNR Signal-to-Noise Ratio
FOM Figure-of-Merit
SOV Sum of Variance
CsI Cesium Iodide
Se Selenium
Gd2O2S Gadolinium(III) Oxisulphide
CMOS Complementary Metal-Oxide Semiconductor
kV kilovoltage
mAs product of current (mA) and exposure time (s)
DQE Detector Quantum Efficiency
air
KERMA
“Kinetic Energy Released per unit MAss in air”, defined as the sum of
the initial kinetic energies of all the charged particles liberated by
uncharged ionizing radiation (i.e., indirectly ionizing radiation such as
photons and neutrons) in a sample of matter, divided by the mass of the
sample
DEXA Dual-Energy X-ray Absorptiometry
DI Detectability Index
ROC Receiver Operating Characteristic
Chapter 1
Introduction
1.1
Prevalence and forms of cardiovascular diseases (CVD)
According to the World Health Organization (WHO) cardiovascular diseases (CVDs) are
currently the leading cause of mortality worldwide.[3] In 2011, Statistics Canada reported
that the leading cause of death and acute care hospitalizations in Canada were CVDs,
ac-counting for 30% of all deaths and 3 million hospitalizations.[15] In 2012, the organization
estimated that 17.5 million people died of CVD, representing 31% of all global deaths.[145]
In 2015, the Heart and Stroke Foundation reported that heart disease is the leading cause of
death and disability in Canada, responsible for approximately 66,000 deaths each year.[39]
Cardiovascular disease is any disease involving blood vessels and all of these diseases
involve atherosclerosis which is defined as the incomplete or complete blockage of blood
vessels.[7] The etiology of atherosclerosis is described as the narrowing of the inner surface
of an artery that is caused mainly by cholesterol uptake of white blood cells that accumulate
along the inside of the vessel wall.[8] Examples of prevalent forms of CVDs resulting from
atherosclerosis are coronary artery stenosis, carotid artery stenosis and cerebral aneurysms,
acute limb ischaemia and pulmonary embolisms, and arteriovenous malformations (AVM)
1.1.1
Coronary Artery Disease
In 2013 coronary artery disease (CAD) was the leading cause of death of all the CVDs.[92]
Coronary artery disease develops when atherosclerosis occurs in the major blood vessels
(coronary/epicardial arteries) that supply blood, oxygen and nutrients to the myocardium
of the heart become damaged or diseased and may result in heart attacks and chest pain.
1.1.2
Other forms of CVD
WHO describes many other forms of CVD depending on the location the blood vessels
are supplying. For example, cerebrovascular disease results from atherosclerosis in the
carotid arteries leading to the head area and peripheral disease results from stenosis in
blood vessels supplying the arms and legs. Another example is a pulmonary embolism
(PE) is a blockage in one of the pulmonary arteries of the lungs which may be caused
by a blood clot, fat globule, gas bubble or foreign material that travels to the lung from a
blood vessel in the leg. In the case of PE not only does atherosclerosis impede the amount
of blood traveling from the heart to the lungs, it causes increased pressure to the right
ventricle thereby increasing blood pressure. The embolisms that originate from either the
heart and pelvic region travel towards arteries in the leg, thigh, and lower limbs and cause
acute limb ischaemia. Renal artery stenosis is caused by atherosclerosis that impedes blood
flow to the target kidney in turn causing high blood pressure and atrophy of the affected
kidney. CVD in any location can result in high blood pressure and has considerable impact
on human health.
1.1.3
History of diagnostic techniques for CVD
CVD can affect an individual’s health in many ways, therefore diagnostic images need to
provide information on the location and severity of arterial narrowings (stenosis) for an
1.1.3.1 Electrocardiogram limitation
Studies by Waller[141] in 1887 led to Einthoven inventing a string galvanometer. By
hook-ing the galvanometer up to a patient and measurhook-ing various types of deflections[48] the
electrocardiograph features could be used to describe and distinguish, and therefore
diag-nose, various cardiovascular diseases.[106] Today electrocardiography (ECG) is a device
that detects electrical changes on the skin that arise from the myocardium depolarizing
during each heartbeat.[72, 142] ECG is a commonly used diagnostic tool because it is
sim-ple to use, cost effective, and capable of diagnosing a diverse number of heart conditions.
However, a major limitation of ECG is not having information on the specific location and
severity of the artery narrowing.
A discovery in the 1890’s would change that.
1.1.3.2 X-ray imaging
In 1895 Willhelm Roentgen discovered the production and detection of electromagnetic
radiation in a wavelength range known as x-rays. He demonstrated this by taking an x-ray
image of his wife’s hand using film and even though the image appeared to be grainy there
was contrast between the bones in her fingers, her ring and the background. There was a
small group that picked up on x-ray imaging and noticed that blood vessels did not show up
in the radiography image, and a year later they demonstrated that contrast could be created
with use of a radio-opaque agent.
1.1.3.3 Contrast agents
In 1896, Haschek and Lindenthal were the very first group to demonstrate that vasculature
could be seen in a radio graphic image by injecting calcium carbonate into cadavers.[1]
Although this was an exciting discovery, they reported that calcium carbonate would not
work in living beings. It was discovered later, in the 1920s, by Sicard and Forestier[115]
Photon Energy [keV]
0 50 100 150
Mass attenuation coefficient [cm
2 g - 1]
10-1 100 101 102 103
Iodine Gadolinium Calcium Bone Water
Figure 1.1.1: Attenuation properties of materials. Mass attenuation coefficients of iodine, calcium, bone, water, and gadolinium.
iodine has remained the most commonly used contrast agent in x-ray angiography.[28, 42,
43, 69, 70] The advantage of iodine over calcium carbonate is a K-edge at approximately
33.9 keV where the probability of photoelectric effect increases by a factor of 5, shown
in Fig. 1.1.1. Iodine-based contrast agents were not used for imaging coronary arteries
specifically until cardiac catheters were developed that would allow for selective injection
of a contrast agent into the coronary arteries.
1.2
Cardiac catheterization
The concept of catheterization (without contrast injection) actually began in the early
1700’s when Stephen Hales placed a long, thin, flexible tube, into the right and left
ventri-cles of a live horse with the purpose of understanding the vascular system.[93] Variations
on the technique were performed over the subsequent century until the 1840s when Claude
1927, not long after Sicard and Forestier demonstrated that iodine-based contrast agents
can be used in live humans.[115] Around the same time, Dr Moniz for the first time used a
catheter to inject iodine into vessels of the brain and imaged the head using x-rays, a method
know today as cerebral angiography.[11] In 1929 Dr Werner Forssmann reported that he
created an incision in one of his left antecubital veins and inserted a catheter into his
ve-nous system and then guided the catheter into his right atrium by taking many x-ray images
to see inside his body.[29] In 1958 Dr Charles Dotter developed aortic root aortography
where he would guide a catheter towards the aortic root and radiography contrast agent to
visualize the coronary arteries very well.[25] He performed this procedure using animal
models and reported that all animals survived afterwards. Mason Sones performed aortic
root aortography later that year and reported that he had accidentally inserted a catheter into
the patient’s right coronary artery as the patient went into ventricular fibrillation and this
resulted in the first known example of selective coronary arteriogram. The patient survived
this procedure and it showed that contrast agent injected into the coronary artery was not
fatal as was previously thought.[118]
1.2.1
Conventional angiography
In the early 1960s, angiography was emerging as a diagnostic procedure used for imaging
patients that are candidates for having CVD. The purpose of performing angiography is to
obtain an image with information on the location and severity of arterial stenosis. X-ray
radiography is the most common imaging modality used for angiography[13, 62, 81, 23, 58]
despite advances in other modalities such as intravenous ultrasound, CT, and MRI.[73,
123, 108] The advantage of using radiographs for angiography is that the images give a
complete description of the stenosis with image resolution on the order of 0.1 mm.[126]
However, the problem with angiography images is that in order to clearly see contrast
between iodine-filled blood vessels from light and dark background structures such as lung
a) b) c)
Figure 1.2.1: a) Mask image (left), b) DSA (center), c) and DSA with motion artifacts (right). Figure demonstrates how DSA images can be compromised by patient motion be-tween mask and contrast images. (Permission to use images, image a) taken from reference [10] copyright line © 2008 IEEE, image b) taken from reference [10] copyright line © 2008 IEEE, and image c) taken from reference [10] copyright line © 2008 IEEE).
of iodine.
1.2.2
Necessity for subtraction methods for angiography
1.2.2.1 Digital subtraction angiography
Digital subtraction angiography (DSA) was discovered in the 1970’s as a way of removing
overlying bone, lung fields, and soft-tissue to produce iodine-specific images.[86, 4] A
series of images of the anatomy (mask image) are acquired and subtracted from a series
of images acquired after administration of iodine (contrast image) for the same region of
interest. DSA can provide a clear image of the blood vessels where fig. 1.2.1 shows a
single mask image, a DSA image with motion artifacts removed using motion correction,
and DSA image with motion artifacts. DSA is primarily used for imaging arterial and
venous occlusions, including carotid artery stenosis, pulmonary embolisms (pulmonary
angiography) and acute limb ischaemia, renal artery stenosis, and cerebral aneurysms and
arteriovenous malformations (AVM).[41, 98] The technique has been successfully used
for mapping cerebral blood flow, detecting obstructions and lesions in the carotid arteries,
and is also used for assessing patients prior to surgery and after coronary artery bypass
[65, 41] and it is therefore the reference technique that will be used when comparing new
methods.[99]
1.2.2.2 Problem with digital subtraction angiography
The problem with DSA is that any motion that occurs in the several seconds between mask
and contrast image acquisitions gives rise to motion artifacts, shown as light and dark
regions, in the image and can render a study non-diagnostic.[78] Although software tools
are available to assist with image registration for in-plane translation [139, 138, 140, 71,
137, 40, 147, 78, 10, 94] or rotation motions,[139, 138, 140, 71, 137, 260, 20, 40, 147,
78, 10, 94] cardiac and respiratory motion, swallowing after injection (carotid arteries),
uncooperative patients, bowel and other involuntary motion remain the primary cause of
failed image quality.[13, 17, 128] It is the need for a mask image that compromises image
quality for DSA.[124]
1.2.3
The need for energy-dependent angiography
1.2.3.1 Introduction to dual-energy subtraction angiography
In 1953 Jacobson first attempted dual-energy subtraction using dichromatic absorption
radiography.[49] Iodine-specific images were obtained by acquiring two images with low
and high energies to exploit the K-edge discontinuity of the iodine mass attenuation coefficient.[4]
This dual-energy subtraction concept developed throughout the late 1970’s with notable
studies by Mistretta,[86, 85, 84, 80, 81, 83, 87, 82] Kelcz,[59, 60] and other colleagues at
the University of Wisconsin. Dual-energy was proposed as an alternative method to DSA
for vascular imaging because it eliminated the need for a mask image.[86, 59, 105, 63, 46,
4] The idea was to implement a fast kV-switching generator to acquire low and high-kV
im-ages in rapid succession thereby making dual-energy angiography less sensitive to motion
Figure 1.2.2: DSA (left) and ESA (right) images of an IV injection of the heart acquired in the 1990’s. (Image taken from Ref. [135] Permission to reproduce is in Appendix.)
cardiac images published by Molloi and Mistretta[90] and Van Lysel[134, 135, 132, 136,
133] were exciting and demonstrated excellent insensitivity to motion artifacts. However,
clinical implementation of energy subtraction was not generally adopted and showed less
image quality in comparison to non-subtracted cardiac angiography. Fig 1.2.2 shows a
dual-energy image of a dog’s heart with the use of gating.
There are three well-known methods for energy-based subtraction described K-edge
subtraction, [148, 86, 46, 13, 59, 60] triple-energy,[146, 59, 60, 107] and dual-energy.[121,
31, 66, 9, 30, 95, 114, 5, 13, 46, 37, 64, 4, 38, 74, 91, 90] each with their own benefits and
limitations discussed in the next sub-sections.
1.2.3.2 K-edge subtraction
Jacobson[49] used x-ray sources with secondary radiation[18] to generate monoenergetic
x-ray beams with energies that were below and above the iodine k-edge. However despite
the ability to quantify iodine concentrations these secondary radiator sources were
gen-erally limited by low x-ray intensity and were not widely accepted as imaging tools.[84]
Atkins et al. and Kramer et al. used solid state detectors for analyzing the energy of each
photon forming the image produced by a conventional x-ray generator. Mistretta et al.[84]
that higher quality images can be obtained in shorter times. However these energy analyses
for each photon is time consuming and not practical.
In 1979 Houk et al.[46] demonstrated the method described by Mistretta in the left and
right ventricles of a dog with minimal motion artifacts. Like Mistretta, Houk found that to
generate quasi-monoenergetic beams in the clinic is impractical because it requires heavy
filtration of low kV x-ray spectra and the very low number of photons at the kV of the x-ray
spectra.[86, 46] The spectral width decreases with increasing filter thickness, however the
number of photons decreases too, therefore the exposure time needs to increase in order to
accumulate more photons. The number of photons used to generate a K-edge subtracted
image can be a factor of 55-60 lower than DSA.[13]
In 1997 Zhong et al.[148] used emissions from barium and cerium targets and were
successful at imaging stationary objects. However this method was not successful for
imaging coronary arteries because of the time required to generate sufficient x-ray
ex-posure levels. The limited number of photons often resulted in incomplete soft-tissue
and bone suppression and also reduced iodine signal-to-noise ratio (SNR) compared to
DSA.[84, 59, 60, 13, 12] This limits K-edge subtraction to imaging areas where the x-ray
beam is projected through a relatively short path.
The problem of soft-tissue and bone suppression was later addressed and a triple energy
method was proposed.
1.2.3.3 Triple-energy subtraction angiography
The goal of the triple-energy approach is to suppress both soft-tissue and bone from
an-giographic images by subtracting three images acquired with x-ray spectra each having
different mean energies. Kelcz et al.[59] used a triple-energy approach using three filters
and three kV to reduce pixel-intensity variations caused by residual soft-tissue and bone
variations. However the required filters need to be thick so that the spectra do not
filtered with iodine, cerium, and lead, respectively. While their approach suppressed
soft-tissue and bone, the iodine-specific images suffered from severely reduced SNR due to
power limitations of x-ray tubes. There were so few photons reaching the x-ray detector
that iodine-specific images were severely compromised by noise associated with detector
electronics, and the method suffered from other limitations including increase in patient
dose, exposure time, and anode heat units.
As the concept of energy-based subtraction evolved, dual-energy approach became a
focus of investigation.
1.2.3.4 Dual-energy
The goal of dual-energy approach is to suppress either soft-tissue or bone from
angio-graphic images by subtracting of two images acquired with x-ray spectra having different
mean energies. This is most commonly performed using applied tube voltages of 50-70
kV and 120-130 kV for low and high kV spectra, respectively, with 2-2.5 mm of copper
filtration on the high kV spectrum.[37, 38, 134, 90, 91, 132, 133, 136, 88] This approach
aims to suppress soft-tissue structures because they are the primary surrounding tissue that
move like the heart, for example. Since bone is not fully suppressed in these images,
early investigators subtracted pre-injection energy images from post-injection
dual-energy images to remove overlying bone structures, similar to DSA.[37, 38, 135, 132]
Guthaner et al[37, 38] demonstrated that in cooperative patients this approach combines
the benefits of bone suppression offered by DSA. Molloi et al[90] who used a dual-energy
approach to quantify canine coronary arteries and, while bone was not fully suppressed
from images, soft-tissue suppression resulted in superior iodine visualization compared to
non-subtraction approaches. Also similar approaches have been useful in quantifying
left-ventricular ejection fraction.[91, 135] Dual-energy approaches use much thinner filters than
K-edge subtraction and three material compositions, however these early studies suffered
Early investigators used image intensifiers with video cameras.[74, 133, 143, 104, 101,
103] While these technologies were widely used for DSA, they suffered from veiling glare
and other limitations that compromised the low-noise linear response required for
dual-energy imaging.[111, 112] Even with the introduction of early flat-panel detectors,[258, 5,
104, 113, 27, 26, 109, 103, 100, 6, 124] Molloi et al.[26] showed only modest
improve-ments in dual energy image quality.
1.2.3.5 Approaches to dual-energy
Three approaches to dual-energy imaging have been developed and reported over the years.[114,
5] The first method described requires a single kVp and dual-filtering at the source to
generate two different beams, one with mean energy directed towards the kV peak and
the other with a mean energy above the k-edge energy of the contrast agent.[114] This
approach was not widely accepted because of poor separation of low and high energy
spectra. The second approach is one that uses a single exposure where two radiation
detectors that have different energy sensitivities separated by a filter are “sandwiched”
together . The advantage of this approach is that patient motion misregistration
arti-facts are reduced and it is therefore a preferred method for detecting small calcified
le-sions in the lung in chest radiography.[9, 95, 30, 121, 31, 66] However, as with the first
method, poor separation of energy spectra results in a grainy image. The third approach
requires an x-ray generator to switch between two kilovoltages to produce low and high
kV image exposures that are acquired within milliseconds of each other.[114] Despite
technical complexity, the rapid kV value change seems to be a viable approach to
im-plementing the dual kV technique for dual-energy subtraction imaging without motion
artifacts.[4, 46, 13, 64, 37] Shaw et al[114] compared all three approaches and concluded
that two separate kV and mAs exposures acquired a few milliseconds apart has better
spec-tral separation between low and high kV acquisitions and therefore less noise compared to
is not trivial. There are other problems that occur generally in a radiography setting with
scatter,[76, 14, 54, 32, 55, 131, 116, 50, 68, 77, 149] beam hardening,[75, 76, 14] and read
noise.
1.2.3.6 Limitations of early dual-energy studies
Early dual-energy studies had severely reduced SNR compared to DSA and non-subtraction
approaches [83, 37, 38, 135, 132, 133, 136, 88] due to the combination of inefficient
pro-duction of low-energy x-ray spectra and altering of high-energy spectra. In addition, early
dual-energy studies were carried out using an image-intensifier-television system that
con-vert x-ray energy to photons with wavelengths in the visible range in combination with
a video camera used to detect visible photons. The image-intensifier-television system
was limited by veiling glare[111, 112] and detector non-uniformities across the field of
view.[16, 34] Cameras used in many of these systems reportedly suffered from substantial
read-out lag that decreased the dual-energy iodine signal by 30-50% in some studies.[86,
87, 132, 88] Read-out lag, however, has minimal affect on DSA image signal because
mask and contrast exposures are acquired many seconds apart. New flat-panel detectors
which have emerged in the past few years do not have these limitations and also provide
other advantages not found in image-intensifier-television systems. Namely, they provide
high detector quantum efficiency (DQE) and a wider dynamic range.[119] However, one
of the remaining limitations of energy subtraction is the increased stochastic noise in the
subtracted image. Approaches to reduce dual-energy image noise have been previously
re-ported which use post-processing on the digitally acquired images.[52, 56, 74, 133, 44, 143]
These approaches work independent of the hardware used for image acquisition.
Com-plementary improvements in hardware design and technology also serve to improve
im-age quality. Past studies of dynamic dual-energy imaging have made use of x-ray imim-age
intensifiers.[89, 90, 132, 133] Advances in detector technology have seen the introduction
dy-namic range. Molloi et al.[26] compared the dual-energy image quality using a current
x-ray image intensifier and a digital flat-panel detector, and found that image quality was
similar for the same patient exposure.
1.2.3.7 Current state of dual-energy subtraction angiography
Early dual-energy studies used technology of the time and it is therefore unclear whether
re-duced image quality was a result of technological limitations or of the fundamental physics.
X-ray source and detector technologies have improved substantially over the past three
decades and the limitations described above may no longer apply. This suggests that it
may be the right time to revisit dual-energy with a focus on the image quality that can be
achieved for a given radiation dose to the patient and how this compares to DSA and would
it be less insensitive to motion artifacts.
1.3
Research problem
There is reason to believe that dual-energy methods, called energy-subtraction
angiogra-phy (ESA), can compete directly with DSA to produce high-quality angiographic images
for the same patient dose. For example, Tanguay et al.[124] compared image quality
be-tween DSA, ESA, and energy-resolving angiography (ERA) using a theoretical model that
was validated using a Monte-Carlo simulation for the application of photon-counting
meth-ods. They concluded that ESA and ERA (using photon-counting detectors with x-ray
spec-troscopy capabilities) could produce comparable image quality in terms of the iodine SNR
compared to DSA at low iodine concentrations. However, those calculations considered
only the fundamental SNR as determined by the physics of x-ray interactions, and were not
validated by experiment. These issues lead to the following research questions:
1. What limited ESA in the past? Was it a physical or technical limitation? If it is a
2. Can we use physical parameters to optimize image quality in terms of iodine
signal-to-noise ratio for ESA and how does it compare with DSA for the same radiation exposure
and iodine mass loading?
3. Can we demonstrate that ESA works in an anthropomorphic phantom? Is the
phan-tom a good representation of a patient?
The questions posed are important because they indicate how much research effort
should be invested in developing ESA systems for applications in cardiac imaging.
Answer-ing these questions requires a thorough understandAnswer-ing of image formation and
material-specific imaging and how various technical and physical processes affect ESA image
qual-ity. It will also require understanding of engineering behind the design and implementation
of ESA in real-time.
1.3.1
Research objectives
1. To understand iodine signal and noise we will start our investigation by developing a
theoretical model to come up with a metric of comparison of iodine SNR using the Rose
model between DSA and ESA. We use the Rose model because it describes the minimal
SNR required for visual detection of a uniform low-contrast object of area A in a uniform
background with stationary noise and it only apply to a phantom with uniform background.
We also apply the Rose model to higher concentrations to include signal from thicker
io-dinated structures such as 1 mm arteries. To check if we did the math correctly, we will
validate our theoretical calculations for iodine signal-to-noise ratio for images obtained for
DSA and ESA. We can use our theoretical model to compare technical parameters that may
have affected ESA in the past.
2. To give a complete description and comparison of visual iodine detection for ESA
and DSAwe will extend our Rose model to include noise from iodine in DSA and ESA
images (Sum of Variances). We will use both the Rose and SOV theoretical models to
such as the kVp and the mAs.. We will use a monoenergetic approximation of the iodine
SNR to optimize it in terms of the ratio of number of incident photons and relate it to the
mAs ratio for our polyenergetic calculation.
3. We will show how well ESA is able to suppress bone in an anthropomorphic phantom
(RANDO and DEXA wedges) while preserving iodine signal.
1.4
Thesis outline
The goal of this thesis is addressed in a series of 3 papers (Chapters 2 to 4) that have either
been published, submitted for publication, or have been prepared for publication.
1.4.1
Chapter 2: Energy subtraction angiography can compete with
digital subtraction angiography in terms of iodine Rose SNR
It is unclear why image quality for ESA was relatively poor compared to DSA in the past
despite investigations into image quality of ESA for computed tomography and
mammog-raphy, and radiography. It is therefore unknown whether dual-energy will generate
iodine-specific images with similar image quality relative to DSA for similar patient entrance
exposures with current technology that is available. It is difficult to compare both methods
without understanding the fundamental iodine signal and noise properties.
Chapter 2 describes a theoretical framework for characterizing image quality and
form-ing a metric of comparison between ESA and DSA. We validated our model by experiment
where ESA and DSA images of a vascular phantom were acquired using an x-ray system
with a flat panel CsI Xmaru1215CF-MPTM (Rayence Co., Ltd., Republic of Korea)
detec-tor. For ESA low and high applied tube voltages of 50 kVp and 120 kVp (2.5 mm-Cu),
respectively, and for DSA mask and contrast images the applied tube voltage was 80 kVp.
Using iodine-specific images of a stepwedge the iodine signal-to-noise ratio (SNR) per
loading for both ESA and DSA.
We show similar iodine-specific images for DSA and ESA for similar patient entrance
exposures. Our experimental results are in excellent agreement with our theoretical
calcu-lations. A 500μm CsI thickness can increase the iodine SNR per root exposure by 15-30%
compared to thinner CsI thicknesses in older detector models. The acceptable read noise
for ESA needs to be a factor of 5 lower than DSA and the acceptable scatter-to-primary
ratio for ESA needs to be 0.05 in order for ESA to achieve similar iodine SNR per-root air
KERMA to DSA. We show experimentally that we can achieve a scatter-to-primary ratio
of 0.03-0.05 by increasing the air gap to 30 cm, which is a reasonable air gap used for
fluoroscopy.
We conclude that ESA under these conditions is possible and has the potential to
pro-duce iodine-specific images similar to DSA for similar patient entrance air KERMA. ESA
may potentially be used for background removal in situations where DSA cannot be used
such as cardiac imaging.
[This chapter was published as the article “Energy subtraction angiography can compete
with digital subtraction angiography in terms of iodine Rose SNR” by Christiane S. Burton,
John R. Mayo and I. A. Cunningham, Medical Physics 43(11) 5925-5933 (2016).]
1.4.2
Chapter 3: Optimizing iodine SNR per root air KERMA for
energy-subtraction methods
Once the theoretical framework had been established and validated for DSA and ESA
io-dine SNR we optimized physical parameters to achieve the best possible ioio-dine SNR. A
notable optimization study for dual-energy by Van Lysel[133] showed using a trial and
er-ror approach that the best results were obtained using a low-energy kV setting of 50 - 55 kV
and the highest possible high-kV setting, coupled with a 1.5-2.0 mm beam-hardening filter
on the high-energy spectrum to increase spectral separation[60] (minimize overlap). We
the iodine SNR for ESA is equal to that of DSA for low iodine mass loadings and for
sim-ilar patient entrance exposure. Image quality is a combination of physical and technical
parameters, therefore it is still unknown whether dual-energy is also limited by physical
parameters.
In Chapter 2 we demonstrated that energy subtraction angiography under special and
practical circumstances has similar iodine signal-to-noise ratio (SNR) for similar patient
entrance air KERMA compared to digital subtraction angiography, the reference standard.
However, the parameters used to achieve an iodine SNR were for a single technique and
may have been sub-optimal, and therefore it is necessary to perform an optimization study.
Image optimization can be determined by the mAs ratio in both the high and low kV beam
for a fixed entrance exposure. In this paper the authors show mAs ratios that will yield
optimal or near optimal (within 10% of optimal) iodine SNR per root air KERMA for
ESA. Iodine SNR per root patient entrance air KERMA was optimized with respect to the
mAs ratio (low/high) kV exposure. The mAs ratio is optimized for ESA by varying the
ratio between the low and high mAs for three different water thicknesses and kVps of 50,
60, and 70 kV. The low kV of 50 kVp and a copper filter thickness of 2.5 mm for high
kVp of 120 kV will yield the best possible iodine SNR per root air KERMA compared
to 60 and 70 kVp. For ESA to translate to the clinic we looked at the iodine SNR for
detector materials that are commercially available such as CsI, Gd2O3, and Se for material
thicknesses of 0.4, 0.4, and 0.1 mm. We concluded that for ESA, techniques of 50 kV and
120 kV (2.5 mm copper) ESA should use an mAs ratio of 1.0, for 60 kV the optimal mAs
ratio is 0.5, and for 70 kV the mAs ratio should be 0.3 for all patient thicknesses. The issue
of heat loading may be overcome with use of a fast kVp-switching x-ray machine so that
fewer images may be acquired.
[This chapter consists of the manuscript “Optimizing iodine SNR per root air KERMA
for energy-subtraction methods” by Christiane S. Burton, John R. Mayo and I. A.
1.4.3
Chapter 4: Residual bone signal for dual-energy subtraction
an-giography
Once we discover what combined parameters will give optimal or near-optimal iodine SNR,
the next step is to look at how well our dual-energy method works in an anthropomorphic
phantom. A key study by Liu et al.[229] looked at dual-energy for a three material
decom-position where they used mass conservation to express the third material in terms of total
mass and found that the three material decomposition produced more accurate Hounsfield
units for CT compared to a two-material decomposition for a three-material composition.
Other studies looked at differentiating iodine from other material such as calcified plaque
in the arteries in CT.[53, 36, 127, 24, 173, 178, 57, 125, 110, 79, 96] Van Lysel[135] has
also shown that bone may be partially suppressed in dual-energy images. However, little
has been done to address removing bone for dual-energy for a three material composition
of iodine, water, and bone. The purpose of this study is to show what parameters are needed
for suppressing bone from a dual-energy image and show the effect bone suppression has
on the iodine signal.
We use two phantoms to demonstrate the effect of bone removal for iodine signal.
The first phantom used for this study consists of iodinated stepwedge submerged in 20 cm
thickness of water and bone-mimicking DEXA wedge material (SB3; Gammex-RMI,
Mid-dleton, WI, U.S.A.)[35, 45, 77, 33] that is attached to the outside surface of the tank. We
acquired images of the iodine stepwedge and DEXA wedge together, and we took images
of each wedge separately to calculate the transmission factor of iodine and DEXA material
for each thickness. The second phantom consists of RANDO anthropomorphic vascular
phantom,[2] a thin 2 cm thickness tank of water, and water-equivalent iodine-filled
tub-ing submerged in the thin tank of water placed right up against the back of the RANDO
phantom. In both cases we used a 30 cm air gap from Chapter 2 between the surface of
the phantom and the surface of the detector. We used a very-low noise CsI/CMOS
and 0.5 mm CsI. ESA images were acquired using a fast kV-switching generator (EMD
Technologies, Montreal Canada) operating in single-exposure mode with several seconds
between high and low-energy exposures. The ESA images were acquired using low kV of
50, 60, and 70 kV and a fixed high kV of 120 kV with 2.5 mm of copper filtration. We
as-sessed whether the tubing used is water equivalent or not by filling the tube with water, then
submerging the tube in water and acquiring images of the tubing at 50, 80 and 120 kV. We
excluded the tubing that was visible compared to the background in the image. We attached
small lead pieces to the end of each tube. For the tubes that we could not see we took an
image profile in the x-direction of the image near the lead strip and plot it against the pixel
values of the image. We used Amber Natural Latex Tubing with 1/8” inner diameter (I. D.)
and wall thickness of 1/32”.
In this study we show that soft-tissue suppression will preserve the iodine signal while
weighting to remove cortical bone will suppress the thin DEXA steps only and increase
image noise. Removing soft-tissue rather than bone would be better for iodine signal.
We also show the with RANDO phantom that different weights affect how well iodine and
bone-mimicking material can be visually seen in the image. With a weight of 0.2 the iodine
signal appears to be completely suppressed along with the bone-mimicking material, but as
the weight increases both iodine and bone signal appear in the image. Weights of 0.5 and
0.55 preserve the iodine signal and show better suppression of bone compared to images
with weights of 0.6 and 0.8. We suggest that for 60 and 120 kV that a weight of 0.5 or 0.55
be used for imaging a three material composition. We show the benefits of dual-energy
imaging compared to a single kV image of the RANDO vascular phantom where in the
single kV image the iodine signal shows little contrast to the background.
We show that when using bone weighted ESA images the iodine signal decreases
com-pared to soft-tissue subtraction. We show that iodine signal is very low with DEXA wedge
signal cancellation for thin DEXA wedge thicknesses of 0.1 and 0.4 cm, and in practice we
images. We show that with an anthropomorphic phantom that ESA better removes
soft-tissue and partially removes bone-mimicking material compared to conventional single kV
image.
We conclude that soft-tissue weighted imaging is optimal for preserving iodine signal,
partial bone removal (particularly thin bone), and ESA image noise. For 60 and 120 kV the
weight needed to preserve iodine and partially suppress bone-mimicking material the best
is between 0.5 and 0.55. We conclude that for a 3 material composition of iodine, water, and
bone, water is the material that needs to be removed. In a future study we plan to consider
addressing performing ESA in real-time similar to fluoroscopy for cardiac imaging.
[This chapter is a draft manuscript of an article to be submitted for publication “Bone
removal for dual-energy subtraction angiography” by Christiane S. Burton, John R. Mayo
and I. A. Cunningham.]
1.4.4
Goals and objectives
Image quality is determined by a combination of many physical and technical
parame-ters. In this thesis we examine the fundamental signal and noise characteristics that can
be achieved using both energy-based subtraction and DSA methods for the similar patient
entrance exposures. Results are validated experimentally in a phantom study and the
tech-nical parameters required to achieve near ideal image quality are identified. It is shown that
under many situations of practical importance, ESA can have image quality that compares
favourably with DSA.
1.5
References
[1] H. L. Abrams. History of cardiac radiology. American Journal of Roentgenology,
[2] S. W. Alderson. Method and apparatus for accurate radiation dosage control in breast
cancer treatment. Official Gazette of the United States Patent & Trademark Office
Patents, 1211(4):3858, 1998.
[3] G. Alleyne, R. Beaglegole, D. Bramley, J. Carrington, R. Chowdhury, M. Engelgau,
M. Ezzati, C. Foster, O. Franco, V. Fuster, G. Gartlehner, D. Goodarz, V. Grabauskas,
I. Graham, M. Hassan, J. Harold, C. Hawkes, C. Heneghan, K. Kotenko, L. Li,
A. Lopez, G. Masset, J.-C. Mbanya, G. Mensah, R. Moodie, V. Narayan, S. Nishtar,
S. Reddy, J. Rehm, M. Rayner, P. Scarborough, Y. Seedat, S. Shastri, P. Shetty,
S. Smith, I. Sommer, L. Sperling, D. Stuckler, D. Webb, K. Wickramasinghe,
D. Wood, Q. Youlin, and S. Yusuf. Global Status Report on Noncommunicable
Diseases 2014. World Health Organization, Geneva, 2014.
[4] R. E. Alvarez and A. Macovski. Energy-selective reconstructions in x-ray
comput-erized tomography. Physics of Medicine and Biology, 21(5):733–744, 1976.
[5] R. E. Alvarez, J. A. Seibert, and S. K. Thompson. Comparison of dual energy
detector system performance. Medical Physics, 31(3):556–566, 2004.
[6] Robert E. Alvarez. Near optimal energy selective x-ray imaging system performance
with simple detectors. Medical Physics, 37(2):822–841, 2010.
[7] A. Alwan, T. Armstrong, D. Bettcher, T. Boerma, F. Branca, J. C. Y. Ho, C. Mathers,
R. Martinez, V. Poznyak, G. Roglic, L. Riley, E. d‘Espaignet, G. Stevens, K. Taubert,
and G. Xuereb.Global atlas on cardiovascular disease prevention and control 2011.
World Health Organization, Geneva, 2011.
[8] M. Anthea, L. Roshan, J. Hopkins, C. W. McLaughlin, S. Johnson, M. Q. Warner,
D. LaHart, and J. D. Wright. Human Biology and Health. Pearson Prentice Hall; 3
[9] G. T. Barnes, R. A. Sones, M. M. Tesic, D. R. Morgan, and J. N. Sanders. Detector
for dual-energy digital radiography. Radiology, 156(2):537–540, 1985.
[10] Y. Bentoutou, N. Taleb, M. C. El Mezouar, M. Taleb, and L. Jetto. An invariant
approach for image registration in digital subtraction angiography. Pattern
Recogni-tion, 35(12):2853– 2865, 2001.
[11] G. E. Berrios. The origins of psychosurgery: Shaw, burckhardt and moniz. History
of Psychiatry, 8(1):61–81, 1997.
[12] W. R. Brody. Digital subtraction angiography.Institute of Electrical and Electronics
Engineers Transactions on Nuclear Science, 29(3):1176–1180, 1982.
[13] W. R. Brody, G. Butt, A. Hall, and A. Macovski. A method for selective tissue and
bone visualization using dual energy scanned projection radiography. Med. Phys.,
8(3):353–357, 1981.
[14] R. A. Brooks and G. Di Chiro. Beam hardening in x-ray reconstructive tomography.
Physics Medical Biology, 21(3):390–398, 1976.
[15] Statistics Canada. Mortality, summary list of causes 2008. Statistics Canada, 2011.
[16] D. P. Chakraborty. Image intensifier distortion correction. Medical Physics,
14(2):249–252, 1987.
[17] W. A. Chilcote, M. T. Modic, W. A. Pavlicek, J. R. Little, A. J. Furian, P. M.
Duch-esneau, and M. A. Weinstein. Digital subtraction angiography of the carotid arteries:
A comparative study in 100 patients. Radiology, 139(2):287–295, 1981.
[18] G. L. Clark, W. M. Duane, and W. W. Stirler. The secondary and tertiary rays from
chemical elements of small atomic number due to primary x-rays from a
molyb-denum target. Proceedings of the National Academy of Sciences, 10(4):148–152,
[19] A. Cournand. Cardiac catheterization; development of the technique, its
contribu-tions to experimental medicine, and its initial applicacontribu-tions in man. Acta Medical
Scandinavia Supplier, 579:3–32, 1975.
[20] G. S. Cox and G. de Jager. Automatic registration of temporal image pairs for
dig-ital subtraction angiography. Society of Photographic Instrumentation Engineers,
2167:188–199, 1994.
[21] I. A. Cunningham and R. Shaw. Signal-to-noise optimization of medical imaging
systems. J. Opt. Soc. Am. A, 16(3):621–632, 1999.
[22] G. T. Barnes D. M. Tucker and D. P. Chakraborty. Semiempirical model for
gener-ating tungsten target x-ray spectra. Medical Physics, 18(2):211–218, 1991.
[23] P. Dawson. Digital subtraction angiography: A critical analysis.Clinical Radiology,
39(5):474–477, 1988.
[24] K. Deng, C. Liu, R. Ma, C. Sun, X.-m. Wang, Z.-t. Ma, and X. I. Sun.
Dual-energy direct bone removal ct angiography for evaluation of intracranial aneurysm
or stenosis: comparison with conventional digital subtraction angiography. Clin.
Radiol., 64(5):534–541, 2009.
[25] C. T. Dotter and L. H. Frische. Visualization of the coronary circulation by occlusion
aortography: a practical method. Radiology, 71(4):502–524, 1958.
[26] J. L Ducote, X. Tong, and S. Molloi. Dual-energy cardiac imaging: an image quality
and dose comparison for a flat-panel detector and x-ray image intensifier.Physics in
Medicine and Biology, 52(1):183–196, 2007.
[27] J. L. Ducote, T. Xu, and S. Molloi. 2007. Physics in Medicine and Biology, 52:183–


![Figure 2.2.2: Average energy absorbed in binned pixel per interacting photon, E(a(E) =Eab(E)+E)/2 where Eab is the tabulated absorbed energy.[161]](https://thumb-us.123doks.com/thumbv2/123dok_us/1990540.1263339/65.612.217.417.71.228/figure-average-energy-absorbed-binned-interacting-tabulated-absorbed.webp)