Available online:
https://edupediapublications.org/journals/index.php/IJR/
P a g e | 1595A Study and Evaluation of Behaviour of High Concentrated
Ash Slurry
Bhukya Ramu
ABSTRACT: In India, about 75% of total electricalenergy is generated from thermal power plants which in turn release about 130 million tones of fly ash as solid waste yearly.Transportation and removal of such a huge amount of fly ash is a major problem faced by the power plants. Presently fly ash is being transported as lean slurry in pipe lines requiring about 80 to 85% of water with more energy input.Recently, high concentrated slurry disposal (HCSD)structure has been introduced to get over of these complications. In this transportation system, ash slurrydoesn’t only flow till it reaches the destination, but also settles down on the ash pond. This studydescribes the geotechnical properties of ash slurry of HCSD system in terms of densities, specificgravity, moisture content, and permeability. Change in properties of field tests with time are alsoshown in graphs.
KEYWORDS-Power generation, ash slurry, transportation system, HCSD, geotechnical properties.
I. INTRODUCTION
Fly ash is produced in large quantities in India (about 130 million tons per annum) from the thermal power stations situated across the country.1 There are numerous successful case histories on the utilization of fly ash either alone or mixed with lime, gypsum or both [2]. In spite of efforts made by Government agencies and fly ash producers the fly ash utilization level has reached up to about 40 to 45% only. With increasing generation of fly ash, efforts are being made to transport it through pipelines. But it becomes complex due to quick settling nature of fly ash particles because of its higher specific gravity as compared to that of water. This problem is normally addressed by pumping of solids as a lean aqueous suspension or slurry (usually 15 to 20% by mass) to ash pond area.[3,4] The economic efficiency of this process depends on the power requirements for
Available online:
https://edupediapublications.org/journals/index.php/IJR/
P a g e | 1596for concentrations above 40% by weight.6 Coarse particulate slurries require high operating velocities for transportation resulting in higher specific energy consumption per unit solid throughput. On the other hand transportation of non-settling solids would result in lower energy consumption and better operational conditions. A surfactant is chosen for this investigation and added to the fly ash slurry to keep the solid particles water borne in the suspension during its transportation in hydraulic pipelines. These agents when added to a liquid, reduces its surface tension, thereby increasing its spreading and wetting properties. These aqueous solutions can even reduce up to 80% of the drag in a turbulent straight pipe flow in a wide range of temperature environment.[11] Many researchers have investigated the characteristics of such a dilute surfactant solution,but limited studies are reported about the use of these agents for the transportation of fly ash slurry in the pipe lines. In the present study, an attempt has been made to evaluate the flow properties of the fly ash slurry with and without an additive.
II. BACKGROUND WORK
Usui H., Li L. And Suzuki H. (2001) proposed that most packing extent fraction for nonspherical suspension changed into effectively applied to forecast the slurry viscosity below completelydispersed situations. The version ensued inside the estimation of inter particle bonding forcewithin primary debris in a cluster, the power consumption and flow price dating inhydraulic slurry pipeline transportation device. A capability mode to decrease the overall value ofslurry pipeline device by means of periodic addition of stabilizer is proposed. Verma A. K., Singh S.N. And Seshadri V. (2006) described that the pressure drop for anyparticular stable awareness upsurges with successful in velocity and at any given flow speedstrain drop will increase with upward thrust in stable awareness and investigated that Specific Energyconsumption decreases up to a concentration of 65% by weight and sharply rises beyond this fee.Naik H. K., Mishra M. K. And Rao K. U. M. (2011) recommended the fly ash slurry rheology isstrongly inclined through
chemical components and the surface tension of the treated fly ash slurry isreduced as compared to untreated fly ash which suggests that fly ash has superior capability to beconveyed in pipelines with accession of cationic surfactant and a counter-ion which mightdecrease particular gravity intake and water call for.
Kawaguchi et al. And Li et al. (2008) experimented with equal amount of surfactant andcounter-ion for his or her drag discount examine on turbulent occasions in channel flows. Biswas A. (2000)provided fly ash above forty percentage attention indicates non-Newtonian behaviour andviscosity will increase promptly with boom in awareness. There are bills of robust impactof surfactants on rheological behaviour of ash slurry. Horsely R. R. (1982) cautioned that the monetary efficiency of the transportation system of theslurry depends on the strength requirements for pumping, which successively relies upon at theawareness, viscosity and yield stress of slurries and proposes the method of design of slurrydisposal system.
Jones R. L. And Chandler H. D. (1989) published that fly ash by and large accommodates of silica withvariable extents of different substances like Aluminium, Iron and alkaline earth substances. Thepresence of those materials present drag results on rheology of ash slurry. They additionally analysedglide behaviour of ash slurry with various particle sizes and drag reducing chemical marketers. Qi Y., Zakin J.L. And Zhang Y. Et al. (2005) investigated at the influence of a cationicsurfactant, together with cetyl trimethyl ammonium bromide (CTAB) at the flow behaviour of ashslurry in phrases of shear charges, viscosity, temperature and concentration. They found it verypowerful in reducing friction elements in turbulent drift.
Available online:
https://edupediapublications.org/journals/index.php/IJR/
P a g e | 1597floatvelocity and attention. They also remarked that slurry with 50% awareness flows at aspeed approx. 41m/sec interior straight pipeline.
III. THE SUGGESTED APPROACH
From Vedanta Aluminium Limited, Jharsuguda plant, disturbed and undisturbed samples werecollected; field tests were also conducted.
List of experiments conducted:
1. In-situ density test
2. Variances of bulk density, water content and dry density with time at field
3. Standard proctor test 4. Modified proctor test 5. Specific gravity test 6. Permeability test
In-situ Density Test:
Procedure:Undisturbed fly ash samples were collected from ash pond at Vedanta Aluminium Limited,Jharsuguda with the help of core cutters. Core cutters were greased from inside before it wasused and the mass and volume of the empty core cutter was measured and so mass of the corecutter having sample was measured and noted. Some amount of samples were also extractedfrom core cutter for oven drying for determination of water content. Then the in-situ densitieswere calculated from the subsequent equations.
γ = (M2 - M1) / V γd = γ / [1+ (w/100)] Where,
γ = Bulk density (g/cm3) γd = Dry density (g/cm3) M1 = Mass of core cutter (g)
M2 = Mass of core cutter with fly ash (g) V = volume of the core cutter (cm3) w = water content (%)
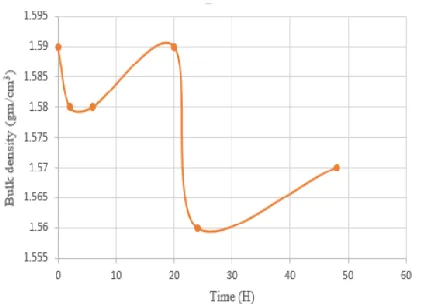
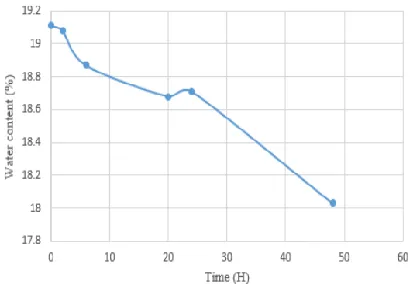
Variations of Bulk density, Water content & Dry density In a Run of 48Hours at Different Sites of Ash Pond:
Procedure:Three different sites of the ash pond at Vedanta Aluminium Ltd., Jharsuguda were chose andnamed as A, B, C. Empty mass and volume of the core cutter were measured and noted. Fromeach site, samples were taken out with the help of core cutter at a time. Then the mass of corecutterwith undisturbed sample were measured for each site. Also some amount of samples fromcore cutter of each site were taken for further oven drying process for water contentdetermination. Repetition of the above procedure were done after 2, 6, 20, 24, and 48 hours toassess the bulk density, water content and dry density for each time interval for each site. Thefollowing formulae govern this test:
γ = (M2 - M1) / V γd = γ / [1+ (w/100)] Where,
γ = Bulk density (g/cm3) γd = Dry density (g/cm3) M1 = Mass of core cutter (g)
M2 = Mass of core cutter with fly ash (g) V = volume of the core cutter (cm3) w = water content (%)
Modified Proctor Test
Procedure:During the lab test, the mould was attached to a base plate at bottom and to an extension at thetop. The mass of the mould only with the base plate was measured. Initially, 2.5 kg of oven driedash sample was taken and mixed with 10% of water. Then the prepared sample was compactedin 5 equal layers through 25 blows of the hammer from a height of 45.7 cm each. Then theexcess ash was cut down by straight edge after removing the top extension. Then the mass ofmould with base plate and sample was noted. Some ash sample were collected from the middleof mould for further over drying for water content finding. The above procedure was repeated formore five times with addition of higher percentage of water amount. In this modified version,only the compact energy was increased. The following formulae were used for the calculationpurpose. γ = (M2 - M1) / V
Available online:
https://edupediapublications.org/journals/index.php/IJR/
P a g e | 1598γ = Bulk density (g/cm3) w = water content (%) γd = Dry density (g/cm3) V = volume of the mould (cm3)
M1 = Mass of mould with base plate (g)
M2 = Mass of core mould with base plate and ash sample (g)
Specific Gravity Test
Specific gravity is specified as the ratio of the unit weight of a given sample to the unit weight of the water at a specific temperature.
Procedure:4 numbers of density bottles were dried in oven and cooled in desiccator. 50g of oven dried ashsample was taken and weighed with the bottle. Then, air-free distilled was added to the bottleand the bottle with dry ash and water was kept in vacuum desiccator for 1 hour. After bringingout from the desiccator, the mass was measured and noted. Then the bottle was filled only withair-free distilled water and cleaned thoroughly from outside for no mark of water drops andweighed. This same process was followed for other three density bottles too. Here, the specificgravity of collected fly ash was calculated by following formula:
G = (M2 – M1) / (M4 – M1) – (M3 – M2) Where,
M1 = Mass of density bottle (g) M2 = Mass of density bottle + dry ash M3 = Mass of density bottle + ash + water M4 = Mass of bottle + water
Permeability Test (Constant Head)
Permeability announces the ease with which water can flow through a given sample (fly ash).
The knowledge of permeability is vital in clarifications of many engineering complications involving flow of water through soil or ash such as: a) Assessing seepage through the body of earth dam b) Figuring losses from canal
c) Computing seepage rate from waste storage facility
Procedure:Undisturbed ash sample was filled in permeameter and placed centrally over the porous disc. Thedrainage base was fixed to the mould. After
compacting little with tampered rod, porous stoneswere kept above it. Then the top inlet was connected to water supply and the bottom outlet wasopened when steady state of flow was established. The quantity of flow for a precise time wascollected in graduated flask and measured. This process was repeated for another three times.The following formula was used for calculation of coefficient of permeability.
k = QL / Aht Where,
k = Coefficient of permeability (cm/sec) t = Time of discharge
Q = Volume of discharge (cm3) L = length of specimen (cm)
A = Cross-sectional area of permeameter (cm2) h = Hydraulic head difference (cm)
IV. EXPERIMENTAL SETUP
In-situ density test: The in-situ bulk density of ash slurry of the field study was found out to be 1.7 g/cm3 and in-situdry density was determined to be 1.4 g/cm3 from four observations
Variations of bulk density, water content & dry density in a run of 48 hours at different sites of ash pond:From the field tests at different sites, it was observed that the bulk density remained same foreach site throughout the time. The water content and dry density also didn’t vary more for eachsite.
Available online:
https://edupediapublications.org/journals/index.php/IJR/
P a g e | 1599Figure 1(b): Bulk density vs Time for site 'B'
Figure 1(c): Bulk density vs Time for site 'C'
Figure 1(d): Water content vs Time for site 'A’
Figure 1(e): Water content vs Time for site 'B'
V. CONCLUSIONS
From the limited tests conducted in the laboratory on the samples composed from thespecific sites over the specified period of time, it is experimental that the dry density of pondash at different locations of ash-pond remains same and is of the order of 1.4 g/cc. Thereis no gain in dry density over the time the ash settles in the pond.The permeability of the high focused settled ash slurry collected from ash pond is ofthe order of 1.3x10⁻⁴ cm/sec, which is almost same for most lean slurry disposal system.Consequently, there is no much gain in impermeability with high focused slurry system.
REFERENCES
[1]Kumar, V., 2006. Fly ash: a resource for sustainable development, Proceedings of the International Coal Congress & Expo-2006, New Delhi, 191-199.
[2] Mishra, M.K., Rao, K.U.M., 2006. Journal of Geotechnical and Geological Engineering, 24(6), 1749-1765.
[3] Bunn, T.F., 1989. Dense phase hydraulic conveying of power station fly ash and bottom ash, Third International conference on bulk materials, storage, handling and transportation, Newcastle, 27-29 June, 250-255.
Available online:
https://edupediapublications.org/journals/index.php/IJR/
P a g e | 1600[5] Horsley, R.R., 1982. Viscometer and pipe loop tests on gold slurries at very high concentration by weight, Hydro-transport (BHRA), 8, 367-382. [6] Seshadri, V., Singh, S.N., Jain, K.K., Verma, A.K., 2005. Rheology of fly ash slurries at high concentrations and its application to the design of high concentration slurry disposal system (HCSD), Proceedings of the International Conference on Fly Ash Utilization, New Delhi, V.1.1-10.
[7] Verma, A.K., Singh, S.N., Seshadri, V., 2008: Intl. Journal of fluid Mechanics Research, 445-457. [8] Biswas, A., Gandhi, B.K., Singh, S.N., Seshadri, V. Indian Journal of Engineering and Material Science, 2000, Vol. 7, p. 1-7.
[9] Matras, Z., Malcher, T., Gzyl-Malcher, B., 2007. The influence of polymer-surfactant aggregates on drag reduction, Thin Solid Films, DOI: 10. 1016/j.tsf.2007.11.057.
[10] Jones, R.L., Chandler, H.D., 1989. The effect of drag-reducing additives on the rheological properties of silica-water suspensions containing iron (III) oxide and of a typical gold-mine slurry, J. S. Afr. Inst. Min. Metall., 89(6), 187-191.
[11] Nguyen, H., Ishihara, K., Suzuki, H., and Usui, H. Nihon Reoroji Gakkaishi, 34 (1), (2006).17-23.
[12]. Li F. C., Kawaguchi Y., Yu B., Wei J., Hishida K. (2008) “Experimental study of dragreduction mechanism for a dilute surfactant solution flow”, International Journal of Heatand Mass Transfer, 51, pp. 835-843.
[13]. Biswas A., Gandhi B. K., Singh S. N., Seshadri V. (2000) “Characteristics of coal ashand their role in hydraulic design of ash disposal pipelines”, Indian Journal ofEngineering and Material Science, 7, pp. 1-7.
[14]. Horsely R. R. (1982) “Viscometer and pipe loop tests slurries at high concentration byweight”, Journal of Hydro-transport (BHRA), Vol. 8, pp. 37-382.
[15]. Jones R. L., Chandler H. D. (1989) “The effect of drag reducing additives on therheological properties of silica-water suspensions containing iron (III) oxide and oftypical gold-mine slurry”, Journal of South Afr. Inst. Min. Metall.”, 89, pp. 187-191.
BIODATA