Reflectometry on Asymmetric Transmission Line Systems
Mashad U. Saleh1, *, Joel B. Harley2, Naveen K. T. Jayakumar1, Samuel Kingston1, Evan Benoit1, Michael Scarpulla1, and Cynthia Furse1
Abstract—Time domain reflectometry is frequently used to localize faults in electrical systems. Most existing literature on reflectometry in transmission lines considers symmetric faults that are either shorts between the two conductors or open circuits where both conductors are disconnected at the same location. This paper investigates spread spectrum time domain reflectometry (SSTDR) applied to asymmetric twin-lead transmission lines in which either only one conductor is disconnected, or the reflectometry instrument itself is asymmetric. For asymmetric faults, we observe not only the expected dominant reflection corresponding to the location of the disconnection, but also an additional reflection from the end of the transmission line. In the second case, we leverage the asymmetric response of the SSTDR instrument to identify which of the two otherwise identical conductors has been disconnected.
1. INTRODUCTION
Reflectometry has been used to detect faults in electrical systems [1–4], including photovoltaic (PV) systems [5]. Classical analysis of reflectometry for transmission lines considers symmetric systems where an impedance occurs on both lines of a symmetric twin-lead transmission line. Typical examples are a parallel open circuit where both conductors are disconnected or a short circuit where they are shorted together [2, 6] as in Fig. 1(a). For these cases, a single reflection is seen at the disconnection, and 100% of the signal is reflected.
However, many realistic systems are asymmetric-faults, the lines themselves, or the measurement hardware is different on the positive and negative wires [7, 8]. Other examples of asymmetric measurements include reflectometry using a chassis ground return [9] and testing a three-phase power distribution system where only one line is damaged [10]. This paper addresses the effect of these asymmetries, which to our knowledge has not been addressed in the past, and provides a fundamental contribution to the field of reflectometry by examining asymmetric faults where only one conductor of a twin-lead cable is broken as in Fig. 1(b). We use spread spectrum time domain reflectometry (SSTDR) [2] for this analysis, though the assessment should apply to all types of reflectometry. We show that a strong reflection is seen from the asymmetric fault, and a smaller reflection from the end of the cable. This indicates that a small amount of power is able to pass the (asymmetric) fault, reaches the load, and returns to the test point. This small amount of power will produce multiple reflections similar to those seen in [11]. These effects of asymmetry can account for some small anomalies seen in reflectometry measurements.
The SSTDR instrument is designed to measure faults on live electrical systems and has an internal hardware circuit protection filter on the positive terminal only, making it asymmetric. We give a method for removing the effect of this instrumentation asymmetry. Previous literature has not addressed the effects of asymmetry in either the fault or hardware. Although we use SSTDR, the methods and concepts developed in this paper could be applied to other reflectometry methods as well.
Received 7 November 2019, Accepted 16 January 2020, Scheduled 31 January 2020 * Corresponding author: Mashad Uddin Saleh (mashad.saleh@utah.edu).
This paper is organized as follows: the measurement setup and theoretical reflection coefficients are described in Section 2. In Section 3, we experimentally show that measurable power can propagate past a disconnection occurring on one wire of a twin-lead transmission line, allowing measurements on the section of transmission line beyond the disconnection. Also, we demonstrate that an asymmetric reflectometer, in our case SSTDR with an internal circuit protection high-pass filter on the positive terminal, can be used to identify which of the two conductors has been disconnected. Finally, in Section 4 we develop a calibration approach for removing the effects of the asymmetric instrument. Conclusions are discussed in Section 5.
2. REFLECTOMETRY MEASUREMENTS
We use SSTDR [2] to measure a twin-lead transmission line where only one of the wires is disconnected, creating an asymmetric break, as shown in Fig. 1(b). Fig. 1(c) shows the measurement setup. The wires are 10 AWG multi-conductor cross-linked polyethylene (XLPE) coated 2000 V photovoltaic cable [12] taped together to form a twin-lead cable (see Table 1). This is representative of a PV system with a home run ground return wire. To find the characteristic impedance (Z0 = 178 Ω) of the twin-lead cable, we attached a potentiometer to its end and tuned it until reflections were not visible. The velocity of propagation (v0= 0.722±0.008 times the speed of light) was found by measuring the SSTDR response of an open circuit on a known length of twin-lead [13]. MC-4 connectors [14] at A+, A−, B+, B−, and C were manually disconnected to create breaks at the specified locations, as shown in Fig. 1(d).
(a)
(b)
(c)
(d)
Table 1. 10 AWG XLPE PV cable parameters [12].
Parameters Values
Conductor diameter (dc) 2.94 mm
Conductivity of copper (σc) 5.8×10⁷S/m
Loss tangent of XLPE 4×10⁴
μrXLP E 0.999994
XLPE insulation thickness (tin) 3.375 mm
Distance between conductors (Dc) 11 mm
rXLP E 2.3
The SSTDR is a 24 MHz Livewire ARNOLD W50A0093 [15]. It sends a 24 MHz square-wave modulated pseudorandom noise (PN) code down the twin-lead, where it reflects from impedance discontinuities and returns to the SSTDR. There it is correlated with a delayed copy of the incident signal to produce the SSTDR reflection signature seen in Fig. 2 (similar to [6]) for an open (MC-4 connector open at C) or short circuit (MC-4 connector closed at C). For SSTDR analysis, we will focus on the magnitude of the main peaks seen at 35.05 m, rather than the side peaks at 32 m and 38.1 m. The distance from the SSTDR is calculated by taking the measured time delay from the first reflection (not shown in Fig. 2) between the SSTDR (ZSST DR = 68 Ω) and twin-lead (Z0 = 178 Ω) and multiplying by the velocity of propagation, v0, on the twin-lead. We smooth the peaks as described in [13]. The reflections are normalized so that the reflection of an open circuit at C (with no other break before C) is 1.0, as shown in Fig. 2. Multiple reflections also reverberate within the system (from the load to the SSTDR and back), similar to those seen in [11].
28 30 32 34 36 38 40 42
Distance [m]
-1 -0.8 -0.6 -0.4 -0.2 0 0.2 0.4 0.6 0.8 1
|SSTDR Reflection|
OC at C SC at C
Figure 2. SSTDR reflection signature for the 35.05 m long twin-lead cable shown in Fig. 1(c) when there is an open (OC) or short (SC) circuit at point C.
The reflection coefficient, Γ, is the (unitless) ratio of the reflected and incident signals and is related to the characteristic impedance of the cable (Z0) and load or fault (ZL) by [16]
Γ = Vref lected Vincident
= ZL−Z0 ZL+Z0
(1)
is frequency-independent. In these scenarios, the magnitude of the SSTDR time domain reflection (the peak value in Fig. 2) is proportional to the reflection coefficient and, hence, the load can be derived [17]. Throughout this paper, we will express the reflection coefficient as the magnitude of the peak of the SSTDR reflection signature as has been done in other time domain reflectometry papers [2], realizing that this is strictly correct only for frequency-independent faults.
Reflections are produced at each discontinuity in Fig. 1. In Fig. 1(a), a symmetric open fault is shown with Γ+− = 1. This means that all the signal is reflected from the break, and no additional reflection is seen from the end of the cable (C), a result commonly seen in reflectometry literature. Fig. 1(b) shows two asymmetric fault scenarios, where only one of the two conductors is disconnected, while the other remains intact. This produces a reflection coefficient, Γ+(Γ−) at the location of the disconnection (the +/−indicate which wire is disconnected) and ΓC at the end of the cable. Our initial expectation was that asymmetric and symmetric faults would have essentially the same reflections; however, this was not the case, as we will show in the next section. This puzzle is what prompted this paper, as we explore what really happens at an asymmetric fault.
3. RESULTS
In this section SSTDR reflection signatures for the system shown in Fig. 1(c) with MC-4 connectors manually disconnected at locations A+, A−, B+, B−, and/or C are examined to understand how disconnecting a single wire (an asymmetric disconnection) compares with disconnecting both wires at the same location (a symmetric disconnection). In addition to the disconnection being unbalanced, the SSTDR instrument is itself asymmetric, with a high pass filter for circuit protection on the (+) terminal but not the (−) terminal, which we will explore in Section 4.
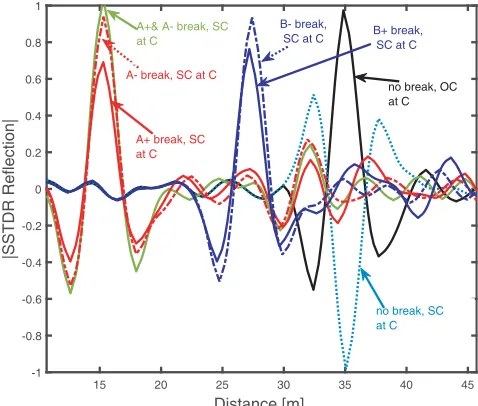
3.1. Symmetric Disconnections
The SSTDR responses for a symmetric system are shown in Fig. 3. The green line shows the response for a symmetric OC at A where both A+ and A−are disconnected. The maximum value of this response is set to Γ+− = 1.0 and used to normalize the rest of the responses. The black line shows a similar response (also seen in Fig. 2) for a symmetric OC at C, showing slight attenuation from magnitudes at A as could be expected. A similar (negative) response is seen for a symmetric short circuit at C.
For these symmetric faults, we can assume that no signal passes the fault and that all of it is
15 20 25 30 35 40 45
Distance [m]
-1 -0.8 -0.6 -0.4 -0.2 0 0.2 0.4 0.6 0.8 1
|SSTDR Reflection|
A+& A- break, SC at C
no break, SC at C A+ break, SC
at C
B+ break, SC at C
A- break, SC at C
B- break, SC at C
no break, OC at C
reflected (either in phase for an OC or out of phase for an SC). Thus, we begin with the normalization that Γ+−= 1.0 for the symmetric OC at A.
The SSTDR unit itself is asymmetric with a filter F on the positive line, but not the negative line as shown in Fig. 1. This has a slight impact on the magnitude and shape of both the symmetric and asymmetric responses. It will affect the analysis of the asymmetric faults, as we will see in the next section, because the signal on the positive and negative lines will be slightly different. For symmetric faults, however, the slight changes in the response caused by filter F are the same for every fault (where both lines are cut in the same location). When these responses are used to find the location of the fault, this is typically done by finding the relative location of the peak of the response [13], which is not changed by the asymmetry in the SSTDR instrument. This is no doubt one reason instrument asymmetry has not been discussed in detail in previous literature.
3.2. Asymmetric Disconnections — Primary Reflection
A primary asymmetric reflection is produced when only one wire is disconnected, such as at A+ or A−, B+ or B− in Fig. 1(c). SSTDR reflection signatures for these cases are also shown in Fig. 3. These asymmetric disconnections produce reflections that are slightly smaller than those from symmetric disconnections. For example, for a symmetric break (both A+ and A− disconnected), we have normalized so that (Γ+− = 1.0) at that location. When only A+ is disconnected Γ+ = 0.67, and when only A− is disconnected Γ− = 0.91. Both of these imply that less signal was reflected in the asymmetric cases than in the symmetric case. If less signal is reflected, this also implies that some signal passes the asymmetric disconnection and is traveling towards the load (C), where it will reflect and return. This leaves some additional signal that can propagate down the wire and produce a reflection from the end of the cable at the short circuit at C. We will call this the secondary reflection, and will evaluate them in the next section.
We also observe that the reflection when A−is disconnected is larger than the reflection when A+ is disconnected. This is because of the filter F that reduces the returned signal on the + line, but not the − line. A similar effect is seen at B. When only B+ is disconnected Γ+ = 0.74, and when B− is disconnected, Γ−= 0.90. The magnitudes of these primary reflections are summarized in Table 2.
Table 2. Magnitudes of SSTDR Responses vary because of the filter on the (+) terminal of the SSTDR instrument.
SSTDR Responses Magnitude
A+ & A−breaks at the same time, SC at C 1.0
A+ break, SC at C 0.67
A−break, SC at C 0.91
B+ break, SC at C 0.74
B−break, SC at C 0.90
(A+ break, SC at C) −(A+ break, OC at C) 0.06 (A−break, SC at C) −(A− break, OC at C) 0.01 (B+ break, SC at C) −(B+ break, OC at C) 0.05 (B−break, SC at C) −(B−break, OC at C) 0.02
3.3. Asymmetric Disconnections — Secondary Reflection
asymmetric break) to the SSTDR location, and be picked up as a reflection from the short circuit (SC) at C (35.05 m).
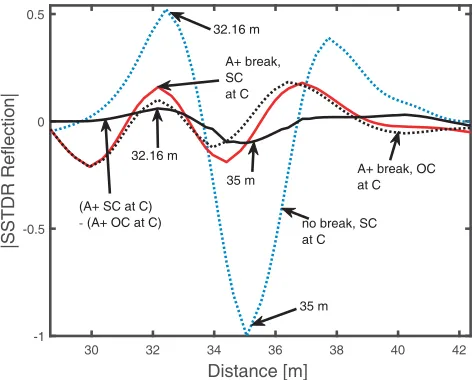
We will first perform a test to determine if we are actually seeing a response from C after an asymmetric disconnection is made at either A or B. To do this, we will make a change at C (change it from an SC to an OC, and compare the two measurements). If we have a reflection from C, then these two measurements would be different. Fig. 4 shows the response for a symmetric short circuit at C (Γ+− = −1.0), which gives us a reference for both magnitude and location comparison with the asymmetric reflections. The asymmetric reflection signatures from a disconnection at A+ with a SC at C are also shown in Fig. 4. We can clearly see a reflection. To confirm that we are actually seeing a reflection from C, we change C from an SC to an OC. This response is also seen in Fig. 4, and there is indeed a difference between these two secondary signatures (A+ with an SC or OC at C). The magnitudes of these differences are tabulated in Table 2. The fact that we see a measurable, albeit small change, confirms that we are indeed seeing a secondary reflection from C, although the shape is still difficult to visually interpret. This is because we see multiple superimposed reflections from the secondary reflection we are interested in (SC at C). These consist of multiple reflections from the primary reflection at A+ (these reflect back and forth between the SSTDR instrument and A+, superimposing as they go), and any reflections from within the system such as from the MC-4 connectors, and the reflection at the SSTDR interface.
30 32 34 36 38 40 42
Distance [m] -1 -0.5 0 0.5 |SSTDR Reflection|
(A+ SC at C)
- (A+ OC at C)
A+ break, SC at C
no break, SC at C
A+ break, OC at C 32.16 m
32.16 m
35 m
35 m
Figure 4. SSTDR responses for A+ break with open (OC) and short (SC) at the end of the cable (point C). The difference of the A+ break with open and shorts at the end are also shown.
30 32 34 36 38 40
Distance [m] -1 -0.8 -0.6 -0.4 -0.2 0 0.2 0.4 0.6 0.8 1 |SSTDR Reflection| No break
10 times (A+ SC- A+ OC) 33 times (A- SC- A- OC) 10 times (B+ SC- B+ OC) 25 times (B- SC- B- OC)
Figure 5. Normalized (magnified) reflections at C taken from differences (OC subtracted from SC) for each break, compared to the shape of the original reflection at C with no break. The differences are magnified by 10 times, 33 times, 10 times, and 25 times for A+, A−, B+, and B− breaks respectively.
To validate that these are indeed reflections from C, we can investigate the shape of the signal returning from C. We will do this by magnifying the signal minus its baseline (A+ with an SC at C minus A+ with an OC at C) so that it has the same magnitude as a SC at C (Γ = −1.0), as shown in Fig. 5. We have done this for disconnections at A+, A−, B+, B−, all of which are shown in Fig. 5. The shapes of all of these changes are very close to an SC, and the location is at 35.05 m. Noise is seen, because we have amplified (multiplied) very small reflections, but the location and shape is unmistakably consistent with a secondary reflection from a short circuit at C. Notably, here we concentrate on the general shape of the signals, not their magnitudes, as we have not considered proper normalization for the baseline subtraction, multiple reflections, etc.
Thus, we can conclude that an asymmetric disconnection produces a primary reflection at the location of the disconnection similar to a symmetric disconnection, but with a slightly reduced magnitude. The relative magnitudes of these reflections are given in Table 2. A portion of the incident signal continues to the end of the wire, where it produces a secondary reflection indicative of the load (in this case, an SC or OC at C) at the end of the wire. We can validate that a secondary reflection is present by comparing reflections with an OC and SC at C. These differences are small but measurable, and are given in Table 2. By using a baseline approach and comparing the shape and location of these reflections (Fig. 5), we can see that they are, indeed, secondary reflections a signal that propagated past the asymmetric disconnection to C and back to the SSTDR.
It is well worth asking how the signals propagate past a break on one of the wires of the transmission line. The break was made by disconnecting the MC-4 connector on one wire as shown in Fig. 1(d). The theory of field propagation on twin-lead would tell us that when one of the conductors is cut or missing, the fields cannot propagate on the transmission line [16]. In that case, the reflection coefficient should be 1.0. Instead, we see a large (e.g., 91%, see Table 2) reflection, but some portion of the signal passes this disconnection, propagates towards the SC/OC load, reflects back, transmits through the break, and returns to the SSTDR to produce the reflections seen in Fig. 5. How does this happen? In future work, we can examine the 3D field propagation, however, that is beyond the scope of this paper.
We can, however, eliminate a few possible transmission scenarios. We could, for instance, hypothesize that this break might be acting as a capacitive or inductive gap. However, in either of those cases, the shape of the reflected signal would be changed (integrated in the case of a capacitor, differentiated in the case of an inductor). Fig. 5 shows that the signature is very close to the original SSTDR shape, so we can conclude that the fields are not crossing the gap created by opening a single MC-4 connector either capacitively or inductively.
Alternatively, we could hypothesize that this break might be acting like three transmission line segments of different impedances (transmission line segment before the break, the break itself and transmission line segment after the break). In that case, we would see a reflection at the start of the break and an equal and opposite reflection at the end of the break. These two equal and opposite closely spaced reflections would overlap, and the second reflection would nearly extinguish the first. The shape of the resultant reflection would have two very small pulses, one at the start and the other at the end of the SSTDR signature as seen in [18]. This is not the shape we observe in Fig. 5, so this is also not a reasonable explanation.
A third hypothesis is that the open MC-4 connectors and the wires attached to them are behaving like antennas, transmitting the SSTDR signature across the gap. Depending on the bandwidth of these effective antennas, the shape of the SSTDR response could be preserved in the transmission. In our testing, we found that changing the layout of the disconnection in Figs. 1(d) (keeping the wires close together, pulling them further apart, etc.) did not appreciably change the reflections observed. Thus, we recommend 3D full-wave simulations to provide a better understanding of the physics of the coupling across the disconnection, but this is beyond the scope of this paper and is recommended for future work.
4. RESULTS — ASYMMETRIC INSTRUMENTATION
have already seen that this asymmetry impacts analysis of asymmetric but not symmetric breaks. In this section, we will attempt to remove the effect of the instrument asymmetry with an approach that requires no knowledge of the filter configuration.
In the previous sections, the reflections from the (+) terminals are smaller than those from the (−) terminals due to the filtering on the (+) terminal. In addition, we can see a slight difference in shape in Fig. 5 between reflections from disconnections A+, B+ and A−, B−. Another effect is also seen in Figs. 4 and 5, and to a lesser degree in Fig. 2. The peaks at 32 m and 35.05 m (in the SSTDR signature shown by solid black line) have different magnitudes. This difference can be caused by either multiple overlapping reflections [11], or frequency dispersion (capacitance or inductance) in the system [17]. This combination of amplitude and shape difference could be useful to determine which wire (+) or (−) has been disconnected. However, in other cases, it may be desirable to remove this difference to improve accuracy of the analysis of the distance to the fault. Since the (−) line does not have a filter, one possible way would be to simply swap the leads on the measurement system so that we measure each line with the (−) lead, and use that result in our analysis. In many cases, that may be a practical solution. In imbedded applications, the addition of this switching circuit may be undesirable. We will do this correction in the frequency domain, by taking the Fourier transform of the SSTDR response (converting it to the frequency domain), performing the corrections, and then taking the inverse Fourier transform to transfer it back to the time domain.
As an alternative, we can represent the filtered reflection coefficient on the (+) wire, Γ+F as a function of the filter response, F(ω), and the reflection coefficient that would have been measured without the filter, Γ+U F,
Γ+F =F(ω)Γ+U F (2)
Both the reflection coefficient and filter response are complex and frequency-dependent. Γ+F is measured from a break on the positive wire as shown in Fig. 1(b). The results in Fig. 3 for (+) breaks are converted to the frequency domain using the Fourier transform to give Γ+F. Similarly, results for the (−) breaks give Γ−. Γ+U F is the desired reflection coefficient that would have been measured if the instrument did not have a filter. Without a filter, we would expect the reflection coefficients from a fault on the (+) wire (Γ+U F) to be equal to one on the (−) wire (which doesn’t have a filter, Γ−), that is:
Γ+U F = Γ− (3)
From Eqs. (2), (3), and measurements in Fig. 1(b), we can find the filter response, F(ω), at any location (such as B+ and B−):
F(ω) = Γ +
F
Γ− (4)
This can then be used to remove the effects of the filter and find the effective unfiltered reflection coefficient from the (+) wire:
Γ+U F = Γ +
F
F(ω) (5)
To see how well this works, we converted the reflectometry responses for the B+ and B− breaks shown in Fig. 3 from the time domain to the frequency domain. We used time domain data from 0 to 117 m and removed the filter effect from the B+ response, using Eq. (5), as shown in Fig. 6(a). Since the filter is on the + line only the B− response does not have the effect of the filter. Because we used B+ location to derive the filter response, this calibration exactly matches the responses at 27.43 m for both B+ and B− breaks, as expected. We include this figure only to show how much change is seen from removing the filter.
(a) (b)
Figure 6. Example of removing the effect of the filter coefficient, F(ω). (a) SSTDR responses from disconnections at B+ and B− with SC at C are shown after removing the filter effect from the B+ signature, (b) SSTDR responses from disconnections at A+ and A− with SC at C are shown after removing the filter effect from the A+ signature.
5. CONCLUSIONS
This paper extends the knowledge of reflectometry in two-wire transmission line systems where only one of the wires is disconnected, and/or where the reflectometer is asymmetric (differences exist between the positive and negative sides of the measurement instrument). In an asymmetric system, a disconnection on one wire introduces a large (primary) reflection from the location of the disconnection, along with a smaller (secondary) reflection from the end of the transmission line, as well as associated multiple reflections. This reflection is not from inductive or capacitive coupling across the disconnection nor the effect of mismatching impedances. Future 3D full-wave studies are recommended to better understand the physics of the coupling across this gap. Moreover, we investigated the effect of an asymmetric SSTDR reflectometry instrument, where a circuit protection high-pass filter is present on the positive terminal but not the negative terminal. This has the advantage of distinguishing which of the wires is disconnected, which has significant practical application in the diagnosis and maintenance of electrical systems. This asymmetry has the disadvantage of shape distortions in the signals, which would make the calculations for distance or magnitude of the fault slightly different if it was on the positive or the negative wire. We presented a method to remove this effect. These findings could be generalized to other types of transmission lines and other types of reflectometry. We should also note that the effects from asymmetry on the simple twin lead wires in our study will also be seen in other systems, such as networks of wires, wires tested over chassis grounds, etc. and may further complicate analysis of faults in these types of systems.
ACKNOWLEDGMENT
This material is based upon work supported by the U.S. Department of Energy’s Office of Energy Efficiency and Renewable Energy (EERE) under Solar Energy Technologies Office (SETO) Agreement Number DE-EE0008169.
REFERENCES
1. Pandey, G., E. T. Thostenson, and D. Heider, “Electric time domain reflectometry sensors for non-invasive structural health monitoring of glass fiber composites,” Progress In Electromagnetics
2. Furse, C., Y. C. Chung, C. Lo, and P. Pendayala, “A critical comparison of reflectometry methods for location of wiring faults,” Smart Structures and Systems, Vol. 2, No. 1, 25–46, 2006.
3. Zhang, X., M. Zhang, and D. Liu, “Reconstruction of faulty cable network using time-domain reflectometry,” Progress In Electromagnetics Research, Vol. 136, 457–478, 2013.
4. Harley, J. B., M. U. Saleh, S. Kingston, M. A. Scarpulla, and C. Furse, “Fast transient simulations for multi-segment transmission lines with a graphical model,” Progress In Electromagnetics
Research, Vol. 165, 67–82, 2019.
5. Saleh, M. U., J. LaCombe, N. K. T. Jayakumar, S. Kingston, J. Harley, C. Furse, and M. Scarpulla, “Signal propagation through piecewise transmission lines for interpretation of reflectometry in photovoltaic systems,” IEEE Journal of Photovoltaics, Vol. 9, No. 2, 506–512, 2018.
6. Smith, P., C. Furse, and J. Gunther, “Analysis of spread spectrum time domain reflectometry for wire fault location,” IEEE Sensors Journal, Vol. 5, No. 6, 1469–1478, 2005.
7. Tripathi, V. K., “Asymmetric coupled transmission lines in an inhomogeneous medium,” IEEE
Transactions on Microwave Theory and Techniques, Vol. 23, No. 9, 734–739, 1975.
8. Oraizi, H. and M. S. Esfahlan, “Miniaturization of wilkinson power dividers by using defected ground structures,” Progress In Electromagnetics Research Letters, Vol. 4, 113–120, 2008.
9. Furse, C., P. Smith, M. Safavi, and C. Lo, “Feasibility of spread spectrum sensors for location of arcs on live wires,”IEEE Sensors Journal, Vol. 5, No. 6, 1445–1450, 2005.
10. Staszek, K., S. Gruszczynski, and K. Wincza, “Six-port reflectometer providing enhanced power distribution,”IEEE Transactions on Microwave Theory and Techniques, Vol. 64, No. 3, 939–951, 2016.
11. Sma¨ıl, M.-K., T. Hacib, L. Pichon, and F. Loete, “Detection and location of defects in wiring networks using time-domain reflectometry and neural networks,”IEEE Transactions on Magnetics, Vol. 47, No. 5, 1502–1505, 2011.
12. “Spec 5851 SunGen XLPE, photovoltaic wire, 2000 V, UL type PV or 1000 V, CSA RPVU90, single conductor, copper,” [Online]. Available: http://dtsheet.com/doc/1724396/spec-5851-sungen-xlpe– photovoltaic-wire–2000-v–ul-type, Accessed: Aug. 23, 2018.
13. Jayakumar, N. K. T., E. Benoit, S. Kingston, M. U. Saleh, M. Scarpulla, J. Harley, and C. Furse, “Post-processing for improved accuracy and resolution of spread spectrum time domain reflectometry (SSTDR),”IEEE Sensors Letters, 2019.
14. “Amazon.com: Sun YOBA 20 Pairs MC4 cable connectors male/female safety seal ring waterproof solar panel cable connectors black: Garden & outdoor,” [Online]. Available: https://www.amazon.com/Sun-YOBA-Connector-Waterproof-Connectors/dp/B074VB8CW5/. 15. “Live cable fault detection by livewire innovation,” https://www.livewireinnovation.com/,
Accessed: May 07, 2018.
16. Pozar, D. M., Microwave Engineering, Wiley, 2012.
17. Furse, C., N. K. T. Jayakumar, E. Benoit, M. U. Saleh, J. LaCombe, M. Scarpulla, J. Harley, S. Kingston, B. Waddoups, and C. Deline, “Spread spectrum time domain reflectometry for complex impedances: Application to PV arrays,” 2018 IEEE Autotestcon. IEEE, 1–4, 2018.

![Table 1. 10 AWG XLPE PV cable parameters [12].](https://thumb-us.123doks.com/thumbv2/123dok_us/1964964.1259122/3.612.201.421.417.594/table-awg-xlpe-pv-cable-parameters.webp)