Combining Lexical-Syntactic Information with Machine Learning for
Recognizing Textual Entailment
Arturo Montejo-R´aez, Jose Manuel Perea, Fernando Mart´ınez-Santiago, Miguel ´Angel Garc´ıa-Cumbreras, Maite Mart´ın-Valdivia, Alfonso Ure ˜na-L´opez
Dpto. de Inform´atica, Universidad de Ja´en Campus de las Lagunillas s/n, 23071 - Ja´en
{amontejo, jmperea, dofer, magc, maite, laurena}@ujaen.es
Abstract
This document contains the description of the experiments carried out by SINAI group. We have developed an approach based on several lexical and syntactic measures inte-grated by means of different machine learn-ing models. More precisely, we have eval-uated three features based on lexical sim-ilarity and 11 features based on syntactic tree comparison. In spite of the relatively straightforward approach we have obtained more than 60% for accuracy. Since this is our first participation we think we have reached a good result.
1 Approach description
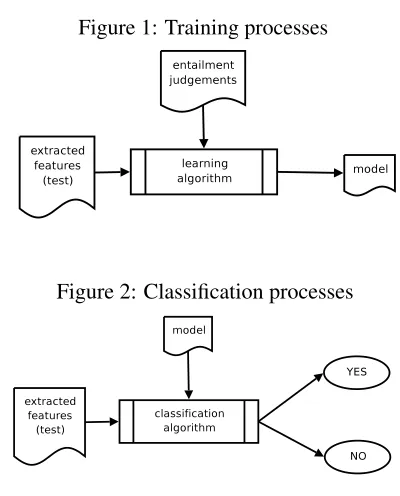
We fill face the textual entailment recognition us-ing Machine Learnus-ing methods, i.e. identifyus-ing fea-tures that characterize the relation between hypothe-sis and associated text and generating a model using existing entailment judgements that will allow us to provide a new entailment judgement agains unseen pairs text-hypothesis. This approach can be split into the two processes shown in Figures 1 and 2.
In a more formal way, given a text tand an hy-pothesishwe want to define a functionewhich takes these two elements as arguments and returns and an-swer to the entailment question:
e(t, h) =
½
Y ES ifhis entailed byt
N O otherwise (1)
[image:1.612.325.525.243.491.2]Now the question is to find that ideal function
Figure 1: Training processes
Figure 2: Classification processes
e(t, h). We will approximate this function using a binary classifier:
ˆ
e(t, h) =bc(f, m) (2)
where
bc is a binary classifier f is a set offeatures
m is the learned model for the classifier Therefore, it only remains to select a binary clas-sifier and a feature extraction method. We have per-formed two experiments with different choices for both decisions. These two experiments are detailed below.
1.1 Lexical similarity
This experiment approaches the textual entailment task being based on the extraction of a set of lexical measures that show the existing similarity between the hypothesis-text pairs. Our approach is similar to (Ferrandez et al., 2007) but we make matching between similar words too while (Ferrandez et al., 2007) apply exact matching (see below).
The first step previous to the calculation of the different measures is to preprocess the pairs using the Englishstopwordslist. Next we have used the GATE1 architecture to obtain the stems of tokens. Once obtained stems, we have applied four different measures or techniques:
• Simple Matching: this technique consists of calculating the semantic distance between each stem of the hypothesis and text. If this dis-tance exceeds a threshold, both stems are con-sidered similar and the similarity weight value increases in one. The accumulated weight is normalized dividing it by the number of ele-ments of the hypothesis. In this experiment we have considered the threshold 0.5. The values of semantic distance measure range from 0 to 1. In order to calculate the semantic distance between two tokens (stems), we have tried sev-eral measures based on WordNet (Alexander Budanitsky and Graeme Hirst, 2001). Lin’s similarity measure(Lin, 1998) was shown to be best overall measures. It uses the notion of information content and the same elements as Jiang and Conrath’s approach (Jiang and Con-rath, 1997) but in a different fashion:
simL(c1, c2) = 2×logp(lso(c1, c2)) logp(c1) + logp(c2)
where c1 and c2 are synsets, lso(c1,c2) is
the information content of their lowest super-ordinate (most specific common subsumer) and
p(c) is the probability of encountering an in-stance of a synset c in some specific corpus (Resnik, 1995). The Simple Matching tech-nique is defined in the following equation:
SIMmatching =
P
i∈Hsimilarity(i)
|H|
1http://gate.ac.uk/
whereHis the set that contains the elements of the hypothesis andsimilarity(i)is defined like:
similarity(i) =
n
1 if∃j∈T simL(i, j)>0.5 0 otherwise
• Binary Matching: this measure is the same that the previous one but modifying the simi-larityfunction:
similarity(i) =
½
1 if∃j∈T i=j
0 otherwise
• Consecutive Subsequence Matching: this technique relies on forming subsequences of consecutive stems in the hypothesis and match-ing them in the text. The minimal size of the consecutive subsequences is two and the max-imum is the maxmax-imum size of the hypothesis. Every correct matching increases in one the fi-nal weight. The sum of the obtained weights of the matching between subsequences of a cer-tain size or length is normalized by the number of sets of consecutive subsequences of the hy-pothesis created for this length. These weights are accumulated and normalized by the size of the hypothesis less one. The Consecutive Sub-sequence Matching technique is defined in the following equations:
CSSmatching = P|H|
i=2f(SHi)
|H| −1
whereSHi is the set that contains the subse-quences of the hypothesis withisize or length andf(SHi)is defined like:
f(SHi) =
P
j∈SHimatching(j) |H| −i+ 1
where
matching(i) =
½
1 if∃k∈STi k=j
0 otherwise
whereSTi represents the set that contains the subsequences withisize from text.
three words. If a hypothesis trigram matches in text, then the similarity weight value increases in one. The accumulated weight is normalized dividing it by the number of trigrams of the hy-pothesis.
1.2 Syntactic tree comparison
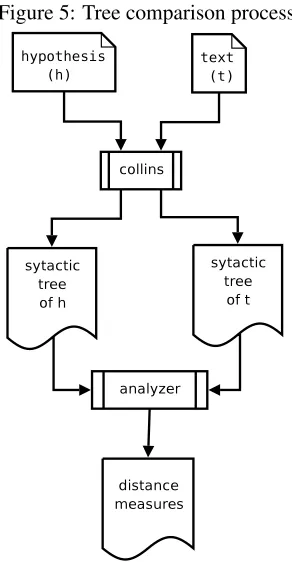
Some features have been extracted from pairs hypothesis-text related to the syntactic information that some parser can produce. The rationale be-hind it consists in measuring the similarity between the syntactic trees of both hypothesis and associated text. To do that, terms appearing in both trees are identified (we call thisalignment) and then, graph distances (number of nodes) between those terms in both trees are compared, producing certain values as result.
In our experiments, we have applied the COLLINS (Collins, 1999) parser to generate the syntactic tree of both pieces of text. In Figure 3 the output of the syntactic parsing for a sample pair is shown. This data is the result of the syntactical anal-ysis performed by the mentioned parser. A graph based view of the tree corresponding to the hypoth-esis is drawn in Figure 4. This graph will help us to understand how certain similarity measures are ob-tained.
Figure 3: Syntactic trees of sample hypothesis and its associated text
<t>
(TOP (S (LST (LS 0302) (. .)) (NP (JJ Next) (NN year)) (VP (VBZ is) (NP (NP (DT the) (JJ 50th) (NN anniversary)) (PP (IN of) (NP (NP (DT the) (NNP Normandy) (NN invasion) (, ,)) (NP (NP (DT an)(NN event)) (SBAR (IN that) (S (VP (MD would) (RB n’t) (VP (VB have) (VP (VBN been) (ADJP (JJ possible)) (PP (IN without) (NP (NP (DT the) (NNP Liberty) (NN ships.)) (SBAR (S (NP (DT The) (NNS volunteers)) (VP (VBP hope) (S (VP (TO to) (VP (VB raise) (NP (JJ enough) (NN money)) (S (VP (TO to) (VP (VB sail) (NP (DT the) (NNP O’Brien)) (PP (TO to) (NP (NNP France))) (PP (IN for)(NP (DT the) (JJ big) (NNP D-Day) (NN celebration) (. .))))))))))))))))))))))))))
</t>
<h>
(TOP (S (NP (NP (CD 50th) (NNP Anniversary)) (PP (IN of) (NP (NNP Normandy) (NNP Landings)))) (VP (VBZ lasts) (NP (DT a) (NN year) (. .)))))
</h>
From the sample above, the termsnormandy,year
[image:3.612.315.534.80.240.2]andanniversary appear in both pieces of text. We say that these terms are “aligned”. Therefore, for the three possible pairs of aligned terms we can com-pute the distance, in nodes, to go from one term to the other at each tree. Then, the difference of these
Figure 4: Syntact tree of sample hypothesis
[image:3.612.351.497.321.602.2]distances is computed and some statistics are gener-ated. We can summarize the process of computing this differences in the algorithm detailed in Figure 6.
Figure 5: Tree comparison process
corre-sponding to the text, and the absolute difference be-tween these two minimal distances is stored in order to compute final feature weights consisting in basic statistical values. The algorithm to obtain the distri-bution of distance differences is detailed in Figure 6.
Figure 6: Extraction of features based on syntactic distance
Input:
a syntactic tree of the hypothesisSh a syntactic tree of the textSt Output :
the set of distance differences Dd={ddij :ti, tj ∈T} Pseudo code:
T ←aligned terms betweenShandSt Dd← ∅
fori= 1..ndo forj=i+ 1..ndo
disth ←minimal distance between
nodestiandtj inSh distt←minimal distance between
nodestiandtj inSt ddij ← |disth−distt| Dd← {ddij} ∪Dd end-for
end-for
The statistics generated from the resulting list of distances differencesDdare the following:
1. The number of aligned terms (3 in the given example).
2. The number of matched POS values of aligned terms, that is, if the term appears with the same POS label in both texts (in the example An-niversarydiffers in the POS label assigned).
3. The number of unmatched POS labels of aligned terms.
4. The average distance in nodes through the syn-tactic tree to go from one aligned term to an-other.
5. The minimal distance difference found.
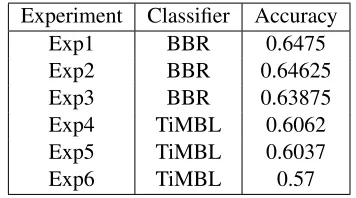
Table 1: Results with TiMBL and BBR classifiers (Exp5is the only official result reported in this pa-per).
Experiment Classifier Accuracy Exp1 BBR 0.6475 Exp2 BBR 0.64625 Exp3 BBR 0.63875 Exp4 TiMBL 0.6062 Exp5 TiMBL 0.6037 Exp6 TiMBL 0.57
6. The maximal distance difference found.
7. The standard deviation of distance differences.
In a similar way, differences in the depth level of nodes for aligned terms are also calculated. From the example exposed the following values were computed:
* Aligned 3 * MatchedPOS 2 * UnmatchedPOS 1
* AvgDistDiff 0.0392156863 * MinDistDiff 0.0000000000 * MaxDistDiff 0.0588235294 * StdevDistDiff 0.0277296777 * AvgDepthDiff 2.0000000000 * MinDepthDiff 1.0000000000 * MaxDepthDiff 3.0000000000 * StdevDepthDiff 0.8164965809
2 Experiments and results
The algorithms used as binary classifiers are two:
Bayesian Logistic Regression (BBR)2 and TiMBL (Daelemans et al., 1998). Both algorithms have been trained with thedeveldata provided by the organiza-tion of the Pascal challange. As has been explained in previous sections, a model is generated via the supervised learning process. This modelmis then feed into the classification variant of the algorithm, which will decide whether a new hypothesis sample is entailed by the given text or not.
The experiments and results are shown in Table 1: where:
• Exp1uses four features: three lexical similari-ties (SIMmatching+CSSmatching+ Trigrams) and Syntactic tree comparison.
2http://www.stat.rutgers.edu/˜madigan/BBR/ [available at
[image:4.612.69.294.187.462.2]• Exp2 uses five features: four lexical similari-ties (SIMmatching +CSSmatching + Trigrams + BINmatching) and Syntactic tree compari-son.
• Exp3 uses only three lexical similarities (SIMmatching+CSSmatching + Trigrams).
• Exp4 uses the four lexical similarities (SIMmatching + CSSmatching + Trigrams + BINmatching)
• Exp5 uses only three lexical similarities (SIMmatching+CSSmatching + Trigrams).
• Exp6uses four features: three lexical similari-ties (SIMmatching+CSSmatching + Trigrams) and Syntactic tree comparison.
As we expected, the best result we have obtained is by means of the integration of the whole of the features available. More surprising is the good result obtained by using lexical features only, even better than experiments based on syntactical features only. On the other hand, we expected that the integration of both sort of features improve significatively the performance of the system, but the improvement re-spect of lexical features is poor (less than 2%). . Similar topics share similar vocabulary, but not sim-ilar syntax at all. Thus, we think we should to inves-tigate semantic features better than the syntactical ones.
3 Conclusions and future work
In spite of the simplicity of the approach, we have obtained remarkable results: each set of features has reported to provide relevant information concerning to the entailment judgement determination. On the other hand, these two approaches can be merged into one single system by using different features all to-gether and feeding with them several binary classi-fiers that could compose a voting system. We will do that combining TiMBL, SVM and BBR.We ex-pect to improve the performance of the entailment recognizer by this integration.
Finally, we want to implement a hierarchical ar-chitecture based on constraint satisfaction networks. The constraints will be given by the set of avail-able features and the maintenance of the integration across the semantic interpretation process.
4 Acknowledgements
This work has been partially financed by the TIMOM project (TIN2006-15265-C06-03) granted by the Spanish Government Ministry of Science and Technology and the RFC/PP2006/Id 514 granted by the University of Ja´en.
References
Alexander Budanitsky and Graeme Hirst. 2001. Seman-tic distance in wordnet: An experimental, application-oriented evaluation of five measures.
Michael Collins. 1999. Head-Driven Statistical Models for Natural Language Parsing. Ph.D. thesis, Univer-sity of Pennsylvania.
Walter Daelemans, Jakub Zavrel, Ko van der Sloot, and Antal van den Bosch. 1998. Timbl: Tilburg memory based learner, version 1.0, reference guide.
Oscar Ferrandez, Daniel Micolo, Rafael Mu noz, and Manuel Palomar. 2007. T´ecnicas l´exico-sint´acticas para reconocimiento de inmplicaci´on textual. . Tec-nolog´ıas de la Informac´on Multiling¨ue y Multimodal. In press.
Jay J. Jiang and David W. Conrath. 1997. Semantic similarity based on corpus statistics and lexical taxon-omy. InProceedings of International Conference on Research in Computational Linguistics, Taiwan.
Dekang Lin. 1998. An information-theoretic definition of similarity. InProceedings of the 15th International Conference on Machine Learning.