Page 1 of 8
A deep learning, image based approach for automated diagnosis
for inflammatory skin diseases
Haijing Wu1#, Heng Yin1#, Haipeng Chen2, Moyuan Sun2, Xiaoqing Liu2, Yizhou Yu2, Yang Tang3, Hai Long1, Bo Zhang1, Jing Zhang1, Ying Zhou1, Yaping Li1, Guiyuing Zhang1, Peng Zhang1, Yi Zhan1, Jieyue Liao1, Shuaihantian Luo1, Rong Xiao1, Yuwen Su1, Juanjuan Zhao3, Fei Wang3, Jing Zhang3, Wei Zhang3, Jin Zhang3, Qianjin Lu1
1Department of Dermatology, Second Xiangya Hospital, Central South University, Hunan Key Laboratory of Medical Epigenomics, Changsha
410011, China; 2DeepWise AI Lab, Beijing 100080, China; 3Guanlan Networks (Hangzhou) Co., Ltd., Hangzhou 310000, China
Contributions: (I) Conception and design: Q Lu, H Wu, H Yin, W Zhang; (II) Administrative support: Q Lu, J Zhang; (III) Provision of study materials or patients: H Long, B Zhang, J Zhang, Y Zhou, Y Li, G Zhang, P Zhang, Y Zhan, J Liao, S Luo, R Xiao, Y Su; (IV) Collection and assembly of data: Y Tang, J Zhao, F Wang, J Zhang, W Zhang, J Zhang; (V) Data analysis and interpretation: H Chen, M Sun, X Liu, Y Yu; (VI) Manuscript writing: All authors; (VII) Final approval of manuscript: All authors.
#These authors contributed equally to this work.
Correspondence to: Qianjin Lu. The 2nd Xiangya Hospital, #139 Renmin Middle Road, Changsha 410011, China. Email: [email protected].
Background: As the booming of deep learning era, especially the advances in convolutional neural networks (CNNs), CNNs have been applied in medicine fields like radiology and pathology. However, the application of CNNs in dermatology, which is also based on images, is very limited. Inflammatory skin diseases, such as psoriasis (Pso), eczema (Ecz), and atopic dermatitis (AD), are very easily to be mis-diagnosed in practice.
Methods: Based on the EfficientNet-b4 CNN algorithm, we developed an artificial intelligence dermatology diagnosis assistant (AIDDA) for Pso, Ecz & AD and healthy skins (HC). The proposed CNN model was trained based on 4,740 clinical images, and the performance was evaluated on experts-confirmed clinical images grouped into 3 different dermatologist-labelled diagnosis classifications (HC, Pso, Ecz & AD).
Results: The overall diagnosis accuracy of AIDDA is 95.80%±0.09%, with the sensitivity of 94.40%±0.12% and specificity 97.20%±0.06%. AIDDA showed accuracy for Pso is 89.46%, with sensitivity of 91.4% and specificity of 95.48%, and accuracy for AD & Ecz 92.57%, with sensitivity of 94.56% and specificity of 94.41%.
Conclusions: AIDDA is thus already achieving an impact in the diagnosis of inflammatory skin diseases, highlighting how deep learning network tools can help advance clinical practice.
Keywords: Deep learning; psoriasis (Pso); eczema (Ecz); atopic dermatitis (AD); artificial intelligence
Submitted Mar 09, 2020. Accepted for publication Mar 30, 2020. doi: 10.21037/atm.2020.04.39
View this article at: http://dx.doi.org/10.21037/atm.2020.04.39
Introduction
Inflammatory skin diseases refer to the skin disorder involving inflammatory cell infiltration and inflammatory cytokine dramatically elevated. Inflammatory skin diseases affect more than 1/5 human population in the worldwide. Inflammatory skin diseases include psoriasis (Pso), eczema (Ecz), and atopic dermatitis (AD), etc. Dermatologists
usually diagnose these diseases by “first impression” and then follow pathological analysis and laboratory tests to confirm the “first impression”. However, less experienced dermatologists and young dermatologists are particularly susceptible to errors since Pso, Ecz and AD are very easily to be misdiagnosed (Figure 1). To solve this problem and assist dermatologists, in this study, we developed an
AD
Typical
Atypical
[image:2.595.96.543.85.374.2]Ecz Pso
Figure 1 The images for Pso, AD, and Ecz. Pso, psoriasis; Ecz, eczema; AD, atopic dermatitis.
to-end deep learning model, which is based on clinical skin images, for automated diagnosis of Pso, Ecz and AD.
Convolutional neural networks (CNNs) have shown great power for the analysis of clinical images, and an increasing number of studies have reported promising results for CNNs in a variety of diseases. For example, CNNs have been applied to assist in the early diagnosis and detection of Alzheimer disease from brain electroencephalogram (EGG) spectral images and MRIs (1,2), to predict the risk of osteoarthritis from knee cartilage MRIs (3), for segmentation of multiple sclerosis lesions from multi-channel 3D MRIs (4), to diagnosis breast nodules and lesions from ultrasound images (5), and for the detection of diabetic retinopathy from retinal fundus photographs (6).
The development of CNNs in dermatology stem from the development of pioneering technologies for assisting in melanoma diagnosis (7,8). There are now multiple examples of AI tools facilitating cancer diagnosis based on data input from dermoscopes and from histological images of skin biopsy tissues (9-11). However, to the best of our knowledge, we are unaware of any applications of AI tools to assist in diagnosing skin diseases other than cancers.
Here, we report our development of a smartphone-based platform to assist the Pso, Ecz and AD diagnosis. In our study, Ecz and AD were assigned into one group based on the fact that these two diseases cannot be distinguished by their appearance solely but by the combination of laboratory test results and disease history (12).
Methods
Dataset
Our dataset (all images) comes from clinical images from the Department of Dermatology, The Second Xiangya Hospital, Central South University, China.
Data preparation
five-fold cross-validation to validate the effectiveness of our algorithm. In each fold, the validation set is a randomly chosen subset that contains around 20% of the cases. All images used in training and validation have been double checked and confirmed by experienced dermatologists (shown in Table 1).
All images are processed with the following procedures before they are stored in the database and for further experiments:
Step 1: data cleaning
Firstly, the originally collected images get managed into cases for future use. All the review and examination work (for example, delete duplicate case and remove blur/far-away images) will be executed by case instead of individual image after this step.
Step 2: data structuring and standardization
Secondly, the information of these cases need to be managed properly by an established structure and labeled with uniformed description language. We set a series standard description for both images and cases from different dimensions.
For each case, we set three parts of information to describe the case in detail.
Upload information: including name of who, date, and how to upload this case and which organization it belongs to, etc.
Case information: including case number/patient ID/ patient name/gender/original diagnosis, etc.
Review information: including review status and which expert give the final diagnosis.
For individual image, besides the case information, we also set two parts of information exclusively to describe the image in detail.
Disease information: including lesion description appear on each image and remark record from physicians, etc.
Picture information: including picture type, Secure Hash Algorithm 1 (SHA-1) number for each image, shooting time, picture size, etc.
Implementation details
We implemented our model with Pytorch 1.1. Our training and validation process was conducted via an 18 Core Intel® Xeon® CPU E5-2697 and 4 RTX 2080Ti NVIDIA GPUs.
Training algorithm
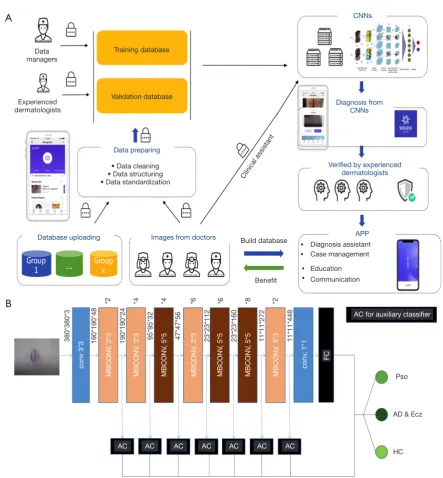
We utilized Google’s EfficientNet-b4 with pre-trained weights on ImageNet which achieved a 96.3% top-5 accuracy on the 2015 ImageNet dataset with 1,000 object categories of about 1.28 million images (13). The final fully-connected classification layer was replaced by with 3 output neurons. Besides, we also added 7 auxiliary classifiers at the end of each intermediate layer to make the model learn classification information from different levels of features. The modified model was retrained with our own dataset consisting of 4,740 dermatoscope images categorized in 3 classes.
Our modified EfficientNet-b4 architecture is shown in Figure 2. Data flow is from left to right: a skin image is put into the network and finally transformed into a probability distribution over clinical classes of skin disease using our modified EfficientNet-b4 architecture.
[image:3.595.47.553.99.195.2]The deep learning framework of our network is implemented via using Pytorch. A global learning rate of 0.01 is used initially and it decays by 0.1 every 20 epochs. We use mini-batch gradient descent with momentum 0.9 as model parameters optimizer. During training, each image is resized to 380×380 pixels in RGB channels which is the optimized input size of EfficientNet-b4. For each epoch, each image will be rotated from −30 degrees to 30 degrees randomly, together with 50% probabilities for vertical and Table 1 The images for 3 categories
Categories Fold_1 (Cases/images) Fold_2 (Cases/images) Fold_3 (Cases/images) Fold_4 (Cases/images) Fold_5 (Cases/images)
T V T V T V T V T V
Pso 532/715 133/157 532/698 133/174 532/708 133/164 532/662 133/210 532/705 133/167
AD & Ecz 759/2,617 190/709 759/2,751 190/575 759/2,646 190/680 759/2,672 190/654 759/2,618 189/708
Healthy –/433 –/109 –/433 –/109 –/434 –/108 –/434 –/108 –/434 –/108
Figure 2 Smartphone platform and deep learning CNN layout. (A) The smartphone platform workflow for AIDDA. (B) The EfficientNet-b4 architecture was applied in our training and validation. CNN, convolutional neural network; AIDDA, artificial intelligence dermatology diagnosis assistant.
horizontal flipping.
ROC curve
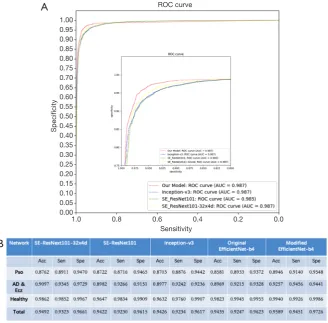
We draw ROC curves with sensitivity as x-axis and specificity as y-axis as shown in Figure 3A, which shows the average performance of the five-fold models on the entire
dataset. ROC curves represent the relation between true positive rate (TPR) and false positive rate (FPR). The area under the raw current curves (AUC) is obtained to reflect the overall accuracy of each model. Though the AUC of these different model is similar, our model has advantage in high sensitivity range.
TPR = true positive/true positive + false negative = sensitivity
Diagnosis assistant Case management Clinical assistant
APP Verified by experienced
dermatologists Diagnosis from
CNNs
Data preparing
• Data cleaning • Data structuring • Data standardization Experienced
dermatologists
Training database
Validation database Data
managers
CNNs
Database uploading Images from doctors
Education Communication Build database
Benefit
A
Pso
HC
AC AC AC AC AC AC AC
AC for auxiliary classifier
FC
380*380*3 190*190*48 190*190*24 47*47*56 23*23*112 23*23*160 11*11*272 11*11*448
*2
*8
*6
*6
*4
*4
*2
conv
, 1*1
95*95*32
AD & Ecz
MBCONV
, 3*3
MBCONV
, 5*5
MBCONV
, 5*5
MBCONV
, 5*5
MBCONV
, 3*3
MBCONV
, 3*3
MBCONV
, 3*3
conv 3*3
1.00 0.95 0.90 0.85 0.80 0.75 0.70 0.65 0.60 0.55 0.50 0.45 0.40 0.35 0.30 0.25 0.20 0.15 0.10 0.05 0.00
1.0 0.8 0.6 0.4 0.2 0.0
Specificity
Sensitivity ROC curve
A
[image:5.595.136.465.84.407.2]B
Figure 3 Performance of CNNs for the validation. (A) ROC curves with sensitivity as x-axis and specificity as y-axis. The ROC curves and the AUC value of our model, Inception V3, SE_ResNet101, and SE_ResNeXt101-32x4d have been shown. (B) The accuracy, specificity and sensitivity of the validation task results are shown in the following table (n=50); Acc, accuracy; Sen, sensitivity; Spe, specificity; CNN, convolutional neural network; AUC, area under the raw current curves.
FPR = false positive/false positive + true negative = 1− specificity
Inference algorithm
The raw output of our classifiers (7 auxiliary classifiers plus 1 final classifier) is summarized by 3 classification neurons. And then argmax is used to find the most likely classification of the input image. The formula is as follows:
_
1
(Classifiers number i) i
classification argmax output
=
=
∑
Where outputi is a 3-dimensional classification vector, and the sum of 8 classification vectors is the element-wise sum.
The formula of sensitivity, specificity and accuracy
Sensitivity = true positive/positive
Specificity = true negative/negative
Accuracy = (true positive + true negative)/(positive + negative) In multi categories, sensitivity and accuracy is more important to show.
Confusion matrices
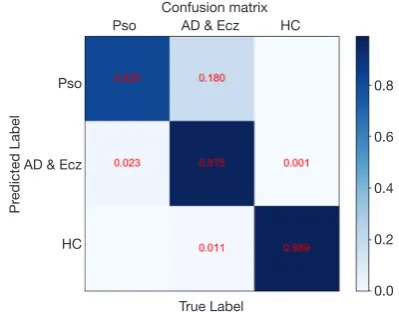
The confusion matrix of our method over the 3 classes of validation strategy. Confusion matrices for the CNN for the test task reveal that CNN confuses AD & Ecz with Pso.
Use of human subjects
obtained from the patients for publication of this study and any accompanying images. A copy of the written consent is available for review by the Editor-in-Chief of this journal.
Results
The preparation of artificial intelligence dermatology
diagnosis assistant (AIDDA)
This platform, AIDDA (Figure 2A), has image-based diagnostic functionality based on a CNN model EfficientNet (https://github.com/lukemelas/EfficientNet-PyTorch.git). EfficientNets are a family of image classification models, developed based on AutoML and compound scaling. A simple yet higly effective compound scaling method is proposed to scale up a mobile-size baseline network for better performance while maintaining its efficiency. EfficientNets achieve state-of the art accuracy on ImageNet and five commonly used transfer learning datasets (13,14), yet having an order-of-magnitude fewer parameters and FLOPS than previous networks. Considering the speed-accuracy trade-off, we chose EfficientNet-b4 as backbone for this skin diseases classification assignment. As the experiment shows, it outperforms other ConvNets including SE-ResNeXt101-32x4d, SE-ResNet101 (15) and Inception-v3 (16).
In this study, we collected skin images from healthy people and patients with Pso, AD and Ecz (Figure 1, Table 1) from the Second Xiangya hospital, Central South University, China. The great majority of images were from typically exposed skin areas like the face and hands. Our dataset was composed of 4,740 dermatologist-labelled images in 3 categories, namely Pso, AD & Ecz, and healthy. We validated the effectiveness of the algorithm using five-fold cross-validation. Therefore, we splitted our dataset into five parts by case. Each part was a disjoint subset of whole dataset. We used stratified sample method to ensure that the proportions of samples in every category are similar to those in the origin dataset.
The selection of CNN models based on ROC analysis
The ROC curves of our model, Inception V3, SE_ ResNet101, and SE_ResNeXt101-32x4d have been shown in Figure 3A. It shows the average performance of the five-fold models on the entire dataset. ROC curves represent the relation between TPR and FPR. The AUC is obtained to reflect the overall accuracy of each model.
AUC for our model, Inception V3, SE_ResNet101, and SE_ResNeXt101-32x4d are 0.987, 0.987, 0.985 and 0.987, separately. The sensitivity and specificity for our model, Inception V3, SE_ResNet101, and SE_ResNeXt101-32x4d are 97.26% with 95.89%, 96.17% with 94.26%, 96.15% with 94.22%, and 96.61% with 94.92%. Though the AUC of these different model is similar, our model has advantage in high sensitivity and high specificity.
The performance of CNN on inflammatory disease diagnosis
The developed CNN model was used to perform diagnosis for each image among the 3 given categories. As a result, our model had an overall accuracy of 95.80%±0.09%, with the sensitivity of 94.40%±0.12% and specificity 97.20%±0.06% (mean ± SD). As shown in Figure 3B, CNN showed accuracy for Pso is 89.46%, with sensitivity of 91.4% and specificity of 95.48%, and accuracy for AD & Ecz 92.57%, with sensitivity of 94.56% and specificity of 94.41%. For healthy skin (HC), the accuracy is even higher. It was 99.40% with the sensitivity of 99.26% and specificity of 99.86%.
T-SNE analysis and confusion matrix
We also examined the internal features learned by the CNN using t-distributed stochastic neighbor embedding (T-SNE). In these visualizations, each point represents a skin lesion image from the validation set, and each cluster shows the similar clinical features which are belong to one of the 3 categories (Figure 4). The 3 easily distinguishable clusters clearly represent the 3 dermatologist-determined categories. We also present a confusion matrix as shown in Figure 5, where the developed model confused a little on AD & Ecz image with Pso (18% possibility).
Conclusions
process of diagnosis within easy reach.
In this study, we demonstrate that deep learning can be effectively applied in dermatology outside of melanoma diagnosis. In particular, our work highlights that CNNs are able to differentiate amongst multiple diseases with skin conditions like Pso, AD & Ecz. Our AIDDA smartphone APP for this CNN is publicly available to all doctors in
China, and more than 7,000 doctors have already registered this application. User data suggests that more than 100,000 doctor-taken images have been input into the app to help in the diagnosis process, so AIDDA is clearly already having an impact in the health system. This tool helps with diagnosis and can help prevent omission, and AIDDA should be especially helpful for inexperienced younger doctors and doctors in under-developed areas. Its ongoing application will continue to test the performance of this CNN in real-world practice, and we anticipate future improvements which should improve its diagnostic accuracy, selectivity, and specificity. Furthermore, AIDDA with results from biopsy and laboratory test may facilitate it as a more arcuate diagnostic tool, which has been proven in pediatric clinical study (19). Given that our system achieves a comparable or apparently superior performance to dermatologists for diagnosing inflammatory diseases, it seems obvious that smartphones enabled with deep learning network-developed APPs will continue to benefit doctors in real-world clinical practice in dermatological and likely many other types of human disorders.
Acknowledgments
Funding: This work was supported by the National Natural Science Foundation of China (No. 81830097, No. 81972943, No. 81861138016), the Key Research and Development Program of Hunan province (2018XK2304) and Hunan Talent Young Investigator (No. 2019RS2012).
Footnote
Conflicts of Interest: All authors have completed the ICMJE
uniform disclosure form (available at http://dx.doi. org/10.21037/atm.2020.04.39). The authors have no conflicts of interest to declare.
Ethical Statement: The authors are accountable for all aspects of the work in ensuring that questions related to the accuracy or integrity of any part of the work are appropriately investigated and resolved. All human studies were approved by the ethics committee of the Second Xiangya Hospital of Central South University (No. GF2017040177). Written informed consent was obtained from the patients for publication of this study and any accompanying images.
Open Access Statement: This is an Open Access article
T-SNE Embedding for ValSet in Fold-4
HC Pso
[image:7.595.69.257.84.243.2]AD & Ecz
Figure 4 t-SNE visualization of clusters in the CNN for 3 categories. The trained CNN’s internal representation of 3 disease classes in fold-4 by applying t-SNE, a method for visualizing high-dimensional data, to the last hidden layer representation (1792-D vector) in the EfficientNet-b4. Colored point clouds represent the different disease categories, showing how the algorithm clusters the diseases. CNN, convolutional neural network.
Pso
Pso
HC
HC
AD & Ecz
0.8
0.6
0.4
0.2
0.0 AD & Ecz
Confusion matrix
Pr
edicted Label
True Label
[image:7.595.65.265.369.525.2]distributed in accordance with the Creative Commons Attribution-NonCommercial-NoDerivs 4.0 International License (CC BY-NC-ND 4.0), which permits the non-commercial replication and distribution of the article with the strict proviso that no changes or edits are made and the original work is properly cited (including links to both the formal publication through the relevant DOI and the license). See: https://creativecommons.org/licenses/by-nc-nd/4.0/.
References
1. Bi X, Wang H. Early Alzheimer's disease diagnosis based on EEG spectral images using deep learning. Neural Netw 2019;114:119-35.
2. Brosch T, Tam R, Initiative for the Alzheimers Disease Neuroimaging. Manifold learning of brain MRIs by deep learning. Med Image Comput Comput Assist Interv 2013;16:633-40.
3. Prasoon A, Petersen K, Igel C, Lauze F, Dam E, Nielsen M. Deep feature learning for knee cartilage segmentation using a triplanar convolutional neural network. Med Image Comput Comput Assist Interv 2013;16:246-53.
4. Brosch T, Tang LY, Youngjin Yoo, et al. Deep 3D Convolutional Encoder Networks With Shortcuts for Multiscale Feature Integration Applied to Multiple Sclerosis Lesion Segmentation. IEEE Trans Med Imaging 2016;35:1229-39.
5. Cheng JZ, Ni D, Chou YH, et al. Computer-Aided Diagnosis with Deep Learning Architecture: Applications to Breast Lesions in US Images and Pulmonary Nodules in CT Scans. Sci Rep 2016;6:24454.
6. Gulshan V, Peng L, Coram M, et al. Development and Validation of a Deep Learning Algorithm for Detection of Diabetic Retinopathy in Retinal Fundus Photographs. JAMA 2016;316:2402-10.
7. Esteva A, Kuprel B, Novoa RA, et al. Dermatologist-level
classification of skin cancer with deep neural networks.
Nature 2017;542:115-8.
8. Haenssle HA, Fink C, Schneiderbauer R, et al. Man against machine: diagnostic performance of a deep learning
convolutional neural network for dermoscopic melanoma recognition in comparison to 58 dermatologists. Ann Oncol 2018;29:1836-42.
9. Masood A, Al-Jumaily AA. Computer aided diagnostic support system for skin cancer: a review of techniques and algorithms. Int J Biomed Imaging 2013;2013:323268. 10. Burroni M, Corona R, Dell'Eva G, et al. Melanoma
computer-aided diagnosis: reliability and feasibility study. Clin Cancer Res 2004;10:1881-6.
11. Erickson BJ. Machine Learning: Discovering the Future of Medical Imaging. J Digit Imaging 2017;30:391.
12. Fishbein AB, Silverberg JI, Wilson EJ, et al. Update on Atopic Dermatitis: Diagnosis, Severity Assessment, and Treatment Selection. J Allergy Clin Immunol Pract 2020;8:91-101.
13. Tan M, Le Quoc V. EfficientNet: Rethinking Model
Scaling for Convolutional Neural Networks. ICML, 2019. 14. Russakovsky O, Deng J, Su H, et al. Imagenet large
scale visual recognition challenge. Int J Comput Vis 2015;115:211-52.
15. Hu J, Shen L, Albanie S, et al. Squeeze-and-Excitation Networks. Proceedings of the IEEE conference on computer vision and pattern recognition 2018:7132-41. 16. Szegedy C, Vanhoucke V, Ioffe S, et al. Rethinking the inception architecture for computer vision. Proceedings of the IEEE conference on computer vision and pattern recognition 2016:2818-26.
17. Bain EE, Shafner L, Walling DP, et al. Use of a Novel
Artificial Intelligence Platform on Mobile Devices to
Assess Dosing Compliance in a Phase 2 Clinical Trial in Subjects With Schizophrenia. JMIR Mhealth Uhealth 2017;5:e18.
18. Shao J, Xue S, Yu G, et al. Smartphone-controlled optogenetically engineered cells enable semiautomatic glucose homeostasis in diabetic mice. Sci Transl Med 2017. doi: 10.1126/scitranslmed.aal2298.
19. Liang H, Tsui BY, Ni H, et al. Evaluation and accurate
diagnoses of pediatric diseases using artificial intelligence.
Nat Med 2019;25:433-8.