Temperature Monitoring in Home Automation System using
Predictive Analytics & IOT
Aman Jatain
Department of Computer Science, Amity University, Haryana, India amanjatainsingh@gmail.com
*Corresponding Author: amanjatainsingh@gmail.com, Tel.: +91-9711050859
Abstract— A technology keeps on enabling our ability to perform analytics with „Internet of Things‟ (IOT) has emerged as an area where devices capture and transmit information. IOT is currently an evolving field and lot of research has been carried out in this regard and research indicates that predictive analytics with IOT is the most disruptive technology in the current era. Predictive analytics is being used in many applications such as healthcare, finance, marketing, smart home and analytics. The process of predictive analytics on IOT offers the flexibility of implementing the latest hardware by making certain changes to the dataset created by the previous generation hardware. In the home this digital explosion and access to the information is presently during the time spent being reached out to devices such as refrigerator, stoves, oven etc. The paper addresses the issues related to household devices those connected to the internet concerning their poor settings and suggesting the optimal results. The concept of predictive analytics is used to facilitate the most optimal setting by the templates which are created personally based on the sensor data received from various sensors implanted into home appliances. This paper also discusses challenges faced and value points during use of predictive analytics in IOT, while utilizing the huge dataset generated by IOT devices to ease the daily day to day task and accomplish the motive of smart home automation.
Keyword: Arduino, Association, Internet of things, Predictive Analytics, Rule Mining, Temperature, Smart Home.
1. INTRODUCTION
The predictive analytics on IOT is the branch of predictive analytics dealing with the prediction involved with the setting of Internet of Things (IOT) appliances. The predictive analytics on IOT works with the help of data gathered by various specialized sensors implanted at places where IOT devices must function and helps in creating the data set which act as an input to the predictor. The process of predictive analytics on IOT helps us in achieving the goal of home automation and makes the things lot easier to implement, it offers the flexibility of implementing the latest hardware by making certain changes to the dataset created by the previous generation hardware [23]. Apart from the data generated by the IoT one should make separate table to store the data generated by the sensors which act as the catalyst to the process of predictive analytics. Predictive analytics makes use of various statistical and analytical technique to predict the setting used by the IOT devices. It makes use of machine learning to make the process of prediction lot easier. IOT is currently an evolving field and lot of research has been carried out in this regard [14]. Data mining along with predictive analytics is the most disruptive technology in the current era that involves preparation, mining, presentation and revolves around the theory of statistics, probability, and knowledge discovery [1]. The architecture of the predictive analytics is divided into 3 parts: i) Knowledge View- Here the data collection part is done by the user and sensor. The data collected is stored in the form of representation maps and the knowledge cycle. The cycle is segregated with the help of artificial intelligence. The outlier analysis and time series analysis are done at this stage to make sure that
gathered information is of high quality. ii) Technique View – In this view pre-discovered techniques are applied which are properly scrutinized so that the result obtained is of high quality. Machine learning is used to optimize the technique so that the knowledge is consistent, and the outliers are minimum. iii) Application View -This view generally includes the applications or the task that must be performed on the database [2].
significant effect on the lives of billions of individuals. The proposed system maintains simplicity, cost benefit and security benefit at all the stages or levels of the implementation.
2. RELATEDWORK
Leading researchers across academia and industries have chosen Internet of Things (IoT) to design efficient smart homes and it attracted a lot of attention these days. The focus of most of the researcher is energy management. This section of the paper discusses the research related to predict the temperature. The problem of using predictive analytic and machine learning for temperature control is not a novel concept in research. Some of the researcher used predictive analytics in combination with various techniques to control temperature in buildings and office. Mba et. al [7] used artificial neural network to predict air temperature and humidity for one month in advance, so that energy consummation can be reduced for air conditioning in buildings. Marvuglia et. al [8] coupled neural networks and fuzzy logic controller for temperature regulation in office buildings. Moreno et. al [9] forecasted for energy efficiency operation to analyse the potential benefits of the extracted information from the sensed data in smart buildings. Spencer et. al [10] emphasised on the effective selection of sensors to regulate temperature in smart buildings and in [11] introduced a refinement of lasso regression to forecast temperature in smart buildings with a purpose to improve forecast accuracy. Matsui [12] proposed a provision system to maintain temperature and other home comfortable parameters by extracting data from IoT sensors to reduce electricity consumption and providing comfort in smart homes. Quinn et. al [13] predicted heat exposure risk in smart homes during heat events and suggested that there is urgent need to improve indoor temperature and humidity. After analysing the research in literature, there is a possibility to notice a gap where indoor temperature is not predicted considering an IoT context or external parameters.
3.DESIGNANDIMPLEMENTATION
The process of predictive analytics can help in achieving the goal of smart home automation as well as holds its significance in almost all applications of IoT. The IoT devices become smart only when the appliances connected to the internet becomes capable of taking its own decision. The proper integration between predictive analytics and IoT can become the next disruptive technology to rule over in the next decades. The process not only makes the huge amount of data generates by the IoT devices into correct use but also helps us in making the things connected to the internet smarter. The productivity of IoT appliances increases multi fold when combined with predictive analytics.
The proposed system can be implemented in all the systems working for introducing assisted living. The concept of assisted living will have a significant effect on the lives of billions of individuals. The proposed system maintains
simplicity, cost benefit and security benefit at all the stages or levels of the implementation. The detail of temperature, intensity and various other parameters is sent from the sensor to the server that contains database and the algorithm/tool used for predictive analytics. The temperature is displayed on the website in form of table, bar graph and charts. The website contains a login panel so only authenticated person could access the site.
3.1 Proposed System Module
The proposed system is broadly classified into 2 modules based on implementation. The modules of the proposed systems are:
I. IoT module – The IoT module deals with the sensor connection, internet settings, module settings and the IoT architecture to be followed. The hardware aspect of the system is taken care by the IoT module. This module also ensures transport layer security, encryption and the query which are directed towards the sensor or the controller. The module is responsible for working at the frontend to make the task of establishing an interface between database, predictive analytics algorithm and the IoT devices easier.
[image:2.612.385.562.511.650.2]II. Predictive analytics module – The predictive analytics module deals with the analytical part of the project. The decision making and self-tuning ability of the system is attained at this stage. The module is also responsible for tracking all the changes made to the controller and the values gathered by sensors mounted on to the controller. The module also helps in making alterations according to the need of the application where the system is used. The modules ensure that dataset is properly trained and analysed before suggesting a conclusion. To improve the accuracy of the process the conclusions are also formed into clusters and classified using naïve Bayes.
Figure 3.2: Components of predictive analytics module
database which is also accessed by the Android application.
Figure 3.3 Flow of the proposed system
Three sensors are also used here: the temperature sensor collects the neighbouring temperature data; the GPS sensor collects the physical coordinates of the location of device and the luminosity sensor collects the data about the intensity of the light in the surrounding. All the data collected is in analog form. From the cloud database the website picks up the data and applies the algorithm to it and returns the refined value to the cloud database. From cloud database the value is then accessed by the controller to take desired actions. The flow of proposed system is summarized in figure 3.3, that explains where the data is originated and where the data gets at last to complete the functionality of the system. The main objective of the system is “controlling of speed of the motor”, which is achieved after following processes:
First the temperature sensor LM-35 gathers the temperature in the environment in form of analog signals. It gathers the temperature in degree Celsius measurements.
Then the Arduino UNO controller via a connection wire receives the input of temperature from the temperature sensor LM-35. The sensor collects the surrounding temperature value with an accuracy of 70%. The controller then converts the analog input received from temperature sensor and sends the digital temperature reading to the database server. It sends the data reading of temperature to the database server using the services of the Ethernet shield which is mounted on the top the Arduino Uno microcontroller. Internally the microcontroller after connecting with the networks makes an API call to a php file. In that php file their runs a MySQL insert queries which
inserts the data in the table created in the database server.
After the API call is made to the php file, the data of temperature value gets inserted into the database table. From the website we access the temperature data from Open Weather API and store the same in the database.
The website then accesses the temperature data stored in the cloud database server. The website gets the data using AJAX call made to a PHP file that gets the data from the cloud-based database server.
Then the predictive analytics algorithm is applied to the values present in the database. The php file is used to implement the predictive analytics algorithm. The file gathers the temperature data from the database and feds the values to the inputs to the algorithm which then runs the algorithm and sends the output to the database.
The website then gathers the data on which the algorithm is applied. The data is gathered using AJAX call to the php file.
Then the value after applying the algorithm is sent to the Arduino controller. The value is received using the call to a PHP file. Then the controller receives the data from the database server by making a GET call to the php file that returns the controller with the requested data from the cloud-based database server.
The Arduino controller then after receiving the values from the database controls the speed of the motor using the L298N dual h bridge motor controller module.
4. RESULTSANDDISCUSSION
The algorithm for performing building dataset for the predictive analytics algorithm is as follows –
i. In the first step database is built from the data captured from the sensor implanted at the application area.
ii. In this step the database captures values from open weather API which can be used to find the pattern of usage.
iii. The next step is to find the average variation in the database which is (T1 - T2).
iv. The distance is measured from the average variance. The distance calculated is then arranged in ascending order for cluster formation.
v. The output in previous step is categorized into 3 clusters with the midpoint as min value of output, mid value of output and the max value of the output.
vi. The minimum distance from each centroid is looked upon to find the appropriate positions of the element and to find the outliers.
viii. The implementation of the above algorithm is shown in table table 4.1 and table 4.2. As the dataset was huge so for the demonstration purpose the dataset of 3 days is taken into consideration.
ix. The last step is not shown in the tables as the last step consists of conclusive statement gathering phase which helps in forming an if-else ladder for the program. There are 3 clusters formed around min, max and the median. The last step in the process is the formation of answers to the prospective questions. The process also has a mechanism to remember incorrect decision taken so that the system can be modified accordingly. The predictive algorithm is thus completed at this stage.
The home screen of the web controller shown in figure 4.1 provides user with the details about the system and the current setting being used in the web controller. Here, the temperature control provides with various options along with the interface showing the current temperature settings and the lux controller helps us in viewing and adjusting the light conditions of the system.
Figure 4.1: Screen Shot of the system
The android controller provides a similar interface as web along with some added features such as analytical graph and usage patterns. The snapshot of the developed app is shown in figure 4.3.
Figure 4.3: Developed Android App
[image:4.612.93.521.507.737.2]The proposed system creates an own category of IoT appliances which are efficient as well as can take their own decisions. The system defines a unique combination of predictive analytics and IoT which will change the way we use IoT appliances soon- As the system is unique in its category it is the sole option available to the user to implement the predictive analytics on IoT.
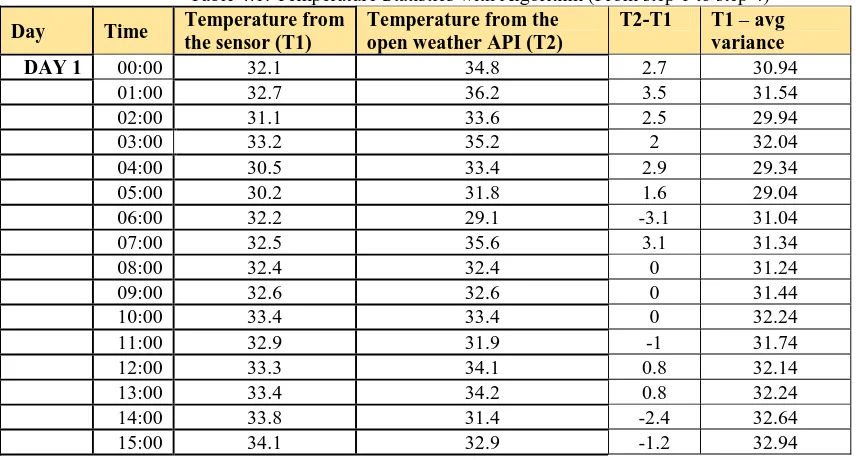
Table 4.1: Temperature Statistics with Algorithm (From step 1 to step 4)
Day Time Temperature from the sensor (T1)
Temperature from the open weather API (T2)
T2-T1 T1 – avg variance
DAY 1 00:00 32.1 34.8 2.7 30.94
01:00 32.7 36.2 3.5 31.54
02:00 31.1 33.6 2.5 29.94
03:00 33.2 35.2 2 32.04
04:00 30.5 33.4 2.9 29.34
05:00 30.2 31.8 1.6 29.04
06:00 32.2 29.1 -3.1 31.04
07:00 32.5 35.6 3.1 31.34
08:00 32.4 32.4 0 31.24
09:00 32.6 32.6 0 31.44
10:00 33.4 33.4 0 32.24
11:00 32.9 31.9 -1 31.74
12:00 33.3 34.1 0.8 32.14
13:00 33.4 34.2 0.8 32.24
14:00 33.8 31.4 -2.4 32.64
Day Time Temperature from the sensor (T1)
Temperature from the open weather API (T2)
T2-T1 T1 – avg variance
16:00 33.8 31.2 -2.6 32.64
17:00 33.7 32.6 -1.1 32.54
18:00 32.9 33.2 0.3 31.74
19:00 33.8 34.5 0.7 32.64
20:00 34.6 36.1 1.5 33.44
21:00 33.9 37.8 3.9 32.74
22:00 34.1 35.2 1.1 32.94
23:00 34.3 32.8 -1.5 33.14
DAY 2 00:00 34.8 31.3 -3.5 33.64
01:00 35.9 37.6 1.7 34.74
02:00 34.1 35.2 1.1 32.94
03:00 33.9 34.5 0.6 32.74
04:00 34.9 35.6 0.7 33.74
05:00 35.3 33.7 -1.6 34.14
06:00 32.7 31.2 -1.5 31.54
07:00 33.9 34.5 0.6 32.74
08:00 34.5 31.1 -3.4 33.34
09:00 35.6 32.9 -2.7 34.44
10:00 33.2 36.5 3.3 32.04
11:00 30.1 33.3 3.2 28.94
12:00 33.8 32.1 -1.7 32.64
13:00 34.8 31.8 -3 33.64
14:00 31.6 32.4 0.8 30.44
15:00 32.9 31.3 -1.6 31.74
16:00 30.6 33.9 3.3 29.44
17:00 29.4 30.7 1.3 28.24
18:00 30.4 34.5 4.1 29.24
19:00 31.2 33.1 1.9 30.04
20:00 31.7 33.3 1.6 30.54
21:00 30.4 34.8 4.4 29.24
22:00 32.4 35.5 3.1 31.24
23:00 33.1 36.8 3.7 31.94
DAY 3 00:00 33.9 37.1 3.2 32.74
01:00 34.5 36.7 2.2 33.34
02:00 32.5 31.3 -1.2 31.34
03:00 31.6 33.9 2.3 30.44
04:00 33.2 33.5 0.3 32.04
05:00 32.6 29.2 -3.4 31.44
06:00 31.7 29.4 -2.3 30.54
07:00 30.5 28.9 -1.6 29.34
08:00 29.8 32.4 2.6 28.64
09:00 30.3 34.8 4.5 29.14
10:00 33.8 31.3 -2.5 32.64
11:00 31.4 38.8 7.4 30.24
12:00 32.5 36.5 4 31.34
13:00 33.8 35.7 1.9 32.64
14:00 32.1 32.3 0.2 30.94
15:00 31.4 30.8 -0.6 30.24
16:00 32.4 30.4 -2 31.24
17:00 31.3 34.2 2.9 30.14
Day Time Temperature from the sensor (T1)
Temperature from the open weather API (T2)
T2-T1 T1 – avg variance
19:00 33.1 32.3 -0.8 31.94
20:00 34.6 36.7 2.1 33.44
21:00 33.1 35.4 2.3 31.94
22:00 34.5 36.7 2.2 33.34
23:00 35.7 35.3 -0.4 34.54
[image:6.612.95.522.199.742.2]Avg Variance 1.169
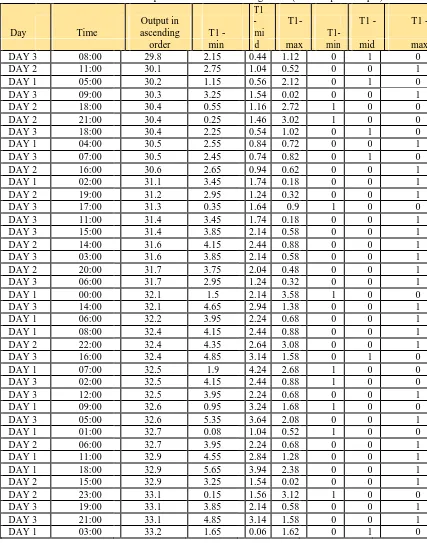
Table 4.2: Temperature Statistics with Algorithm (From step 4 to step 8)
Day Time
Output in T1
- T1- T1 - T1 - ascending
order
T1 - min
mi d
max
T1-min
mid
max
DAY 2 10:00 33.2 2.95 1.24 0.32 0 0 1 DAY 3 04:00 33.2 0.65 1.06 2.62 1 0 0 DAY 1 12:00 33.3 0.55 2.26 3.82 1 0 0 DAY 1 10:00 33.4 0.45 1.26 2.82 0 1 0 DAY 1 13:00 33.4 1.25 0.46 2.02 0 1 0 DAY 1 17:00 33.7 1.75 0.04 1.52 0 1 0 DAY 1 14:00 33.8 0.45 1.25 2.81 1 0 0 DAY 1 16:00 33.8 2.45 0.74 0.82 0 1 0 DAY 1 19:00 33.8 3.15 1.44 0.12 0 0 1 DAY 2 12:00 33.8 3.95 2.24 0.68 0 0 1 DAY 3 10:00 33.8 4.55 2.84 1.28 0 0 1 DAY 3 13:00 33.8 2.55 0.84 0.72 0 1 0 DAY 1 21:00 33.9 1.65 0.06 1.62 0 1 0 DAY 2 03:00 33.9 3.25 1.54 2.09 0 1 0 DAY 2 07:00 33.9 2.65 0.94 0.61 0 0 1 DAY 3 00:00 33.9 1.75 0.04 1.52 0 1 0 DAY 1 15:00 34.1 0.55 1.16 2.72 1 0 0 DAY 1 22:00 34.1 0.15 1.86 3.42 1 0 0 DAY 2 02:00 34.1 0.35 1.36 2.92 0 1 0 DAY 1 23:00 34.3 3.85 2.14 0.58 0 0 1 DAY 2 08:00 34.5 1.45 0.26 1.82 0 1 0 DAY 3 01:00 34.5 2.55 0.84 0.72 0 1 0 DAY 3 22:00 34.5 3.85 2.14 0.58 0 0 1 DAY 1 20:00 34.6 2.15 0.44 1.12 0 1 0 DAY 3 20:00 34.6 1.45 0.26 1.82 0 1 0 DAY 2 00:00 34.8 2.45 0.74 0.82 0 1 0 DAY 2 13:00 34.8 1.35 0.36 1.92 0 1 0 DAY 2 04:00 34.9 0.45 1.26 2.82 1 0 0 DAY 2 05:00 35.3 3.15 1.44 0.12 1 0 0 DAY 2 09:00 35.6 4.65 2.94 1.38 0 0 1 DAY 3 23:00 35.7 3.15 1.44 0.12 0 0 1 DAY 2 01:00 35.9 4.55 2.84 1.28 0 0 1
Average
31.666 5.75 4.04 2.48 0 0 1
Min / Max /
Median
MIN 29.95
Median 31.66
MAX 33.22
5. CONCLUSIONANDFUTURESCOPE
To maintain a comfortable home conditions, home automation is a buzzword. The types of comforts in automated home can be classified according to thermal comfort i.e temperature and humidity, visual comfort that includes colours and light, and breathing quality. An IOT based system can be used to monitor these attributes and maintain a comfortable range. For this purpose, different type of data is collected and then several commands are executed. The proposed system is made from high quality sensorswhich have inbuilt accuracy control mechanism and can operate over wide range of inputs. In future, the scope of predictive analytics on IoT can be widened and the unexplored applications along with exceptional quality
sensors can be taken into utilization. Also, to improve the security and privacy of the data collected by the server, as per the application the proposed system can be hosted in a private server accessible by the small group of people.
REFERENCES
[1] Lutu, P.E., Engelbrecht, A.P., (2010), “A decision rule-based method for feature selection in predictive data mining”, Expert Systems with Applications. 37(1), pp.602-609.
[3] Min Woo W., Jong Whi L., Kee Hyun P. (2018), “A reliable IoT system for personal healthcare”, Future generation computer system. 78(2), pp. 626-640(2018). [4] Ravi Kishore K. Vishal J., Suvadeep B., Lakshmi B,
(2016), “IoT Based Smart Security and Home Automation System”, In: International Conference on Computing, Communication and Automation. pp. 1286-1289.
[5] Lalit Mohan S., Samir Kumar B., Nihar M (2018), “Arduino based home automation using Internet of things (IoT)”, International Journal of pure and applied mathematics. 118(17). pp.769-788.
[6] John S. (2017), “Building Blocks for IoT Analytics Internet-of-Things Analytics”, River Publishers Series in Signal, Image and Speech Processing. Denmark, 978-87-93519-04-6.
[7] Mba L. Meukam P., Kemajon A (2016), “Application of artificial neural network for predicting hourly indoor air temperature and relative humidity in modern building in humid region”, Journal of Energy and Building, 121(1), pp. 32-42
[8] M. Arvuglia A., Messineo A., Nicolosi G (2014), “Coupling a neural network temperature predictor and a fuzzy logic controller to perform thermal comfort regulation in an office building”, Journal of Buildings and Environment, 72, pp. 287-299.
[9] Moreno V., Skarmeta F., Venturi A., Sachmidt M., Sachmidt M., Schuelke A, (2015), “Context sensitive indoor temperature forecast for energy efficient operation of smart buildings. In: 2nd World Forum on Internet of Things (WF-Iot), IEEE, pp. 705-710. [10]Spencer B., Al-Obeidat F (2017), “Selecting sensors
when forecasting temperature in smart buildings”, Procedia Computer Science. 109, pp. 777-784.
[11]Spencer B., Al-Obeidat F. (2018), “A refinement of Lasso Regression applied to temperature fore-casting”, Procedia Computer Science. 130, pp. 728-735.
[12]Matsui K. (2018) “An information provision system to promote energy conservation and maintain indoor comfort in smart homes using sensed data by IoT sensors”, Future Generation Computing System. 82, pp. 388-394.
[13]Quinn A., Tamerius J.D., Perzanowski M., Jacobson J. S., Goldstein I., Acosta L., Sharma J. Predicting indoor heat exposure risk during extreme heat events. The Science of Total Environment. 490, pp. 686-693. [14]T Taneja, A. Jatain and S. Bajaj (2017), “Predictive