Volume 2, No. 1, Jan-Feb 2011
International Journal of Advanced Research in Computer Science RESEARCH PAPER
Available Online at www.ijarcs.info
Text-To-Speech Synthesis System for Kannada Language
D.J. Ravi
Sudarshan PatilKulkarni
Assistant Professor, JSS Research Foundation
Department of Electronics and Communication SJ College of Engg., Mysore, India. *
Research Scholar, JSS Research Foundation
Department of Electronics and Communication SJ College of Engg.,Mysore, India.
[email protected] [email protected]
Abstract: This paper presents the implementation details of a good quality, Kannada Text-To-Speech System (KTTS) that is phoneme-based, direct waveform concatenation easy to set up and use with little memory. Most existing TTS systems are unit-selection based, which use standard speech databases available in neutral adult voices. Prosody had also been incorporated. The incorporation of emotional features into speech can greatly improve the performance (naturalness) of speech synthesis system. Since emotional speech can be regarded as a variation on neutral (non-emotional) speech, it is expected that a robust neutral speech model can be useful in contrasting different emotions expressed in speech. Major elements such as duration, pitch and stress are presented as the main acoustic correlates of emotion in human speech. This inexpensive TTS system was implemented in MATLAB, with the synthesis presented by means of a graphical user interface. The quality of the synthesized speech was evaluated using the Mean opinion score (MOS).
Keywords: Kannada Text-to-speech (KTTS); Direct wave concatenation; Prosody; Unit-selection based; Mean opinion score (MOS).
I. INTRODUCTION
There are various critical factors to be considered while designing a TTS system that will produce intelligible speech. The first crucial step in the design of any concatenative TTS system is to select the most appropriate units or segments that result in smooth concatenation. Speech synthesized with phonemes as units is intelligible when each phoneme is represented by several allophones in the segment database. Different emotions and speaker characteristics could be implemented with such a database.
Duration is one of the prosodic features of speech, the other two being stress (intensity) and intonation (pitch). Generating prosodic features from text is one of the most difficult problems faced by current TTS systems. Most TTS systems generate prosodic features by rules, based on the linguistic information. However, making such rules is an extremely complex and human-dependent task. This has fostered research on data driven TTS systems, which try to automatically create rules from large databases containing prosodic and linguistic information. When compared to human speech, synthesized speech is distinguished by insufficient intelligibility, inappropriate prosody and inadequate expressiveness. These are serious drawbacks for conversational human-machine interfaces. Moreover expressiveness, or affect, provides information about the speakers mental state and intentions beyond what is revealed by word content. Nevertheless, most of these improvements were aimed at simulating natural speech as that uttered by a professional announcer reading natural text in a neutral speaking style. Our system changes expressivityof a sentence as an actor does. The neutral sentence which we wish to transform into different emotions (sadness, happiness and anger) is produced by a Kannada Text-To-Speech (KTTS) synthesizer. Our work comprises a improvement in the naturalness of voice in text to speech systems. This can be used not only as an interesting language learning aid for the normalperson but it also serves as a speech aid to the vocally disabled person.
We propose to build a complete system of standard spoken Kannada with a high speech quality [1],[2],[3],[4],[5] and [6].
II. KANNADA PHONEME DATABASE DEVELOPMENT
A series of preliminary stages have to be fulfilled before the synthesizer can produce its first utterance. The database of WAV files is obtained by recording the natural voicing of the targets. A sampling frequency of 16 kHz was used to make the synthesized voice sound more pleasant. An amplitude resolution of 16 bits was used [7]. The recordings were done in male and female voices. Repeated segmentation of these speech files was done to excise phonemes/allophones from the speech database. As the output quality of any concatenative speech synthesizer relies heavily on the accuracy of segment boundaries in the speech database [8], manual method of segmentation was used. In this work, the coarticulatory effect was put to good use by excising phonemes from different environments (surrounding phonemes), adding to the variability and naturalness of the database. These allophone segments were also stored as WAV files after appropriate labelling.
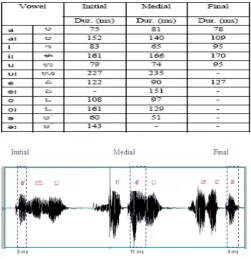
For the study and analysis of prosody, first we choose a number of sentences that will compose our corpus. The corpus was designed in a way that each phoneme resides in various positions in a word (initial, medial, final) as in Table I, in that way the extraction of them is possible and can be used as a structural element in a text-to-speech system (TTS) inventory. Using their phonetic transcription, we segmented the wave files using PRAAT [9] software and obtained exact boundaries of phone as shown in Figure 1.
Table I. Duration of Vowels
Figure 1. Phoneme Duration in different positions in a word.
Table II. Basic units to Word (Pada)
III. EVALUATION OF THE NATRUAL VOICE
Following the recordings, a listening test was performed to test whether normal listeners could identify the type of emotion that characterized the recorded utterances. Qualified listeners were used both men and women, of different ages and none of them was used to synthetic speech. The stimuli for the evaluation was five neutral-content sentences (twenty recordings per listener), randomly played. The whole evaluation process took place in two parts. First response test was held where the listeners were labelling each utterance with whatever emotion found appropriate and second they were enforced to choose between the four emotions (Sadness, Anger, Happiness and Neutral) that where included in our database. The results are tabulated in Table III.
Table III. Recognition rate of the synthesized speech
Emotions Recognition Rate
Neutral 76 %
Sadness 80 %
Happiness 56 %
Anger 92 %
IV. CONCATENATION
Concatenating and modifying the prosody of speech units without introducing audible artifacts are difficult [10]. This problem was over come by appropriate linguistic design of the text corpus and careful preparation of the speech database. After manually editing the WAV files and trying out the direct waveform concatenation to identify the right constituent segments for any word in the vocabulary, the appropriate segments are concatenated programmatically to yield the synthesized speech. Sentences could also be synthesized with the prosody corresponding to those embedded in the segments [11]. Sentences made from segments of longer duration give rise to slow utterances and correspond to sad emotions, while sentences from short duration segments give rise to fast utterances corresponding to any happy, energetic person. These varied styles could be chosen using tags in the text entry.
V. PARAMETERS FOR EMOTIONAL SPEECH
DESCRIPTION.
Features for the description of each emotional state composed of the:
• Speech Duration in various levels (word, sentence, phoneme)
• Fundamental frequency F0
• Speech Intensity
The above parameters were adopted as the most efficient and most important factors for the recognition and variation of the emotions that were recorded in our database.
To obtain emotional speech by modifying natural spoken units it is necessary to extract basic parameters that describe emotions. The main prosodic features usually extracted for emotional analysis are Time Duration (Quantity), Intensity (Stress) and Pitch (Intonation).
A. Speech Duration in various levels
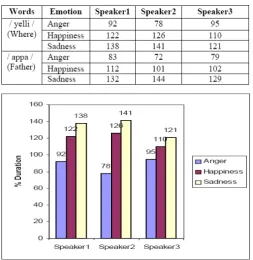
Speech rate/duration is known to be a variable affecting timing in a speech signal. Table IV gives the duration of the speech of the three speakers, uttering two words in different emotions, as percentage in terms of neutral speech. Neutral speech is taken as 100% and the duration of speech with each emotion is given, in terms of the duration of neutral speech (% duration = duration with emotion x 100 / neutral duration). Time duration is least for anger and highest for sadness that is Anger < Neutral < Happy < Sadness. It can be seen that even though the percentage is different for the three speakers, the general trend is same for each of the emotions. Figure 2 and Figure 3 is the graphical representation of duration (ms) change of word / yelli / (Where) and / appa / (father) uttered by different speakers in different emotions (% change in comparison with neutral speech).
Table V gives the duration of the speech of the sentence /ninna hesaru enu/ (What is your name) for different emotions. The duration pattern varies from person to person, but different emotions show general trends. Figure 4 is graphical representation of duration (ms) change of sentence /ninna hesaru enu/ (What is your name) for different emotions (% change in comparison with neutral speech).
(father) for different emotions and Figure 6 shows duration (ms) change of vowels /a/ and consonant /p/ in the word /appa/ (father) with four different emotions
Table IV. Duration of words (milliseconds) uttered by different speakers in different emotions (% change in comparison with neutral speech)
Figure 2. Duration (ms) change of word / yelli / (Where) uttered by different speakers in different emotions (% change in comparison with neutral speech)
Figure 3. Duration (ms) change of word / appa / (father) uttered by different speakers in different emotions (% change in comparison with neutral speech)
Table V. Duration of sentence (milliseconds) for different emotions (% change in comparison with neutral speech)
Figure 4. Duration (ms) change of sentence /ninna hesaru enu/ (What is your name) for different emotions (% change in comparison with neutral speech)
Table VI. Duration of Phonemes (ms) in the word /appa/ (Father) for different emotions
Emotion Phonemes Total Duration
(ms) a pp a
Anger 85 140 205 430
Neutral 132 163 221 516
Happiness 173 170 236 579
Sadness 233 196 256 685
Figure 5. Duration (ms) change of word /appa/ (father) for different emotions
B. Fundamental frequency F0
As far as it concerns the addition of emotional characteristics in synthetic speech is essential the analysis, modeling and finally the generation of pitch contour. The fundamental frequency (F0) contour for each sentence in our corpus was extracted. First we started with the analysis of neutral sessions F0 and then we proceeded to the analysis of each emotional counterpart. The F0 contour of each emotional session was compared with the neutral part. Quantitative definition of F0 contours for each emotional state is contacted by the utilization of declination phenomenon.
Figure 7. Emotional / Neutral speech pitch contour
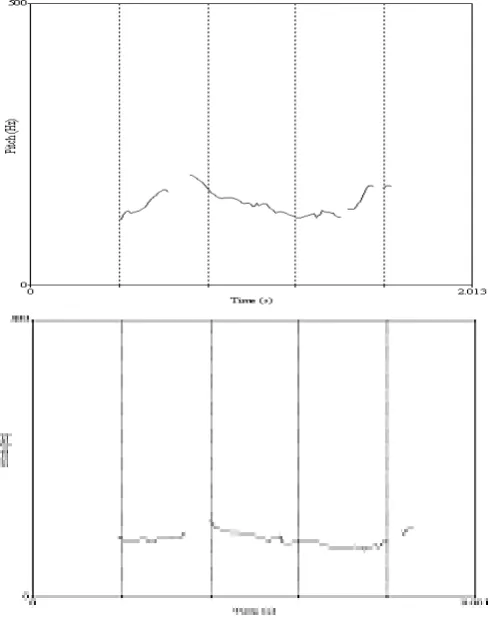
Inspection of F0 contours of neutral utterances and their emotional versions led us to the conclusion that, Emotional version of each utterance had a contour similar to its neutral counterpart but shifted to higher frequencies. Pitch accent phenomena were still there but in a higher degree as shown in Figure 7. Emotional versions (anger, happiness) seem to have a higher speech rate.
The Pitch contour of neutral speech is almost flat and is of minimum value as seen in Figure 8, Figure 9 & Figure 10. The following three figures show pitch contours for each emotional type sentence with its corresponding emotionless (neutral) sentence.
Figure 8. Anger emotion and emotionless / /
Why did you do this
Figure 9. Happiness emotion and emotionless / /
Figure 10. Sadness emotion andemotionless/ / I am extremely unhappy
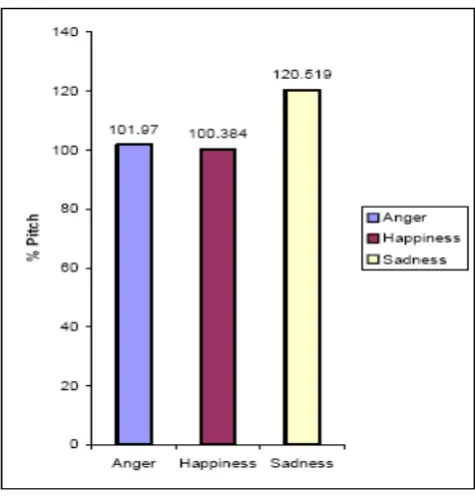
Table VII. Average Pitch (Hz) variation for different emotions (% change in comparison with neutral speech)
Samples Emotion Pitch
/ ba illi/ (come here)
Anger 101.970
Happiness 100.384
Sadness 120.519 / basava bandidana /
(has basava come)
Anger 131.240
Happiness 140.320
Sadness 142.590
The average pitch variation of word / ba illi/ (come here) and / basava bandidana /(has basava come) for different emotions in % change in comparison with neutral speech is tabulated in Table VII. Its graphical representation is shown in Figure 11 and Figure 12.
Figure 11. Pitch change of word/ ba illi/ (come here) for different emotions (% change in comparison with neutral speech)
Figure 12. Pitch change of word/ basava bandidana /(has basava come) for different emotions (% change in comparison with neutral speech)
C. Speech Intensity
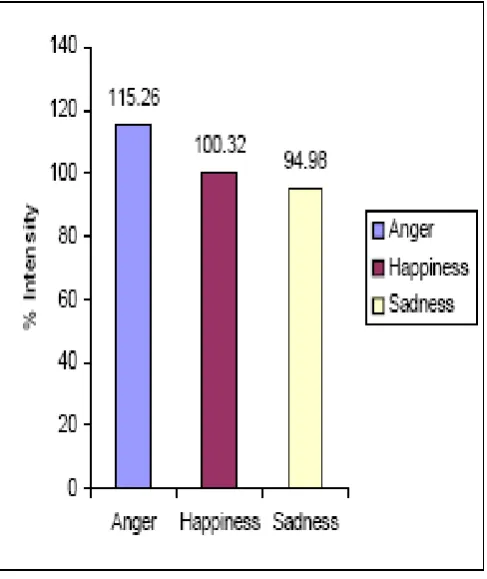
It is seen that anger emotion is articulated with maximum intensity where as sadness has minimum intensity. That is Anger > happiness > neutral > sadness.
Table VIII confirms that the average intensity variation for different emotions is least for sadness and maximum for anger. Its graphical representation is shown in Figure 13 and Figure 14.
Figure 14. Intensity change of word/ basava bandidana (has basava come) for different emotions (% change in comparison with neutral speech)
Table VIII. Average Intensity (DB) variation for different emotions (% change in comparison with neutral speech)
Samples Emotion Intensity
/ ba illi/ (come here)
Anger 113.50
Happiness 110.9
Sadness 98.90
/ basava bandidana /
(has basava come)
Anger 115.26
Happiness 100.32
Sadness 94.98
VI. MOSEVALUATION
Evaluating synthetic speech formally is difficult as there are many complex factors, dealing with intelligibility, naturalness, and the flexibility to simulate different voices and speaking rates. Due to lack of suitable standards for comparison, objective methods could not be used in this work. Hence, evaluating synthetic speech output was almost exclusively a subjective process. Certain subjective tests such as the dynamic rhyme test (DRT) are not realistic for practical application [10]. Therefore, mean opinion score (MOS) [12] has been used to evaluate the quality of this TTS, mainly in terms of intelligibility and naturalness. We have used the five level scales given in Table IX as they are easy and provide some instant, explicit information.
Table IX. Scale used in Mean opinion score(MOS)
Rating Mean opinion score(MOS)
1 Bad
2 Poor
3 Fair
4 Good
5 Excellent
Table X. Sample Mean opinion score(MOS) for sentances
Number Test sentences MOS rating
1
Why did you do this 4.5
2
What a beautiful flower
4.5
3
/I am extremely unhappy
4.0
Table XI. Mean opinion score(MOS) for WAV concatenation
Number Words MOS rating
1 appa (Father) 4.9
2 yelli (Where) 4.8
3 ba (come) 5.0
The listeners were all nonnative speakers of Kannada. As is required, none were experts in TTS. There were five teachers, two engineers, two doctors and one 16-year-old boy. The participants were briefed about the project.
An MOS rating greater than 4 indicates good quality. Any rating between 3.5 and 4 indicates that the utterance possesses telephonic communication quality. Ten volunteers without any known hearing disabilities participated in the MOS evaluation of the outputs of the above sentences and words as shown in Table X and Table XI.
VII. CONCLUSION
In this paper, the implementation details of a phoneme-based concatenative TTS, with sufficient degree of customization and which uses linguistic analysis to circumvent most of the problems of existing concatenative systems, have been presented.
• The duration of vowels and consonants is comparatively more dependent on gender than age of the speaker.
• The duration of consonants remains moderately constant irrespective of its position in the word and the vowel it occurs along with.
• The duration of vowels varies extensively with its position in the word
The recorded emotional speech database represents a good base for emotional speech analysis and is also usable for emotional speech synthesis. With a close inspection to the results of our research we can value that emotional variation of speech can be achieved up to a level by slight manipulation of the three fundamental parameters we analyzed which are pitch, speech rate and speech intensity. We can classify anger and happiness as segmental emotions and sadness as prosodic emotions.
The analysis also shows that time duration variation for different emotions at sentence, word and phoneme level are Anger < Neutral < Happiness < Sadness, i.e. duration is least for anger and highest for sadness. The phoneme level analysis on duration shows that it is the vowels that capture the emotional variation more compared to consonants.
VIII. REFERENCES
[1] D.J.Ravi and Sudarshan Patilkulkarni “Kannada Text-To-Speech Systems: Duration Analysis” Proc. of ISCO 2009, Coimbatore. pp. 53.
[2] D.J.Ravi and Sudarshan Patilkulkarni “Speaker Dependent Duration Analysis of Vowels and consonants for Kannada Text-To-Speech Systems” Proc.Of NICE 2009, Bangalore. pp. 95-99.
[3] D.J.Ravi and Sudarshan Patilkulkarni “Time Duration Variation Analysis of Vowels and Consonants for KannadaText to Speech Systems.” "Journal of Advance Research in Computer Engineering: An International Journal", July-December 2009, pp. 307-311.
[4] D.J.Ravil and Sudarshan Patilkulkarni “ Kannada Text to speech Synthesis Systems : Emotion Analysis” in the Proceedings of the seventh International Conference on Natural Language Processing (ICON 2009), Hydrabad, held on 14th to 17th
[5] D.J.Ravi and Sudarshan Patilkulkarni “Analysis and modeling of emotional speech in Kannada language” International Conference on Advanced Computing & Communication Technologies (ICACCT-2010, Panipat Haryana.
Dec 2009, pp 51-58.
[6] D.J.Ravi and Sudarshan Patilkulkarni “Inclusion of Emotion and its Effects of Voice in Synthesized and Recorded Speech for Kannada Text To Speech System”, for the International Journal of Computational Intelligence Research (IJCIR-ISSN:09373-1873), published by Research India Publications, India.
[7] VoiceSynthesis,
http://www.hitl.washington.edu/scivw/EVE/.
[8] M. Ostendorf and I. Bulyko, “The impact of speech
recognition on speech synthesis,” IEEE
Communications Magazine, pp. 99–104, 2002. [9] PRAAT : A tool for phonetic analysis and sound
manipulations by Boersma and Weenink, 1992-2001. www.praat.org
[10]D. O'Shaughnessy, Speech Communications: Human and Machine, Cambridge University Press, Cambridge, UK, 2001.
[11]M. Tatham and E. Lewis, “Improving text-to-speech synthesis,” Proceedings of the Institute of Acoustics, vol. 18, no. 9, pp. 35–42, 1996.
[12]C. Delogu, A. Paoloni, and P. Pocci,