pISSN 2320-1770 | eISSN 2320-1789
Research Article
Contraceptive intentions among Christian women in India:
a multi-stage Logit model analysis
Niyati Joshi
1*, Mahesh Nath Singh
2INTRODUCTION
Emphasis on population development approach for different sections of population of India has left an indelible impression by creating a demographic gap. Consequently, some population groups of India are set on a distinctive demographic journey. There is very little variation in the fertility levels of Christian women in India or in the sex ratio of their births, which remains nearly constant.1,2 This provides a window to understand factors affecting fertility of Christian women,3 especially contraceptive use and its effect for social learning by enquiring into whether contraceptive intentions of Christian women have materialized into use. A significant dimension of contraceptive use that needs attention is future intentions regarding their use. Allowing and facilitating women to realize their own
contraceptive choices and goals was one of the
recommendations of ICPD (1994),4 and meeting the
needs of those who intend to use contraceptives goes to fulfill that objective.5 It is shown that understanding of „intentions not to use‟ contraceptives will help in identifying the factors for bringing change in attitude to practice of contraception.6 Fear of side effects and understanding of unmet need and PPA are very important to convert non-users into users.7 Studies on intention to use contraceptive8 and found that constellation of services9 for family planning and other contraceptive health concerns centre around the time of child birth and programs mostly concentrate on satisfaction of unmet needs rather than converting intending women into users.10 If women are to gain greater control over their child bearing processes, it is found that perception of family size has a substantial effect on the decision to
1Department of Commerce,Ministry of Commerce and Industry, Government of India, New Delhi, India
2Senior Research Officer, Public Health Foundation of India, New Delhi, India
Received: 29 May 2014 Accepted: 10 June 2014
*Correspondence: Dr.Niyati Joshi,
E-mail: niyatijoshi.iips@gmail.com
© 2014 Joshi N et al. This is an open-access article distributed under the terms of the Creative Commons Attribution Non-Commercial License, which permits unrestricted non-commercial use, distribution, and reproduction in any medium, provided the original work is properly cited.
ABSTRACT
Background: The main objective of this paper is to find how end level service providers of contraceptives can meet problems in identifying specific non-users at different stages of service delivery.
Methods: A multi-stage Logit model is developed from NFHS (2005-06) data for Christian women in India. The initial model is selected by Brown screening technique and for the final model, likelihood ratio statistic and Akaike information criterion is used. The study variables are age, number of living children, unmet need, infecundity, side effects of contraceptive use, education and place of residence, SLI and cash earning.
Results: Though spatial factors affect both Christian and non-Christian women, SLI directly affect Christian womens‟ intention while it operates through education for non-Christian women. The best model for future contraceptive intention among Christian women is affected by unmet need operating through standard of living. Conclusions: The study finds two different paths of causation affecting future contraceptive intentions of Christian and non-Christian women with separate policy concerns and suggests that paths to future contraceptive intentions of Christian women may act as a social learning through diffusion process for non-Christian women.
initiate contraception.11 Early contraceptive use depends on desired family size12 which depends upon younger age, previous experience of child loss and education.13 Unmet Need for contraception and its variants are statistically derived measures of potential demand of contraceptive intentions of non-users of contraception and intention to use contraception in future is a direct measure of potential demand. It may not always be possible for a woman to comprehend and synchronize her own statement and link “not having children” with use of contraception. It may, therefore, be difficult for End Level Service Providers (ELSP) to translate such woman‟s desire into action. In this context, the intention to use seems to be a very valid indicator of demand rather than the prevalence of unmet need, even allowing for some failure to use among those stating intentions to use. When it comes to end level service providers who counsel women (either who intend to or those who do not intend to) to convert their desires into practices, the time distribution and contraceptive practices of women such as whether she is in PPA, perceives herself as sub-fecund etcetera becomes very important.5 In this context, this paper focuses on understanding how end level service providers of contraceptives can meet problems in identifying specific non-users at different stages of service delivery and how to identify the paths for converting non-users into users, if they intend to use contraceptives by applying a multi-stage Logit model. This model has been discussed14 and earlier applied15-17 in understanding effect of birth interval on infant survival on Thailand DLHS data and for understanding child bearing and infant survival from Korean data.18 The study has made a substantial contribution in understanding policy concerns of contraceptive intentions of Christian women in India and its implications for non-Christians. Dichotomization of explanatory variables has allowed causal analysis,19 which helped in direct presentation of the strength of the effects.
Demographic profile of Christian women in India and context
Christians in India have been found to be highly developed on the demographic indicators. Despite a high increase in Christian population,31 this group is efficiently managing to remain near the replacement level fertility (NHFS, 2005-06).20 The number of Christians in the total population increased from 0.71 percent in 1891 to 2.3 percent in 2011 and NFHS (2005-06) shows the Christian population to be 2.2 percent, though spatial aspects of population distribution have not changed much from 1891 up to now.1,2,21 The Indian national family health survey (2005-06) has collected information on future contraceptive intentions of all eligible women. Among Christians in India, it was found that 80 percent are Implicit in the methods is the causal ordering of variables in the form of a multistage factor response model.22 Suppose, for example, that we have four variables: A, B, C and D. If the causal ordering is
{A precedes B precedes C precedes D}--- (i)
Then we should construct a diagram based on Logit models for (1) B given A (2) C given A and B, and (3) D given A, B and C. This set of three Logit models, when combined, characterizes the conditional joint probability of B, C and D, given A. If the causal ordering is
{A and B} precede C precedes D, --- (ii)
It is suggested that the relationship between A and B can be measured on the basis of the corresponding marginal table,22 and the links between the remaining variables then can be based on Logit models for C given A and B for D given A, B and C. This pair of Logit models characterizes the conditional joint probability of C and D given A and B. When we combine the two marginal probabilities of A and B, we get a characterization of the joint probabilities associated with all four variables. Both the systems of equation (i) and (ii) are systems of recursive models and their parameters can be measured with Likelihood –Ratio Statistics for Component models.
Causal analysis involving Logit and log-linear models
analysis of quantitative variables, where Logit coefficients becomes path coefficients and such models are applied18 and in demographic analysis.17
Akaike information criterion (AIC)
The Akaike information criterion,25 developed is a statistical model fit measure with the lowest value to avoid over-fitting. It quantifies the relative goodness of fit of various previously derived statistical models. It uses a rigorous framework of information analysis based on the concept of entropy. The driving idea behind AIC is to examine the complexity of the model together with goodness of its fit to the sample data and to produce measure which balances between the both:
AIC= 2k-ln (L),
Where K: number of parameters, L: Likelihood ratio chi-square
Data sources and selection of variables influencing contraceptive intentions
G Wants more children G1:wants more children
G2: others available to researchers on socio-economic and demographic characteristics, family planning and fertility
characteristics, immunization and child health,
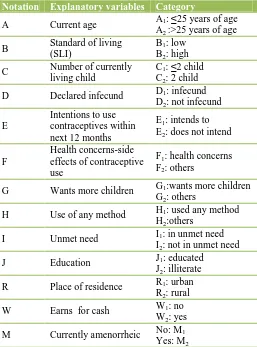
knowledge and misconceptions of HIV/AIDS, MCH and quality of health care. The sample of women who intend to use contraceptives in the 12 months consists of 578 Christian and 6313 non-Christian women. This analysis has been performed both for Christian and non-Christian women. Explanatory variables have been taken as shown as in Table 1.
For simplicity, all the variables have been considered binary. Womens‟ age, SLI, numbers of living children, side effects of contraceptive use, unmet need and education have been considered to be generally affecting womens‟ contraceptive intentions.13 SLI variable is
available into low, medium and high category. For this paper medium category have been merged with high category and has been said as high category. We found that current amenorrheic status, previous use experience of any contraceptive methods, earning cash and „declared fecund‟ were not very significant in determining the future contraceptive intentions of the women either for Christians or non-Christians, either by partial or marginal association.26 In our initial model, the selection process included all the variables except SLI as it was not found significant either for Christians or non-Christians; therefore, SLI (B) has been included in the model at the second stage. As all the nine variables were categorized, a 29 cross-classified table was created and log-linear model analysis was applied. For the causal ordering, it is considered that women‟s future contraceptive intention was preceded by SLI, which was in turn preceded by the remaining eight variables. Analytically, this is equivalent to a two-stage log-linear analysis, first analyzing on a 28 cross-classified table collapsing over the variable of SLI and then on a full 29 table.14 The best fit log-linear model was selected by standard stepwise procedure. We also considered Akaike information criterion25 in the selection procedure. The multistage logistic model thus performed is equivalent to the path analysis for qualitative data.22
RESULTS
Univariate and bi-variate analysis
child both for Christians and non-Christians are producing nearly the same effect in explaining womens‟ future contraceptive intention while side effects of contraceptive use are of more concern to non-Christians though unmet need is more explanatory of future contraceptive intention in case of non-Christians, urban stay of Christians is more contributory to explaining
future contraceptive intention. Previous use of
contraceptives does not affect intentions much either of Christians or non-Christians. Though health concerns is more affecting to non-Christians women than low SLI Christians women. Though, high SLI non-Christian women are more bothered about side effects of contraceptive use as may be that they previously had bad experiences. Illiterate non-Christians with unmet need show a very strong contraceptive intention as compared to literate non-Christians, which may be the result of social learning. Christians with low SLI, having at least two living children (OR=3.35) and are in unmet need, have a very strong future contraceptive intention which
shows why near replacement level fertility have been maintained by Christians since long? Thus, it appears that many factors are associated with future contraceptive intentions of Christian women, whose effects are very much pronounced even for Christian women with low education and SLI compared to non-Christian women.
Selection of best fit model for Christian and non-Christina women
The hierarchical log-linear model gives many models14 and we need to select the most appropriate casual model in terms of parsimoniousness, goodness of fit, and the amount of information the model could offer.
To reach such a model for Christian and non- Christian women both from the NFHS (2005-06) data, a series of nested models as listed in Tables 2 and 3 was sequentially examined.
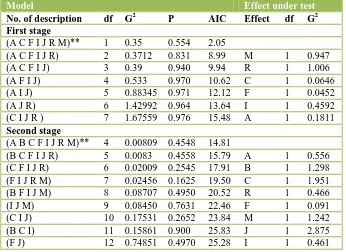
Table 2:Selection of log-linear models for non-Christian women, India; NFHS (2005-06).
Model Effect under test
No. of description df G2 P AIC Effect df G2 First stage
(A C F I J R M)** 1 0.35 0.554 2.05
(A C F I J R) 2 0.3712 0.831 8.99 M 1 0.947
(A C F I J) 3 0.39 0.940 9.94 R 1 1.006
(A F I J) 4 0.533 0.970 10.62 C 1 0.0646
(A I J) 5 0.88345 0.971 12.12 F 1 0.0452
(A J R) 6 1.42992 0.964 13.64 I 1 0.4592
(C I J R ) 7 1.67559 0.976 15.48 A 1 0.1811
Second stage
(A B C F I J R M)** 4 0.00809 0.4548 14.81
(B C F I J R) 5 0.0083 0.4558 15.79 A 1 0.556
(C F I J R) 6 0.02009 0.2545 17.91 B 1 1.298
(F I J R M) 7 0.02456 0.1625 19.50 C 1 1.951
(B F I J M) 8 0.08707 0.4950 20.52 R 1 0.466
(I J M) 9 0.08450 0.7631 22.46 F 1 0.091
(C I J) 10 0.17531 0.2652 23.84 M 1 1.242
(B C I) 11 0.15861 0.900 25.83 J 1 2.875
(F J) 12 0.74851 0.4970 25.28 I 1 0.461
Note: All values have been taken at P <0.05, df: degrees of freedom; G2: Likelihood ratio Chi-square; P: probability, AIC: Akiake information function; **: the best fit model
Each capital letter indicates the main effect of the variables, as denoted in Table 1, omitting full interaction effect of the explanatory variables as it must be included anyway by theory. On applying Brown screening technique,26 for initial model selection process for the best fit model, it included all the effects except for standard of living as it was not significant either by partial or marginal associations both for Christians and non-Christians.
The importance of an effect in the model was evaluated by examining the difference in the chi-square (G2) value between two models, one including the effect and the other excluding it.
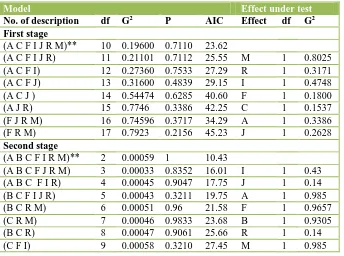
Table 3:Selection of log-linear models for Christian women, India; NFHS (2005-06).
Model Effect under test
No. of description df G2 P AIC Effect df G2 First stage
(A C F I J R M)** 10 0.19600 0.7110 23.62
(A C F I J R) 11 0.21101 0.7112 25.55 M 1 0.8025
(A C F I) 12 0.27360 0.7533 27.29 R 1 0.3171
(A C F J) 13 0.31600 0.4839 29.15 I 1 0.4748
(A C J ) 14 0.54474 0.6285 40.60 F 1 0.1800
(A J R) 15 0.7746 0.3386 42.25 C 1 0.1537
(F J R M) 16 0.74596 0.3717 34.29 A 1 0.3386
(F R M) 17 0.7923 0.2156 45.23 J 1 0.2628
Second stage
(A B C F I R M)** 2 0.00059 1 10.43
(A B C F J R M) 3 0.00033 0.8352 16.01 I 1 0.43
(A B C F I R) 4 0.00045 0.9047 17.75 J 1 0.14
(B C F I J R) 5 0.00043 0.3211 19.75 A 1 0.985
(B C R M) 6 0.00051 0.96 21.58 F 1 0.9657
(C R M) 7 0.00046 0.9833 23.68 B 1 0.9305
(B C R) 8 0.00047 0.9061 25.66 R 1 0.14
(C F I) 9 0.00058 0.3210 27.45 M 1 0.985
Note: All values have been taken at P <0.05, df: degrees of freedom; G2: Likelihood ratio Chi-square; P: probability, AIC: Akiake information function; **: the best fit model
As shown in table 3 that for the first stage, we could ignore the effect of J but not of others in the case of Christians. In terms of AIC, however, model 1, which included the effect of J presented the smallest value and its goodness of fit was significant and it is more parsimonious than model 2, so model 1 was accepted as the best fit model for the first stage of causation. By undergoing a similar procedure for the second stage,
model (A, B, C, F, I, R, M) was selected. Combining these two stages, the overall interpretation for intentions to use contraceptives becomes that future contraceptive intention of Christian women is directly affected by their SLI and education but indirectly affected by place of residence and present surviving child through education and SLI.
Table 4:Estimates of the Logit parameters and odds ratio for the effects in the best fit causal model for Indian non-Christians women, NFHS (2005-06).
Determinants Logit
parameter
Odds ratio First stage effects-effects on PPA (Intends in PPA vs. does not)
Women‟s age (young vs. old) -0.751 0.222
Currently living child (two child vs. more child) -0.507 2.756
Side effects of contraceptive use (has vs. does not have) -0.655 0.269
Education (literate vs. illiterate) -0.562 0.324
Unmet need (unmet need vs. no unmet need) -0.567 0.321
Place of residence (urban vs. rural) 0.369 2.091
Amenorrhea (yes vs. no) -0.569 0.320
Second stage effects-effects on intentions (Intends to vs. does not intend to)
Women‟s age (young vs. old) -0.746 0.224
Standard of living (low vs. high) 0.086 1.187
Currently living child (two child vs. more child) -0.509 0.361
Side effects of contraceptive use (has vs. does not have) -0.653 0.270
Unmet need (unmet need vs. no unmet need) -0.569 0.321
Education (literate vs. illiterate) -0.486 0.378
Place of residence (urban vs. rural) 0.362 2.062
Applying the same procedure for non-Christians, model (A C F I J RM) was selected with lowest AIC value with high goodness of fit and it is more parsimonious than that which was selected at the second stage. Combining both the stages the interpretation of the causal model for the non-Christian becomes that future contraceptive intention of non-Christians women is directly affected by their SLI but is indirectly affected by amenorrhea; education, unmet need, urban residence and current surviving child operate through their standard of living.
Strength of effects in the selected model
The Logit parameter is useful in evaluating the strength and direction of a determinant. As our Logit models are derived from Log-linear model, the parameter represents the deviate from the mean Logit owing to the case belonging to the first category of the factor. Then ratio of a determinant is measured by the exponential of twice its
Logit parameter.19 For example odds of future
contraceptive intentions would be decreased by exp (-2*0.914) for Christian women if women are under age 25 rather than older. Conversely, the odds ratio of older women to younger women would be 1/1.828 = 0.59. These odds ratios are shown in table 4 and 5. For non-Christians in the first stage of causation, the effect of urban residence compared to rural was very strong for younger women to intend to use contraceptives in future, and having two living children also makes for a strong possibility of their intention to use contraceptive in future.
Table 5:Estimates of the Logit parameters and odds ratio for the effects in the best fit causal model for
Indian Christians women, NFHS (2005-06).
Determinants Logit
parameter
Odds ratio First stage effects-effects on PPA (Intends in PPA vs. does not)
Women‟s age (young vs. old) -0.914 0.160
Currently living child (two child
vs. more child) -0.342 0.504
Side effects of contraceptive use
(has vs. does not have) -0.232 0.628
Unmet need (Unmet need vs. no
unmet need) 0.046 1.096
Education (literate vs. illiterate) -0.231 0.630
Place of residence (urban vs. rural) 0.031 1.063
Amenorrhea (yes vs. no) -0.191 0.682
Second stage effects-effects on intentions (Intends to vs. does not intend to)
Women‟s age (young vs. old) -0.895 0.166
Standard of living (low vs. high) 0.042 1.087
Currently living child (two child
vs. more child) -0.352 0.494
Side effects of contraceptive use
(has vs. does not have) -0.254 0.601
Unmet need (unmet need vs. no
unmet need) -0.39 0.458
Place of residence (urban vs. rural) -0.238 0.621
Amenorrhea (yes vs. no) -0.234 0.626
Table 6:Higher order odds ratios for combination of factors for Indian non-Christians, NFHS (2005-06).
Contrast of factors Odds ratio Contrast of factors Odds ratio First sage Second stage
A2C1I1J1R1M1/A1C2F2J2R2M2 0.94 A1F1I1J1M1R2/A2C2R2F2J2M2 0.79
C1F1J1R1M1/C2F1I1R1M1 3.01 A2C1R1F2J1B2/C2R1F1I1J1B2 1.005
A2F2J2R2M1/A1C1J1R1M2 1.16 A1C2F2I2R2/A2C1M1I2R1 1.09
A2C1I1/A1C2F2 0.76 C2F2I2J1B2/C1F2I1J2B1 25.73
C2F1I1/A1F1I2 0.85 C1I2J2R2M2/A1I1J2R2M1 1.41
A2F2J2/A1C1J2 2.82 A1C2F2J2R2/A2C1I1J1R2 2.22
A1F2R2/A2C1R1 2.18 A2C1F1R1M1/A1C2I2R2M1 24.07
A1I2R1/C2F1R2 7.13 A1C2M2I2B1/A1C2R2F1B1 2.30
F2I1R1/C2I1R2 0.90 A2F2J1R1/A1F1I1R2 0.34
C1J2R2/A2J1R2 2.29 C1F1J1R2/C2F1I1R2 11.38
I2J2R1/F1J2R1 1.64 A2C2J1R1/A1F1J2R1 0.32
C1R2M2/A1C1M2 0.63 A2C2R1M2/A2F1C1R2 34.86
J2R2M1/I1R2M2 1.03 C1F1R1M1/C2I1R2M1 7.14
A2F1/A1C2 0.39 A2C2F2J2/A1C1M1J1 1.02
A2C2/A2I1 22.87 C2B2F1J1/A1I1F2J2 7.69
C2F1/C1I1 0.13 A1R1I2J2 /A2C2I1J1 0.26
A2F1I1J1/C2M1I1J2 8.15
C2F1I2J2/C1F2I2J1 3.10
A1C2F1/A1C2F1 1.02
C1B1F1 /A2R1F1 4.0
Literate Christian women have a strong likelihood of adopting contraceptives compared to their illiterate counterparts. Similarly, in their second stage of causation, the direct effect of SLI of non-Christians women for future adoption of contraceptives use is very strong and education and place of residence, side effects of contraceptive use are showing a strong effect on future contraceptive intention, operating through SLI.
Both for Christian and non-Christian women, being in unmet need and amenorrhea have a strong association with future contraceptive intentions. In the same vein, for the Christian women, at the first stage of causation, urban place of residence and being in unmet need have a very strong association with future contraceptive intention, though side effects of contraceptive use deter them from future contraceptive intentions. In the same way, standard of living emerges as the most important factor for future contraceptive intention. It is supportive to find that amenorrheic Christian women have stronger future
contraceptive intention than their non-Christian
counterparts. The two-child norm effect appears to be fairly strong for Christian women; higher SLI of Christians would reduce the chances of higher number of births through strong future contraceptive intentions.
Figure 1:Path diagram for contraceptive intentions for non-Christian women, 2005-06.
Table 7:Higher order odds ratios for combination of factors for Indian Christians, NFHS (2005-06).
Contrast of factors Odds ratio Contrast of factors Odds ratio First stage Second stage
A1C1F1I1J1R1/A2C2F2I2J2R2 2.15 A2C2F2I2R2B2/A1C1F1I1M1B1 0.82
A1C1F1I1R1/A2C2F2I2R2 6.25 A1C2F2I1B1/A2C1I1R2B2 1.48
A1C1F1I1R1M1/A2C2F2I2R2M2 2.85 A1C2F212/A2F1I1R1 7.76
A1F2I2J2R2/A2F2I2J2M2 0.34 C1I2R2 /C2I1R1 1.00
C1F1I2J2M1/C2F2I1J1R2 0.55 A2C2B1R2 /A1I2B1R1 1.84
A1C1F1I1/A2C2F2J2 0.83 C2B1R1/A1B2R2 0.25
A1C1I1J1/A2F2I2J2 0.84 A1F2C1R2 /C1F2B1R1 4.29
C2F1I2R1/C1F2I1J2 3.53 I2M2R2/F1M1R1 1.13
A2C2F1R1/A1C2I1R2 1.89 C2I1R2M1/F2I1B2R1 1.19
A2F1I1R2/A2C1J1R2 1.12 A2C2B2/A1C2B2 1.06
A1I2R1M1/ F1I2J2R1 3.20 I2C1/F2C2 0.60
F2I2R1/F1J1R1 0.57 A1I2R2/A1C2R2 4.99
A1C2/A2F2 0.29 C1B2R2/C1I1R2 0.26
C2F1/A1I1 0.09 A2F2R1/A2C1M2 1.35
C2R1/C2I1 0.96 F1B2R2/M2C1R1 8.17
F2R1/F1I2 1.30 A2C1B2/A1C2B1 0.86
I2R1/A2R2 0.02 A2F1/C1F2 6.54
M2F1/C1F2 0.20
F2B1/R2B2 1.08
As there are no significant interactions in the finally chosen model, the combined effect of two or more variables on the response variable may be estimated by the sum of the respective Logit parameters. For example, the odds of future contraceptive intentions of Christians would be increased by exp 2 (-0.191) = 0.68 times, if the women is in amenorrhea and is staying in urban areas. In
the same way, there are multifactor contrasts
A1C1I1J1F1R1/A2C2I2F2J2R2 and others. These higher order
odds ratios are presented in table 6 for Christians and in
Table 7 for non-Christians. Depending on the contrast, the magnitude of a multifactor odds ratio can be very large. In the first stage of causation, for Christians, womens‟ age (A), number of surviving child (C), side effects of contraceptive use (F), being in Unmet need (I) and urban place of residence (R) are causing a high change in odds ratio. The odds of A1C1F1I1R1/A2C2F2R2I2
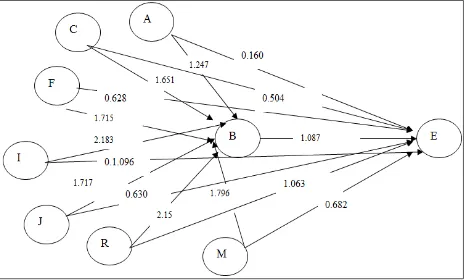
strong desire for future contraceptive use. Similarly, the multifactor odds ratios for non-Christians have been presented and these odds ratios can be as high as 34, showing that the interaction of the factors increases manifold the possibility of future contraceptive intentions. This second stage of causal model of future contraceptive intentions is schematically shown in Figure 1 and 2 akin to the path diagram. In the figure, the arrow shows the causal relationship between the connected variable and the number by an arrow show the pertaining odds ratios, corresponding to the path coefficient in a diagram.
Figure 2:Path Diagram for contraceptive intentions for Christian women, 2005-06.
DISCUSSION
Inthis paper, a multi-tier causal model for contraceptive intentions of Christian women in India using NFHS (2005-06) data is formulated and two types of multi-stage factor response model has been developed to show the differential effect for both the Christian and non-Christian women.
The best model for future contraceptive intentions of non-Christian women is operating through Standard of Living and education, both of which are highly affected by rural urban stay of these women as shown by the largest path coefficient of rural urban category of predictor. There is a high indication of contraceptive intentions among illiterate non-Christian women which supports earlier findings that the substantial reduction in fertility in India can be expected among illiterate women.27,28 unmet need is very much pronounced among them which is highly affected by their standard of living for future contraceptive intentions. Among the eight explanatory
variables selected as predictors of contraceptive intentions, we considered education and SLI as proximate variables and the other six variables current age, number of currently living children, health concerns about side effects, unmet need, place of residence and amenorrhea as background variables. Their causal ordering should be reasonable as contraceptive intention is very much associated with education and SLI.8 This education and SLI may affect apriori future contraceptive intentions or posteriori, as continuation of contraceptive use depends on SLI and education or both.13 Hence, SLI has affected apriori the contraceptive intentions of Christian women, probably because Christians with a high educational level may intend fewer children to at least maintain their given standard of living.
Findings indicate that currently amenorrheic Christian women with unmet need have a stronger intention to use contraceptive in future than their non-Christian counterparts. Also, the side effects of contraceptive use are of more concern to the Christian women because they are more aware of health consequences of side effects, which may be a hindrance in using contraception without satisfactory follow-up services after adoption. The number of currently living children is an important factor
in converting non-user Christian women into
contraceptive users as compared to non-Christians, as evidenced by the lower path coefficient for non-Christians. As effect of education is both direct and indirect for converting both Christians and non-Christians into users of contraception, indirect effect of education is strongly operating through other factors to affect the future contraceptive intentions of both the groups. This also suggests that indirectly diffusion effect of education is prominent in converting non-users into users of contraceptives. Therefore, universalisation of population education of specific groups will ultimately help in reducing TFR as envisaged in national population policy29 and national health policy30 through converting intending non-users into users.
Concentrating by investment on younger and uneducated women would be more helpful in converting non-users of
contraception to users and to strengthen the
demographics of generic community. For Christian women, unmet need operating through standard of living has emerged as the best path affecting their future contraceptive intention, which strengthens the impact of development on fertility reduction. The main factors for converting Christian women into users of contraceptives are urban residence and standard of living, while for non-Christians their future intentions to use contraceptives operate primarily through standard of living which is highly affected by their educational status.
important factor for future contraceptive intentions and hence, of being users. These issues may be taken into account by population policy and program managers for converting non-users of contraception into users and the results shown in higher order interactions can be suitable paths for specific programmes and policies. Christians stand better on demographic indicators which may help non-Christians as a source of social learning in improving their fertility behavior.
ACKNOWLEDGEMENTS
The authors greatly acknowledge the help given by prof. C. P. Prakasam, Chairman, Indian association for social sciences in health for guiding on references for statistical model selection.
2. Census of India. Provisional population totals, India:
census, 2011. Available at:
http://censusindia.gov.in/2011-prov-results/indiaatglance.html.
3. Richard J. Christians in India: a demographic study. J Christian Med Assoc. 1973;XLVIII(2):1973:56-62.
4. ICPD. Report of international conference on
population and development, 1994. Available at: https://www.unfpa.org/webdav/site/global/shared/do comparative study of Northern and Southern states of India. Demography India. 2001;30(2):261-80. 7. Gebremariam A, Addissie A. Intention to use long
acting and permanent contraceptive methods and factors affecting it among married women in Adigrat town, Tigray, Northern Ethiopia. Reprod Health. 2014;11(24):1-9.
8. Ross JA, Winfrey WL. Contraceptive use, intention to use and unmet need during extended PPA. Int Family Planning Persp. 2001;27(1):20-7.
9. Vlassoff C. Fertility intentions and subsequent
behaviour: a longitudinal study in rural India. Stud
determination of contraceptives in India. J Family Welfare. 1993;39(3):5-12.
12. Bulato RA. The value of children: a cross-national study. Philip East-West Popul Inst Hawaii. 1975;2:122.
13. Rasul. A study of powerful predictors in relation to fertility preference: a discriminant analysis. J Family Welfare. 1993;39(4):31-9.
14. Fienberg SE. Analytical data. In: Fienberg SE, eds. The Analysis of Cross-Classified Categorical Data. 1st ed. Cambridge, Mass: The MIT Press; 1977: 151.
15. Burnham KP, Anderson DR. Logit model. In:
Burnham KP, Anderson DR, eds. Model Selection and Multi-Model Inference: A Practical Theoretic Approach. 2nd ed. New York: Springer;.2002: 143.
16. Burnham KP, Anderson DR. Multi-model inference:
understanding AIC and BIC in model selection. Sociol Res Methods. 2004;33(2):261-304.
17. Park CB, Siasakul S, Saengtienchai C. Effect of birth spacing on infant mortality in thailand: two-stage Logit analysis. Asian J Trop Med Public Health. Applied Logistic Regression. 1st ed. New York: John Wiley: 1989: 31.
contingency tables when some variables are posterior to others: a modified path analysis approach. Biometrika. 1973;60:179-92.
23. Duncan OD. Path analysis: sociological examples. Am J Sociol. 1966;72:1-16.
24. Wright S. Path Coefficients and path regressions: alternative or complementary concepts. Biometrics. 1960;16:189-200.
25. Akaike H. A new look at statistical model
identification. IEEE Transact Automat Contr. 1974;19(6):716-23.
26. Brown MB. Screening effects in multidimensional contingency tables. Applied Stat.1978;25:37-46.
contraceptives? A multilevel analysis. Popul Stud. 2003;57(1):21-40.
29. MoHFW. National population policy (NPP), ministry
30. MoHFW. National health policy (NHP), ministry of health and family welfare, 2002. Available at: http://mohfw.nic.in/showfile.php?lid=2325.
31. Irudayarajan S. Is there any demographic transition
among Christians? Indian Missiolog Rev.
1987;9(3):228-40.
32. Montogomery MR, Casterline JB. Social learning, social influence and new models of fertility. Popul Dev. 1996;22(Suppl):151-75.
DOI: 10.5455/2320-1770.ijrcog20140911 Cite this article as: Joshi N, Singh MN.