Volume 6, Issue 11 pp. 270-278
270
EXPECTED AND REALIZED STOCK RETURNS: EVIDENCE FROM INDIA
Pritpal Singh Bhullar
Assistant Professor, Department of Humanities & Management Studies, Giani Zail Singh Campus College of Engineering & Technology Bathinda, (Constituent College of MRSPTU Bathinda) India
Pradeep K. Gupta
Assistant Professor; LM Thapar School of Management, Thapar University, Derabassi Campus, Derabassi-140507, Mohali (Punjab) India
Article History:
Received: 12-Dec-2016 Revised received: 08-Jan-2017
Accepted: 20-Jan-2017 Online available: 16-Feb-2017
Keywords: Realized return, Expected return, BSE Sensex
Abstract
Markowitz Portfolio theory is based on the expected return and risk but investors are more interested in realized return. The considerations, expected return as realized return and variance as investment risk, of Markowitz’s mean – variance model enable the researchers or scholars to further explore on the validity of Markowitz theory. The present study makes an attempt to unfold a new idea in investment scenario where Markowitz theory is empirically tested on realized return and risk as well as on realized return and expected return in the context of India. The findings show that a large variation in Expected Return is explained by the risk (Market Beta) alone and this risk and Expected return are significantly negatively related. However, the risk (Market Beta) and Realized return are insignificantly related. Further, a very low variation in the Realized (Actual) Return is explained by the Expected Return and the Expected Return and the Realised Return are insignificantly positively related. Thus, it is considered that the Markowitz model is not possible to implement in the real world even though the relationship holds good. This study acts as one of the guiding tools for investors in transforming their new age investment philosophy.
1. INTRODUCTION
1The investment regimes across the globe have largely harmonized and converged over last one and half decade. In today’s age of instant gratification, investors have become hardwired to want returns in a shorter span of time. The opportunistic mindset of investors has made the market trends unpredictable. With increasing market volatility, to achieve a desirable return from investments has become a tough nut to crack. To select the best investment alternatives is akin to having a buffet meal. Everything on the platter looks good and enticing but investors focus only those investments that suit their palate. Investors select the investment venture from the available alternatives with the
Corresponding author's
Name: Pradeep K. Gupta
Email address: gupta.pk1977@gmail.com
Asian Journal of Empirical Research
271
high return at the same level of risk or same return at the low level of risk. The stock market moves on an assumption that the high risk provides a high return. But reality differs from expectations. The nature of realized return is still unpredictable. Many financial stalwarts scratch their minds to predict the realized return accurately but success is still far away. The emerging market tremors have increased the vulnerabilities in return of investments. The mindset of investors has been changing across the globe. As market remained jittery for the longer period in the past, the investors have become quite fickle in willingness to stay invested in the particular stock. To gauge the extent of threat (negative risk) to return on investment (ROI) has become completely unpredictable in this fragile business environment. Investors want their investment should be meant to be an all-weather one. Negative return is not digestible for the investors even under the gloomy economic scenario. There are numerous macroeconomic factors that affect the realized return. Deterioration in the macroeconomic factors has increased the downside risk of return from the investment in the current market. The relationship between realistic return and expected return is under scrutiny in modern market conditions where the business environment has turned into fragile one. The deviation between realized return and expected return has been widened and unpredictable.
In the current highly volatile business environment, whether the expected return and the risk-based Markowitz theory is applicable successfully on realized return or not? To fill the gap between realized return and expected return has emerged as a big challenge for financial analysts and investors. The deviation between realized return and expected return has been widened and unpredictable. Whether realized return varies with risk or not, realized return behaves in a similar fashion as expected return. A closer scrutiny has been processing to find the answers to such questions. Markowitz theory is based on the expected return and risk but investors are more interested in realized return. Markowitz mean – variance model considered expected return as realized return and variance as investment risk. Therefore, the reliability of Markowitz theory is empirically re-examined in frequently changing market conditions.
Further, where the reflection of new information can shake the stock market very easily in a high volatile business environment, investment in stocks or portfolios just on the basis of expected return is not a wise thought. It has raised the eyebrows of many investors and financial gurus. To know the actual return or to minimize the tolerance limit in calculating actual return has become the primary focus for the investors and corporate. This research paper makes an attempt to unfold a new idea in investment scenario where Markowitz theory is empirically tested on Realized return and risk as well as on realized return and expected return. In the present study, an attempt has been made to empirically investigate and analyze the relationship between the expected and realized stock returns and the market beta (risk) for 30 most sensitive stocks listed in Bombay Stock Exchange (BSE) of India for the period from 2006-07 to 2014-15. The next section presents the review of literature followed by the empirical test design and result and discussion. Finally, the study is concluded with the limitations and future directions of research in this area.
2. REVIEW OF LITERATURE
Markowitz Portfolio theory is based on the expected return and risk but investors are more interested in realized return. Markowitz mean – variance model considered expected return as realized return and variance as investment risk. Thus, the considerations of Markowitz’s mean – variance model enable the researchers or scholars to further explore on the validity of Markowitz theory. Michaud
(1989) analyzed that most of the investment companies do not use Markowitz Mean – variance
272
Further, the study of Sarker (2013) mentioned that the risk-return approach to portfolio selection adopted by the investors should strive to apply the Markowitz’s basic formulation. Terol et al.
(2006) stated Markowitz model as a conventional model proposed to solve the portfolio selection
problems with an assumption that the situation of stock markets in the future can be characterized by the past asset data. Briec and Kerstens (2009) analyzed that Markowitz model contributes significantly in geometric mean optimization for long-term investments. Coggin and Hunter (1985)
found a negative relation between mean return and beta for stocks. They found a non-linear relationship between risk (beta) and mean return. Pastor and Stambough (2003) observed that stocks that are positively correlated with market liquidity should have high expected return. Alonso and
Restoy (1995) find a positive and not – significant relationship between return and risk for Spanish
stock exchange. Salman (2002) analyzed empirically that there is a positive and linear relationship between risk and return.
Ali and Ali (2013) observed that increase in a number of stocks in the portfolio as suggested in
Markowitz theory does not affect the actual return of investors. Kolani and Ekoui (2014) observed that there is a linear relationship between systematic risk and expected return. The expected return of stocks is significantly affected by other factors than systematic risks. Further, Kolani and Ekoui
(2014) suggested in their research that operating activities of the firm and non-systematic risk lead to
increase the deviation between expected return and realized return. They analyzed that there is no relation between actual return of stock and non-systematic risk. Horasanli and Neshilan (2007) stated that Markowitz portfolio theory used equally weighted data and this theory does not reflect current market condition.
Fama and Fench (1992) shows in their seminal research work that large beta estimate stocks have
low expected returns. Ang et al. (2006) found that stocks having large idiosyncratic volatilities give low expected future returns in short run. Perkovic (2011) observed that there is no relationship between beta and risk in stock return. Perkovic (2011)also documented that beta is not a trusted tool of risk measure for investment decisions after analyzing the monthly stock prices of Companies from CROBEX index from a time period of 2005 to 2009. Kolani and Ekoui (2014) empirically test the monthly stock return of 17 companies of during January 2000 to December 2008. The study supports a linear relationship between beta and return. The study suggests that the residual risk has no effect on expected return on the stock. Novak (2015) observed that conventional beta proxy is significantly unrelated to realized stock returns (in fact the relationship is slightly negative) but with using the forward-looking beta and eliminating unrealistic assumptions about expected market returns makes it (highly) significant. The study finds the flat relationship between backward proxy of CAPM beta and realized return. Theriou et al. (2010) analyzed and find that estimation of return and beta without differentiating positive and negative market excess returns produces a flat unconditional relationship between return and beta. The result shows an existence of a conditional CAPM relation between risk and realized return trade-off.
3. EMPIRICAL TEST DESIGN
In the present study, 30 companies listed on the Bombay Stock Exchange of India (BSE Sensex top 30) have been studied. The nine years period of study from 2006-07 to 2014-15 has been considered for this study. The beta of all the years has been calculated by dividing the covariance between market return and security return to the variance of market return. Expected return of the securities for all the years has been calculated by applying Capital Asset Pricing Model (CAPM). Realized return of securities and market return has been calculated by calculating the change in the price of security and Sensex from t-1 to t relative to the price of security and Sensex at t-1 respectively. The t- test and linear regression have been applied as a statistical tool for analyzing the relation between expected return and realized a return of stocks. SPSS Software has been applied to perform t- test and linear regression.
273
4.1. Relationship between the risk (beta) and the expected return
The results of the regression analysis are detailed in Table 1-3 to find the relationship between risk and expected return. The regression diagnostic is tested by plotting the normal distribution in Figure 1 and is found to be satisfactory. The results indicate the acceptance of Markowitz model for predicting returns based on the risk of a portfolio.
Table 1: Linear regression output of beta and expected return
Change Statistics
Model R R Square
Adjusted R Square
Std. Error of the Estimate
R Square Change
F
Change df1 df2
Sig. F Change 1 0.976a 0.952 0.952 0.5823 0.952 5308.705 1 268 0.000
Note: Dependent Variable: Expected Return a. Predictors: (Constant), beta
Table 2: Anova output of beta and expected return
Model Sum of
Squares df
Mean
Square F Sig.
1
Regression Residual
Total
1800.625 90.901 1891.527
1 268 269
1800.625
0.339 5308.705 0.000
a
Note: Dependent Variable: Expected Return a. Predictors: (Constant), beta
Table 3: Collinearity statistics of beta and expected return Unstandardized
Coefficients
Standardized Coefficients
Collinearity Statistics Model Beta Std. Error Beta t Sig. Tolerance VIF
1
Constant
Beta
6.978 -6.989
0.099 0.096
-0.976
70.542 -72.861
0.000
0.000 1.000 1.000
Note: Dependent Variable: Expected Return
Figure 1: P-P plot for Normal Distribution
From the above tables (1-3) it can be inferred that the R2 value is extremely high and 95% of the
274
related as indicated by the regression coefficient. Further, the relationship is statistically significant as the significance value of t (0.000) is less than 0.05. The PP plot for regression residuals is normally distributed, which is satisfactory.
4.2. Relationship between the risk and the realized (Actual) return
In this section, we analyze whether there is any relationship between the risk and the actual or the realized return. The validity of the Markowitz model in the previous section hints is not enough to show a relationship between the risk and the realized return. However, contrary to our belief, we found no significant relationship between the risk and the realized return. This suggests that even though the expected or the predicted returns depend on the risk of the portfolio, the return realized has no significant relationship with the risk in the portfolio. The results of the regression are detailed in Tables 4-6 and the diagnostic is shown in Figure 2.
Table 4: Linear regression output for beta and realized return
Model R R Square
Adjusted R Square
Std. Error of
the Estimate Change Statistics R Square
Change F
Change df1 df2
Sig. F Change 1 0.033a 0.001 -0.003 0.22158 0.001 0.285 1 268 0.594
Note: Dependent Variable: Realized Return a. Predictors: (Constant), beta
Table 5: Anova output for beta and realized return
Model Sum of
Squares df
Mean
Square F Sig.
1
Regression Residual
Total
0.014 13.158 13.172
1 268 269
0.014
0.049 0.285 0.594
a
Note: Dependent Variable: Realized Return a. Predictors: (Constant), beta
Table 6: Collinearity analysis for beta and realized return Unstandardized
Coefficients
Standardized Coefficients
Collinearity Statistics Model Beta Std. Error Beta T Sig. Tolerance VIF
1
Constant
Beta
0.075 -0.019
0.038 0.036
-0.033
2.006 0.533
0.046
0.594 1.000 1.000
275
Figure 2: P-P plot Normal Distribution for Beta and Realized Return
From the above tables (4-6) it can be inferred that the R2 value is extremely low and 0.1% of the
variation in Actual Return is explained by risk. The regression model is not fit as the significance value of F (0.594) is more than 0.05. The Market Beta and Realised Return are negatively related as indicated by the regression coefficient. Further, the relationship is not statistically significant as the significance value of t (0.594) is more than 0.05. The PP plot for regression residuals is normally distributed, which is satisfactory.
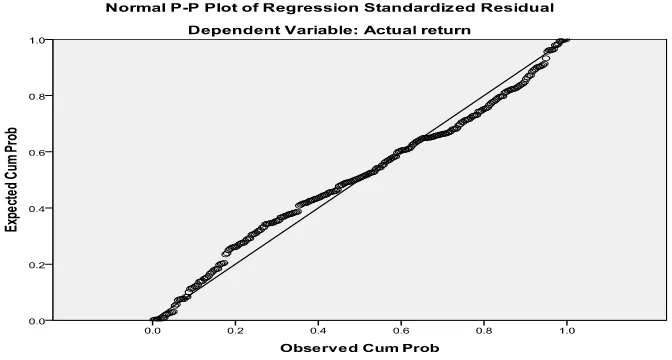
4.3. Relationship between the expected return and the realized return
Based on the prior results, we now try to analyze whether there is any relationship between the realized return and the expected return. A relationship between the two is extremely necessary for the investors who properly analyze the returns and undertake a risk. However, we found no significant relationship between the two and we could say that the Markowitz model is not possible to implement in the real world even though the relationship holds good. The results are detailed in Table 7-9 and the diagnostic is shown in Figure 3.
Table 7: Linear regression output for expected return and realized (actual) return
Model R R Square
Adjusted R Square
Std. Error of
the Estimate Change Statistics R Square
Change F
Change df1 df2
Sig. F Change 1 0.074a 0.005 0.002 0.2210 0.005 1.480 1 268 0.225
Note: Dependent Variable: Expected Return a. Predictors: (Constant), Return
Table 8: Anova output for expected return and realized (actual) return
Model Sum of
Squares df
Mean
Square F Sig.
1
Regression Residual
Total
0.072 13.100 13.172
1 268 269
0.072
0.049 1.480 0.225
a
276
Table 9: Collinearity analysis for expected return and realized (actual) return Unstandardized
Coefficients
Standardized Coefficients
Collinearity Statistics Model Beta Std. Error Beta T Sig. Tolerance VIF
1
Constant
Beta
0.055 0.006
0.014 0.005
0.074
4.085 1.216
0.000
0.225 1.000 1.000
Note: Dependent Variable: Realized Return
Figure 3: P –P plot for normal distribution
From the above tables (7-9) it can be inferred that the R2 value is extremely low and 0.5% of the
variation in the Realized (Actual) Return is explained by the Expected Return. The regression model is not fit as the significance value of F (0.225) is more than 0.05. The Expected Return and Realised Return are positively related as indicated by the regression coefficient. Further, the relationship is not statistically significant as the significance value of t (0.225) is more than 0.05. The PP plot for regression residuals is normally distributed, which is satisfactory.
5. CONCLUSION
The opportunistic behavior of investors has made the market trends unpredictable. With increasing market volatility, to achieve a desirable return from investments has become a key challenge. In the past, the investment stalwarts preferred the Markowitz expected the return and risk-based relationship theory. The validity of Markowitz theory has been analyzed in the realistic market scenario. Macroeconomic factors affect the expected return and make the predictability of realized return on the basis of expected return a tough challenge. The present study makes an attempt to unfold a new idea in investment scenario where Markowitz theory is empirically tested on Realized return and risk as well as on realized return and expected return. The findings show that a large variation in Expected Return is explained by the risk alone and this risk (Market Beta) and Expected return are significantly negatively related. However, the risk (Market Beta) and Realized return are insignificantly related. This suggests that even though the expected or the predicted returns depend on the risk of the portfolio, the return realized has no significant relationship with the risk in the portfolio.
277
we could say that the Markowitz model is not possible to implement in the real world even though the relationship holds good. This study acts as one of the guiding tools for investors in transforming their new age investment philosophy.
The main limitation of this study is that sample size of only 30 (top 30 companies of BSE’s Sensex) companies has been taken. The return also depends on factors other than risk. These factors have not been considered it here but they could be incorporated in future to have a better result. This paper has provided new insights for the researchers and financial analysts to think beyond the Markowitz optimal portfolio theory that is based upon only expected return. The findings of this paper will put their mind to think on realistic approach and guide them to think on realistic return rather than expected return.
Funding: This study received no specific financial support.
Competing Interests: The author declares that s/he has no conflict of interests.
Contributors/Acknowledgement: All authors participated equally in designing and estimation of current research.
Views and opinions expressed in this study are the views and opinions of the authors, Asian Journal of Empirical Research shall not be responsible or answerable for any loss, damage or liability etc. caused in relation to/arising out of the use of the content.
References
Ali, B. H., & Ali, M. (2013). Risk adjusted performance: A two model approach application in amman stock exchange. International Journal of Business and Social Science, 3(7), 34-45. Alonso, F., & Restoy, F. (1995). The remuneration of volatility in the Spanish equity market.
Currency and Credit, 200, 99-115.
Ang, A., Hodrick, R. J., Xing, Y., & Zhang, X. (2006). The cross-section of volatility and expected returns. Journal of Finance, 51, 259-299.
Briec, W., & Kerstens, K. (2009). Multi-horizon Markowitz portfolio performance appraisals: A general approach. Omega, 37, 50-62.
Coggin, T. D., & Hunter, J. E. (1985). Are High-beta, Large-capitalisation over Priced?. Financial Analysts Journal, 41, 70-71.
Fama, E. F., & French, K. R. (1992). The cross-section of expected stock returns. Journal of Finance, 47, 427-465.
Horasanli, M., & Neslihan, F. (2007). Portfolio selection by time varying covariance Matrix. Journal of Economics and Social Research, 9(2), 2-122.
Kolani, P., & Ekoui, V. A. (2014). An analysis of relationship between risk and expected return in BRVM stock exchange: Test of CAPM. Research in World Economy, 5(1), 13-28.
Michaud, R. O. (1989). The Markowitz optimization enigma: Is 'optimized' optimal?. Financial Analysts Journal, 45(1), 31-42.
Novak, J. (2015). Systematic risk changes, negative realized excess returns and time-varying CAPM Beta. Finance a úvěr-Czech Journal of Economics and Finance, 2:167-190.
Pastor, L., & Stambaugh, R. F. (2003). Liquidity risk and expected stock returns. Journal of Political Economy, 111, 642–685.
Perkovic, A. (2011). Research of Beta as adequate risk Measure – Is Beta still Alive. Croatian Operational research review (CORR), 2, 102-111.
Plessis, A. D., & Ward, M. (2009). A note on applying the Markowitz portfolio selection model as a passive investment strategy on the JSE. Investment Analysts Journal, 69, 39-46.
Salman, F. (2002). Risk-return-volume relationship in an emerging stock market. Applied Economics Letters, 9, 549-552.
Sarker, M. R. (2013). Markowitz portfolio model: evidence form dhaka stock exchange in Bangladesh. IOSR Journal of Business and Management, 8(6), 68-73.
Sharpe, W. F. (1964). Capital asset prices: A theory of market equilibrium under conditions of risk.
278
Terol, A. B., Gladish, B. P., & Ibias, J. A., (2006). Selecting the optimum portfolio using fuzzy compromise programming and Sharpe’s single-index model. Applied Mathematics and Computation, 182, 644-664.
Theriou, N. G., Aggelidis, V. G., & Meditinos, D. I. (2010). Testing the relation between beta and returns in the Athens stock exchange. Managerial Finance, 36(12), 1043-1056.