IJEDR1603166
International Journal of Engineering Development and Research (www.ijedr.org)1046
Optimization of Process Parameters for Dry
Machining of Ti6Al4V with Textured Tools using
Genetic Algorithm Approach
1Pankaj Rathod*, 2S Aravindan, 3Venkateswara Rao P 1,2Associate Professor, 3Professor
1Department of Mechanical Engineering, 1L D College of Engineering, Ahmedabad: 380009, India
________________________________________________________________________________________________________
Abstract - Conditions at the chip-tool interface govern the cutting forces, heat generation, tool life and more importantly, quality of the finished product. Friction between the flowing chip and the rake and flank faces of the tool decides all these. One way of reducing friction at the chip-tool interface is proper application of lubrication andthe other way is modifying the geometry of the cutting tool. In this research, textures have been developed at the rake face of the cutting tool inserts
using focused ion beam machining (FIB). The textured inserts have been subsequently coated with WS2/Zr solid lubricants
through pulsed DC magnetron sputtering process. The various parameters of the textures have been varied to study their effect on the friction between the chip and rake face of the tool. Cutting speed is also varied keeping feed rate and depth of cut constant. The textures are reported to reduce the friction at the chip-tool interface by reducing the chip-tool contact area and behaving as reservoirs for the solid lubricant. The cutting parameters viz. cutting speed, width of grooves, depth of grooves and pitch of grooves have been optimized through Genetic Algorithm. The lowest main cutting force achieved with non-textured tools was 147 N at 80 m/min cutting speed and that for textured tools was 88.83N at 100 m/min cutting speed indicating an improvement of 39.57%. The optimized tool further reduced cutting force by 13.79%.
Keywords - Ti6Al4V machining, Focused ion beam machining, Solid lubricant, Genetic algorithm, Optimization, Pulsed DC magnetron sputtering.
________________________________________________________________________________________________________ I. INTRODUCTION
Titanium alloy Ti6Al4V is normally machined using a copious supply of cutting fluid. Cutting fluid helps in reducing the heat generated at the tool-chip interface; it washes away the products of machining, and reduces the friction at the tool-chip interface owing to its lubricating properties. Use of cutting fluids also has its adverse effects. It causes skin irritation due to the bacterial growth, respiratory problems due to the fumes coming out during machining to the machine tool operators. It also creates water and air pollution. The maintenance and disposal of the cutting fluid is costlier than its material cost but it is essential following the strict environmental protection regulations in almost all countries. The alternative strategy for reduction of the use of cutting fluids is to use minimum quantity lubrication or to totally avoid its use i.e. employ dry machining. But, dry machining increases the friction and adhesion between the tool and workpiece, in turn, increasing heat generation and deteriorating surface quality of the product. It is difficult or almost impossible for the cutting fluid to penetrate the tool-chip interface at high cutting speed. Solid lubricants can be applied at the tool-chip interface itself and that way provide better lubrication and overcome the limitations of dry machining.[1-3]
WS2 is a solid lubricant having a very low coefficient of friction and anti-galling property. WS2 has been successfully applied
as a solid lubricant while machining different metals. WS2 can be applied to a surface by burnishing or sputter coating. Sputter
coating provides a more uniform layer and has a longer life. But, WS2 coating being very soft, the sputtered layer is quickly
removed due to the friction between the chip and tool surface. Surface textures can be produced at the chip-tool interface to retain the solid lubricants for a longer time.[4] Surface textures have another advantage of reducing the chip-tool contact area and thereby reducing friction at the chip-tool interface [5, 6]. Novel square textures are developed at the rake face of the cutting tool inserts and coated with Zr/WS2 solid lubricant. The present study attempts to optimize the dimensions of square textures (width,
depth and pitch), and the cutting speed while machining Ti6Al4V alloy. II. EXPERIMENTAL PROCEDURE
The cutting tool holder specified as PCLNL2020K12 and the WC insert CNMA 120408 having the basic features as inclination angle (λ)=-60 Orthogonal Rake Angle (ɣ
o)= -60 and Nose radius Rε =0.8mm are used for conducting the
experiments.The textures were created using focused ion beam machining. A gap of 50µm is left between the cutting edge and the texture to retain the strength of the tool at the apex. The dimensions of the texture parameters were; width of the grooves= 1 to 5 µm, depth of grooves=1 to 5 µm, and pitch of grooves=5 to 25 µm. The width of the texture perpendicular to the chip flow direction is about 700 µm and length of the texture along the chip flow direction is 700 µm. Fig. 1 (a) shows the chip flow direction with respect to the orientation of the surface texture. The cutting tool inserts are coated with Zr/WS2 solid lubricants
IJEDR1603166
International Journal of Engineering Development and Research (www.ijedr.org)1047
(a)
(b) Uncoated (c) WS2Coated
Fig.1 Surface texture developed at the rake face of cutting tools Fig.2 shows the SEM image of the cross section of the textures depicting the depth, width and pitch.
Fig. 2 Cross section of the grooves The machining set up is shown in Fig.3.
Fig.3 Photographic view of the Experimental Setup Chip flow
direction
Width
Depth
IJEDR1603166
International Journal of Engineering Development and Research (www.ijedr.org)1048
The responses measured were the cutting force components (main cutting force Pz, axial thrust force Px and radial thrust forcePy) and surface roughness. For force measurement, a dynamometer (Kistler 9129) with charge amplifier (multichannel charge
amplifier type 5070A) was employed. The forces reported were measured when the process was in the steady stable state. Surface roughness of the machined surface was measured by Form Talysurf surface roughness tester.
III. DESIGN OF EXPERIMENTS
The aim of Design of Experiments (DOE) is to identify the active factors and evaluate their effects on the selected responses. A meticulously planned and properly implemented experimental procedure results in an effective and accurate experimental program. For a design of experiments containing 4 factors and each factor having five levels, a full factorial design would require 625 (54) experiments. This is expensive considering the cost and time requirements. And many a time, it is not required also.
Central Composite Design (CCD) is a technique which reduces the number of experiments and provides adequate representation of all the factors.
Experiments were conducted using central composite design. In the present investigation, the independent variables are cutting speed and depth, width and pitch of the surface texture. The responses measured are cutting force and surface roughne ss. CCD technique is useful in studying the sequential effect of the independent process variables on the contemplated responses. Implementation of CCD has also reduced the number of experiments from 625 to 30. It is also useful to see the repeatabilit y of the experimental results. Central composite design (CCD) is the most popular class of second order design suggested by Box and Wilson [7-9]. Table 1presents the parameters and their levels.
Table 1 Process parameters and their levels
Factors -2 -1 0 +1 +2
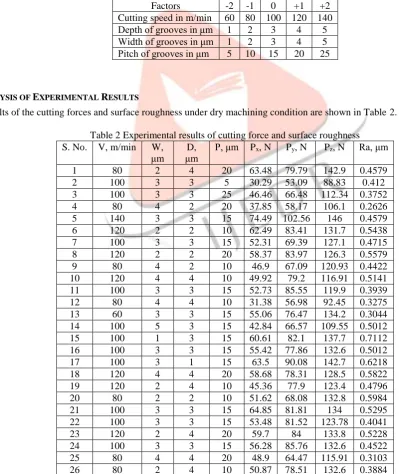
Cutting speed in m/min 60 80 100 120 140 Depth of grooves in μm 1 2 3 4 5 Width of grooves in μm 1 2 3 4 5 Pitch of grooves in μm 5 10 15 20 25
IV. ANALYSIS OF EXPERIMENTAL RESULTS
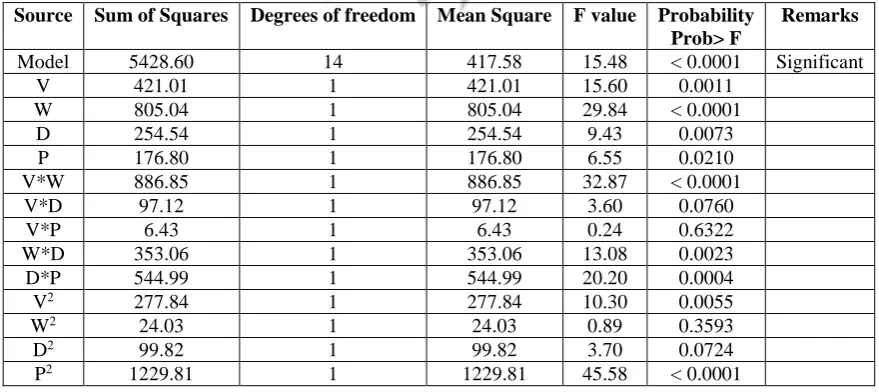
The results of the cutting forces and surface roughness under dry machining condition are shown in Table 2. Table 2 Experimental results of cutting force and surface roughness
S. No. V, m/min W, μm
D,
μm P, μm Px
, N Py, N Pz, N Ra, μm
1 80 2 4 20 63.48 79.79 142.9 0.4579
2 100 3 3 5 30.29 53.09 88.83 0.412
3 100 3 3 25 46.46 66.48 112.34 0.3752
4 80 4 2 20 37.85 58.17 106.1 0.2626
5 140 3 3 15 74.49 102.56 146 0.4579
6 120 2 2 10 62.49 83.41 131.7 0.5438
7 100 3 3 15 52.31 69.39 127.1 0.4715
8 120 2 2 20 58.37 83.97 126.3 0.5579
9 80 4 2 10 46.9 67.09 120.93 0.4422
10 120 4 4 10 49.92 79.2 116.91 0.5141
11 100 3 3 15 52.73 85.55 119.9 0.3939
12 80 4 4 10 31.38 56.98 92.45 0.3275
13 60 3 3 15 55.06 76.47 134.2 0.3044
14 100 5 3 15 42.84 66.57 109.55 0.5012
15 100 1 3 15 60.61 82.1 137.7 0.7112
16 100 3 3 15 55.42 77.86 132.6 0.5012
17 100 3 1 15 63.5 90.08 142.7 0.6218
18 120 4 4 20 58.68 78.31 128.5 0.5822
19 120 2 4 10 45.36 77.9 123.4 0.4796
20 80 2 2 10 51.62 68.08 132.8 0.5984
21 100 3 3 15 64.85 81.81 134 0.5295
22 100 3 3 15 53.48 81.52 123.78 0.4041
23 120 2 4 20 59.7 84 133.8 0.5228
24 100 3 3 15 56.28 85.76 132.6 0.4522
25 80 4 4 20 48.9 64.47 115.91 0.3103
IJEDR1603166
International Journal of Engineering Development and Research (www.ijedr.org)1049
27 120 4 2 20 63.63 95.16 137.7 0.4559
28 100 3 5 15 52.28 68.89 127.3 0.5114
29 80 2 2 20 53.58 79.4 128 0.5022
30 120 4 2 10 72.43 92.6 150.3 0.4992
Where, V=cutting speed, W=width of grooves, D=depth of grooves, P=Pitch of grooves Px=axial thrust force, Py=radial thrust force, Pz=main cutting force, Ra=surface roughness, µm
Pz being the principal cutting force, the machining variables (V, W, D and P) are optimized to minimize Pz.
Using Design expert software (Version 8.01), the experimental data points were analyzed through the following procedures; Analysis of variance (ANOVA) (Analysis of variance is performed to find the effect of factors and their interactions with the
responses. ANOVA provides an estimate of variance via the mean square of the residuals).
Lack of fit test (Lack of fit test implies whether the model adequately describes the actual response surface.)
Model summary statistics (Analysis of R-squared values) (R2 is the corresponding reduction in error in estimating the
response for the experimental variation in the independent variables. That is, R2 reflects the number of errors made when
using the regression model to assess the value of the responses, mean as the basis for estimating all results).
As shown in Fig.4 (a), the cutting force components Pz, Py and Px increase with increase in cutting speed from 60 to 140
m/min. The cutting force components for textured tools are less than that for the non-textured tools. The highest reduction in main cutting force is observed for textured tools is at 100 m/min which is about 39.57% less as compared to the non-textured tool. The friction force and normal force also follow the same trend. The coefficient of friction for the textured tools is less than that for the non-textured tools upto 400 m/min cutting speed. At 500 m/min cutting speed both are almost same (Fig. 4 b). Fig.5 shows the influence of variation in groove width, depth and pitch on cutting force components Px, Py, Pz. Increase in width and depth of
grooves causes the cutting force components to decrease while decrease in pitch reduces them.The reason is, increase in width and depth of the grooves improves the capacity of the textures to store solid lubricants. Decrease in pitch also has the same effect.
(a) (b)
Fig.4 Variation in cutting force components Px, Py, Pz, friction force, normal force and coefficient of friction with cutting speed.
Fig.5 Influence of variation in groove width, depth and pitch on cutting force components Px, Py, Pz
W=width of grooves, µm D=depth of grooves, µm P=pitch of grooves µm, Pz=main cutting force, Py=radial thrust force, Px=axial
thrust force, F=friction force, N=normal force, µa=apparent coefficient of friction, NT (UG)=non-textured tool, Sq=Square textured tool.
V. OPTIMIZATION OF CUTTING SPEED AND TEXTURE DIMENSIONS
By conducting experiments and applying regression analysis, a model explaining the influence of the independent variables on the response(s) can be built. Regression analysis is conducted to investigate the functional relationship between output and input decision variables of a cutting process and may be useful for cutting process data description, parameter estimation, and control [10].
Optimization of machining parameters enhances productivity and also improves the product quality. The main objective of the present work is to optimize the Ti6Al4V machining conditions in order to achieve minimum cutting force as it is the important factor affecting the quality of machining and machined components. In this context, an effort has been made to minimize the cutting force using Genetic Algorithm (GA).
Genetic algorithms belong to the larger class of evolutionary algorithms (EA), which generate solutions to optimization problems using techniques inspired by natural evolution, such as inheritance, mutation, selection and cross over.
In short, the basic four steps used in simple Genetic Algorithm to solve a problem are,[11] 40 60 80 100 120 140 160
60 80 100 120 140
Force com pone nt s, N
Cutting speed, m/min
Px NT Px Sq Py NT Py Sq Pz NT Pz Sq 0.00 0.10 0.20 0.30 0.40 0.50 0.60 20 40 60 80 100 120 140 160
60 80 100 120 140
F,
N
&
µa
Cutting speed, m/min
F UG F Sq N UG N Sq μa NT μa Sq 0 50 100 150
1 2 3 4 5
C ut ti ng f orce s, N
Width of grooves, μm Px Py Pz 0 50 100 150
1 2 3 4 5
C ut ti ng f orce s, N
Depth of grooves, μm Px Py Pz 0 20 40 60 80 100 120 140
5 10 15 20 25
C ut ti ng f orce s, N
Pitch of grooves, μm Px
Py
IJEDR1603166
International Journal of Engineering Development and Research (www.ijedr.org)1050
1. Suitable representation of the problem.2. Calculate the fitness.
3. Identify the variables and parameters which control the algorithm 4. Present the results and specify the way of terminating the algorithm
VI. 3.3ANOVA OF THE RESPONSES
Analysis of variance (ANOVA) has been performed to find the effect of factors and their interactions on the measured response.
Final Equation in Terms of Actual Factors Main cutting force
Pz =+229.90042 - 2.03406*V - 23.30792*W - 5.80042*D + 5.71008*P + 0.37225*V*W - 0.12319 *V*D - 6.33750E-003*V*P - 4.69750*W*D + 2.26725*D*P + 7.95677E - 003*V2 - 0.93604*W2 + 1.90771*D2 - 0.26784*P2
(1)
Where V=Cutting velocity, W=Width of grooves, D=Depth of grooves, P=Pitch of grooves Table 3 Regression analysis of main cutting force
Std. Dev. 5.19 R-Squared 0.9263 Mean 126.30 Adj R-Squared 0.8665 C.V. % 4.11 Pred R-Squared 0.7321 PRESS 1569.76 Adeq Precision 15.711 Table 4 ANOVA for the Quadratic main cutting force model Source Sum of Squares Degree of
freedom
Mean squares F-ratio Remarks
Model 5428.60 13 417.58 15.48 Significant
Residual 431.72 16 26.98
Lack of fit 269.82 11 26.93 0.76 Not significant
Pure error 161.90 5 24.53
Cor. Total 5860.32 29
As presented in Table 3, the multiple regression coefficient of the quadratic main cutting force model is estimated to 0.9263. This means that 92.63% of the variance in the main cutting force is explained uniquely or jointly by the independent variable and hence quadratic cutting force model developed is strong enough to be used in predicting the main cutting force. Table 4 shows the probability values for each individual variable.
The “Pred-R Squared” of 0.7321is in reasonable agreement with the “Adj R Squared” of 0.8665. Reasonable agreement between these two terms of regression shows that data obtained through the experimental investigations is properly fitted through the mathematical models obtained through the regression analysis.
Table 5 Tests on the individual variable for the quadratic main cutting force model Source Sum of Squares Degrees of freedom Mean Square F value Probability
Prob> F
Remarks
Model 5428.60 14 417.58 15.48 < 0.0001 Significant
V 421.01 1 421.01 15.60 0.0011
W 805.04 1 805.04 29.84 < 0.0001
D 254.54 1 254.54 9.43 0.0073
P 176.80 1 176.80 6.55 0.0210
V*W 886.85 1 886.85 32.87 < 0.0001
V*D 97.12 1 97.12 3.60 0.0760
V*P 6.43 1 6.43 0.24 0.6322
W*D 353.06 1 353.06 13.08 0.0023
D*P 544.99 1 544.99 20.20 0.0004
V2 277.84 1 277.84 10.30 0.0055
W2 24.03 1 24.03 0.89 0.3593
D2 99.82 1 99.82 3.70 0.0724
P2 1229.81 1 1229.81 45.58 < 0.0001
IJEDR1603166
International Journal of Engineering Development and Research (www.ijedr.org)1051
this case V, W, D, P, V*W, W*D, D*P V2 and P2 are significant model terms. Groove width is the most significant term in maincutting force. Cutting speed is next significant term. Least significant term out of four process parameters chosen for the present research work is pitch of grooves.
The "Lack of Fit F-value" of 0.76 implies the Lack of Fit is not significant relative to the pure error (Table 4). There is a 67.53%chance that a "Lack of Fit F-value" this large could occur due to noise. Model is suitably fit if lack of fit is non- significant. "Adeq Precision" measures the signal to noise ratio. A ratio greater than 4 is desirable. The ratio of 15.711 indicates an adequate signal. This model can be used to navigate the design space
Using the mathematical models of various response variables, prediction and calculation of these variables can be done for wider range of process parameters. It is easier through the use of these equations to study the effect of one particular proc ess parameter on any particular response variable, keeping other process parameters constant. This will help to understand the effect of individual process parameter on the response variables.
The response calculated from these models, for each set of the coded variables, can be represented in graphical form and the effect of the different process variables viz. cuttingspeed, width of grooves, depth of grooves, and pitch of grooves on the cutting forces and surface roughness value can be interpreted with the help of the graphs.
If the model is correct and the assumptions are satisfied, the residuals should be structureless; in particular, they should be unrelated to any other variable including the predicted response. This plot should not reveal any obvious pattern [12]. None of the residuals and studentized residuals is large enough to indicate any problem with the obtained response model. Further, adequacy of developed model has also been checked from the normal probability plot and residuals vs. predicted response plot. The residuals plotted are studentized; in other words, none of the actual response data is deleted prior to calculating their deviation from the model prediction. The studentization is essential for accurately diagnosing residuals because it adjusts for varying leverage in design points. Fig.6 and Fig.7 show the normal probability plot of the residuals and plot of the residual versus the predicted response for the quadratic surface roughness model respectively. It is observed from these plots that the residuals fall on a straight line implying that the errors are distributed normally. This implies that the model proposed is adequate and there is no reason to suspect any violation of the independent or constant variance assumption. Hence, it can be concluded that the model developed is statistically solid and it can be used for further analysis to determine effects of various parameters on the response.
Fig.6 Normal % Probability vs individually studentized residuals for quadratic main cutting force model
IJEDR1603166
International Journal of Engineering Development and Research (www.ijedr.org)1052
Y =+229.90042 - 2.03406* x1 - 23.30792* x2 - 5.80042* x3 + 5.71008* x4 + 0.37225* x1*x2- 0.12319*x1*x3-6.33750E-003*x1*x4- 4.69750*x2*x3+ 2.26725*x3*x4+ 7.95677E - 003*x12 - 0.93604*x22 + 1.90771*x32 - 0.26784*x42
(2)
Where Y=main cutting force in N, x1=cutting speed in m/min, x2=width of grooves in µm, x3=depth of grooves in µm, x4=pitch of
grooves in µm. Subject to 60 < x1< 140
1 < x2< 5
1 < x3< 5
5 < x4< 25
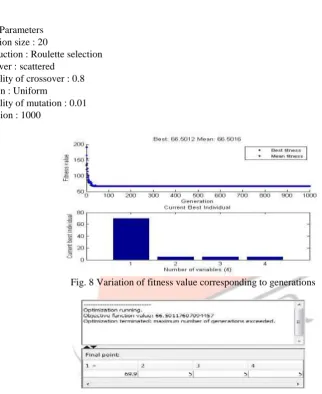
GA Operational Parameters Population size : 20
Reproduction : Roulette selection Cross over : scattered
Probability of crossover : 0.8 Mutation : Uniform
Probability of mutation : 0.01 Generation : 1000
Fig. 8 Variation of fitness value corresponding to generations
Fig.9 Optimum cutting conditions derived using Genetic Algorithm Pz=66.50 N for the optimized parameters.
The actual tool manufactured to the attained optimization i.e. cutting speed=70 m/min, width of grooves=5µm, depth of grooves=5µm, and pitch of the grooves=5µm, was tested which gave the Pz=76.58 N which was 15.16% more than the theoretical optimized main cutting force.
The lowest main cutting force achieved with non-textured tools was 147 N at 80 m/min cutting speed and that for textured tools was 88.83 N at 100 m/min cutting speed and texture dimensions 3 width, 3 depth and 5 pitch. Thus, it indicates an improvement of 39.57 %. The optimized tool further improved the performance by 13.79% as shown in the Table 6.
Table 6 Improvement in results using optimized tool
Material Lowest achieved with textured tools Achieved with optimized tool %age Improvement
Pz, N Ra, µm Pz, N Ra µm Pz, N Ra µm
IJEDR1603166
International Journal of Engineering Development and Research (www.ijedr.org)1053
VII. CONCLUSIONS
In this study, Ti6Al4V titanium alloy was turned using textured and subsequently coated (Zr/WS2) tools at a range of cutting
speeds and texture dimensions. The cutting speed and texture dimensions as independent factors affecting cutting force and surface roughness have been optimized using Genetic Algorithm. The following conclusions were arrived at;
1. Textured tools effectively reduce cutting forces and coefficient of friction as compared to the non-textured tools.
2. The analysis of variance (ANOVA) showed that the mathematical model developed using response surface methodology is adequate.
3. The optimized parameters of cutting speed, width of grooves, depth of grooves and pitch of grooves on application of Genetic Algorithm were found to be 60 m/min, 5 µm, 5 µm, and 5 µm respectively for main cutting force Pz.
VIII. REFERENCES
[1] Klocke, F. and G. Eisenblätter, Dry Cutting. CIRP Annals - Manufacturing Technology, 1997. 46(2): p. 519-526. [2] Aronson, R.B., Why dry machining? Manufacturing Engineering, 1995. 114(1): p. 33-36.
[3] Sreejith, P.S. and B.K.A. Ngoi, Dry machining: Machining of the future. Journal of Materials Processing Technology, 2000. 101(1–3): p. 287-291.
[4] de Agustina, B., et al., Analysis of the machinability of aluminium alloys UNS A97050-T7 and UNS A92024-T3 during short dry turning tests. Advanced Materials Research, 2011. 264: p. 931-936.
[5] Blatter, A., et al., Lubricated friction of laser micro-patterned sapphire flats. Tribology letters, 1998. 4(3-4): p. 237-241. [6] Suh, N.P., M. Mosleh, and P.S. Howard, Control of friction. Wear, 1994. 175(1): p. 151-158.
[7] Khuri, A.I. and S. Mukhopadhyay, Response surface methodology. Wiley Interdisciplinary Reviews: Computational Statistics, 2010. 2(2): p. 128-149.
[8] Renevier, N., et al., Performance and limitations of MoS2/Ti composite coated inserts. Surface and Coatings Technology, 2003. 172(1): p. 13-23.
[9] Myers, R. and D. Montgomery, Response surface methodology, 1995. Willey Inter-Science.
[10] Mukherjee, I. and P.K. Ray, A review of optimization techniques in metal cutting processes. Computers & Industrial Engineering, 2006. 50(1): p. 15-34.