Nature and Science of Sleep 2016:8 197–205
Nature and Science of Sleep
Dove
press
submit your manuscript | www.dovepress.com 197
O R I G I N A L R E S E A R C H
open access to scientific and medical research
Open Access Full Text Article
Sex differences in sleep apnea predictors and
outcomes from home sleep apnea testing
Alyssa Cairns1
Greg Poulos1
Richard Bogan1–3
1Research Division, SleepMed, Inc., 2School of Medicine, The University of South Carolina Medical School, Columbia, 3School of Medicine, The Medical University of South Carolina, Charleston, SC, USA
Study objectives: To evaluate sex differences in predictors of obstructive sleep apnea (OSA) as per outcomes from home sleep apnea testing.
Design: This was a retrospective analysis of a large repository of anonymous test results and pretest risk factors for OSA.
Setting and patients: A total of 272,705 patients were referred for home sleep apnea
test-ing from a variety of clinical practices for suspected sleep disordered breathtest-ing across North America from 2009 to 2013.
Interventions: Not applicable.
Measurements and results: Predictors of OSA (apnea hypopnea index4%≥5) were
evalu-ated by multiple logistic regression; sex differences were evaluevalu-ated by interaction effects. Middle age was the single most robust predictor of OSA for both sexes and was particularly foretelling for females (P<0.001) even after controlling for measures of adiposity and medical conditions. Females over the age of 45 years were much more likely to have OSA compared to their younger counterparts (78.7% vs 42.5%, respectively; odds ratio: 5.0) versus males (88.1% vs 68.8%, respectively; odds ratio: 3.4). Snoring, although more frequently reported by males, was similarly predictive of OSA for both sexes. Witnessed apneas and measures of adiposity were better predictors of OSA for males than females. Insomnia, depression, and use of sleep medication, although more commonly reported in females, did not predict OSA. Hypertension, although equally reported by both sexes, performed better as a predictor in females (P<0.001), even after controlling for age, measures of adiposity, and other medical conditions. Diabetes, heart disease, stroke, and sleepiness did not contribute unique variance in OSA in adjusted models.
Conclusion: This study found that males and females report different symptoms upon
clini-cal evaluation for suspected sleep apnea, with some of the “classic” OSA features to be more common in and robustly predictive for males. The finding that advancing age uniquely and robustly predicted OSA in females reinforces our understanding that age-related changes in sex hormones play a role in the development and/or manifestation of sleep disordered breath-ing. Need exists for sex-specific prediction models and quantification of menopausal status in OSA screening tools.
Keywords: home sleep test, portable monitor, HSAT, ARES
Introduction
Obstructive sleep apnea (OSA) syndrome is a serious medical condition associated with increased morbidity, mortality, and high direct and indirect costs.1 Diagnosing Correspondence: Alyssa Cairns
SleepMed, Inc. Columbia, 700 Gervais Street, Suite 200, Columbia, SC 29201, USA
Email acairns@sleepmedinc.com
Journal name: Nature and Science of Sleep Article Designation: ORIGINAL RESEARCH Year: 2016
Volume: 8
Running head verso: Cairns et al
Running head recto: Sex differences in OSA DOI: http://dx.doi.org/10.2147/NSS.S101186
Nature and Science of Sleep downloaded from https://www.dovepress.com/ by 118.70.13.36 on 24-Aug-2020
For personal use only.
This article was published in the following Dove Press journal: Nature and Science of Sleep
29 June 2016
Dovepress
Cairns et al
OSA has traditionally required an attended polysomnogram. However, home sleep apnea testing (HSAT) is an alterna-tive for carefully selected patients with a high pretest prob-ability of moderate to severe OSA.2 Although “high pretest probability” is not a clear-cut phenotype,3 practitioners are encouraged to rely on well-known risk factors for OSA, such as obesity, male sex, advancing age, snoring, gasping/ witnessed apneas, and sleepiness.4 Male sex is a known risk factor for OSA with a male-to-female ratio conservatively estimated at between 3 and 5:1 in the general population.5,6 However, there appears to be a general underrecognition of OSA in females because studies on clinical samples suggest a much sex wider sex gap in presentation for the evaluation of sleep disordered breathing (between 6 and 10:1).5,6 Further, data suggest that females have a more delayed diagnosis as they are typically older, heavier, and report more medical comorbidities at the time of clinical evaluation.6 Sex differ-ences in the prevalence of OSA have been attributed to a number of factors, including differences in body fat distribu-tion, craniofacial anatomy/airway mechanics, and lifestyle risk factors, such as alcohol and tobacco use.7
Although male risk for OSA is apparent, recent data have suggested that the male–female gap in OSA may be smaller than once believed. Instead, it has been hypothesized that females with OSA may not present the same clinical symp-toms as their male counterparts and, thus, may be less likely to present to a sleep practitioner and/or may be less likely to be referred for sleep testing. For example, females with OSA may be less likely to report some of the aforementioned classic “high pretest” features of OSA, including witnessed apneas,8 and instead report symptoms of disrupted sleep, depression, and insomnia.8,9
Furthermore, female risk for OSA, and thus clinical symptoms, is likely moderated by menopausal status. Gen-erally speaking, the menopausal period is associated with a 3.5–4 factor increase in OSA risk for females controlling for other factors that can influence OSA risk, such as age and body mass index (BMI).7,10 Although the relationship between menopause and OSA is complex, risk for sleep disordered breathing is at least partially attributed to estrogen and progesterone-mediated changes in body fat distribution and airway anatomy and mechanics.11,12 Since the OSA testing landscape has undergone a paradigm shift toward unattended sleep testing where clinicians are encouraged to rely on high pretest indicators of OSA, it is worthwhile to reevaluate the utility of said indicators for males and females on actual HSAT outcomes. The following domains were investigated:
1) self-reported OSA symptoms, 2) adiposity, 3) common medical comorbidities, and 4) age.
Methods
Sleep data were acquired from a large repository of anony-mous HSAT outcomes from 2009 to 2013. The study was evaluated and approved by the Schulman Institutional Review Board. Home apnea testing was completed using the Apnea Risk Evaluation System (ARES) model 610, which simultaneously records airflow by via nasal cannula, oxygen saturation (SpO2) and heart rate by forehead reflectance pulse oximetry, snoring via a calibrated acoustic microphone, and head position/movement via forehead accelerometry. The device’s algorithm estimates sleep time using behavioral indi-cators of quiescence (nonmovement and regularity in nasal flow and/or snoring).13 The device and associated autoscoring algorithm have demonstrated adequate sensitivity (0.98) and specificity (0.84) when compared to simultaneously recorded polysomnogram using an apnea hypopnea index (AHI) cutoff of ≥5 events per hour.14 As per standard protocol, all raw data were autoscored, edited by a registered sleep technologist, and interpreted by a physician.
The AHI and a respiratory disturbance index were calcu-lated as the average number of apneas (no apparent airflow) and hypopneas (≥50% reduction in flow plus a ≥4% desatura-tion) per hour of valid recording time and the average number of apneas, hypopneas (4%), plus flow-limited events (≥50% reduction in flow that terminated with increased movement, snoring, and/or pulse rate) and ≥1% desaturation per hour of valid recording time, respectively. For the ARES, valid recording time is defined as the length of the sleep period minus wake after sleep onset (actigraphy based) and periods of poor signal integrity. Risk factors for OSA were extracted from the ARES OSA screening questionnaire,15 which assesses a variety of self-reported symptoms of OSA as well as anthropomorphic risk factors (BMI and neck circumfer-ence) and common comorbid medical risk factors. Self-reported OSA symptoms were assessed with the question “on average in the past month, how often have you snored or been told that you snore […] do you wake up choking or gasping […] have you ever been told that you stop breathing in your sleep or wake up choking or gasping?” and dichotomized “at least frequently (≥3–4 times/week; yes)”/“sometimes or less (≤1–2 times/week; no).” Self-reported comorbidities (yes/no) were assessed with the question “have you been diagnosed or treated for any of the following conditions?” Data on sleepiness were acquired from an embedded (in the ARES
Nature and Science of Sleep downloaded from https://www.dovepress.com/ by 118.70.13.36 on 24-Aug-2020
Dovepress Sex differences in OSA
OSA screening questionnaire) Epworth Sleepiness Scale (ESS).16 In predictive models, sleepiness was considered present if ESS ≥10. Studies were excluded from analyses if there was missing questionnaire data or if valid recording time was <2 hours.
Analyses were performed using SPSS 23.0 (IBM Cor-poration, Armonk, NY, USA). Descriptive analyses were completed to analyze the shape, central tendency, and disper-sion of all variables. Sex differences in continuous variables were analyzed using univariate analysis of variance with eta squared (h²) to estimate effect size. Descriptive differences between nominal or dichotomous variables were analyzed using chi-square (c²) with phi coefficient (F) to estimate the effect size. Phi coefficients <0.10 were considered negligible. Unadjusted and adjusted multivariable logistic regression with odds ratios and Nagelkerke R2 to estimate effect size were used to evaluate predictors of OSA. Odds ratios represent the odds that an outcome will occur given a particular exposure compared to the odds of the outcome occurring in the absence of that exposure.17 For logistic
analyses, we defined the presence of OSA as an AHI ≥5 and sex differences were evaluated using interaction terms. P-values <0.05 were considered statistically significant and all comparisons were two-tailed.
Results
The final sample size consisted of 272,705 patients. A total of 19,909 patients (6.6%) were excluded from analyses because of missing anthropomorphic or demographic data. A total of 10,295 (3.4%) studies were excluded from analyses due to insufficient recording time (defined as <2 hours) and an additional 1,590 studies (<1%) were removed due to missing questionnaire data.
Demographics and comorbidities
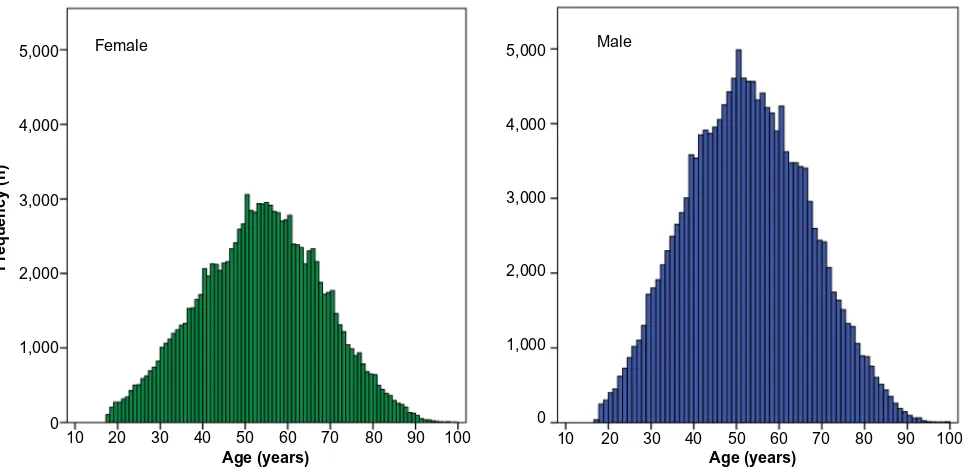
The final adult sample was comprised of slightly more males than females (57% male). Table 1 lists the demographics for the sample, and Figure 1 illustrates the similar distribution shape for age for males and females. Modal number of study nights was 1 (79%) with a mean recording duration of 6.4±1.2
Table 1 Demographics, self-reported comorbidities, and HSAT test outcomes
Outcomes Overall N=272,705 Male n=155,700 Female n=117,005 Analysese
Demographics
Age (years) 53.1±14.3 52.6±14.2 53.7±14.4 F (1, 272,703)=455.3, P<0.001; h2 =0.002
Age ≥45 (year) 70.4% 68.9% 72.3% c2 (1, 267,361)=347.4, P<0.001; F=0.04
BMI (kg/m2) 32.4±7.6 31.7±6.7 33.2±8.6 F (1, 272,703)=2,647.0, P<0.001; h2=0.010 Obese (BMI ≥30 kg/m2) 60.0% 58.4% 62.3% c2 (1, 271,234)=425.8, P<0.001; F=0.04 Neck circumference (in) 16.2±1.9 17.1±1.5 15.4±1.6 F (1, 268,571)=117,178.5, P<0.001; h2=0.304 Self-reported OSA symptomsa
Snoring 61.8% 65.9% 56.3% c2 (1, 272,695)=2,594.0, P<0.001; F=0.10
Wake choking 13.3% 13.4% 13.0% c2 (1, 272,695)=11.9, P<0.01; F=0.01
Witnessed apneas 20.4% 24.2% 15.4% c2 (1, 272,695)=3,162.0, P<0.001; F=0.11
ESS 8.8±5.4 8.7±5.3 8.9±5.4 F (1, 272,688)=49.6, P<0.001; h2=0.000
Sleepiness (ESS ≥10) 41.5% 40.6% 42.6% c2 (1, 272,698)=110.3, P<0.001; F=0.02 Self-reported comorbiditiesb
Hypertension 47.0% 46.8% 47.2% P=0.07
Depression 25.5% 17.5% 36.1% c2=(1, 272,705)=12,242.4, P<0.001, F=0.21
Insomnia 17.5% 12.9% 23.5% c2=(1, 272,705)=5,264.0, P<0.001, F=0.14
Sleep medication 17.1% 13.2% 22.3% c2=(1, 272,705)=3,909.0, P<0.001, F=0.12
Diabetes 17.1% 16.1% 18.5% c2=(1, 272,705)=274.5, P<0.001, F=0.03
Heart disease 12.9% 13.8% 11.7% c2=(1, 272,705)=275.5, P<0.001, F=0.03
Restless legs 11.4% 9.0% 14.5% c2=(1, 272,705)=2,019.0, P<0.001, F=0.09
Lung disease 7.2% 5.8% 9.1% c2=(1, 272,705)=1,131.0, P<0.001, F=0.06
Stroke 3.5% 3.2% 3.9% c2=(1, 272,705)=95.5, P<0.001, F=0.02
ARES outcomes
AHI (events/hour)c 17.1±17.8 20.1±19.3 12.8±14.3 F (1, 272,703)=13,976.5; P<0.001;h2 =0.05 RDI (events/hour)d 27.5±19.5 30.9±20.4 22.6±16.9 F (1, 272,703)=15,479.4; P<0.001;h2=0.05 Note: Values are represented as mean ± SD or percent (%); a% answer “at least frequently (3–4 times per week)” to “on average in the past month, how often have you snored or been told that you snore […] do you wake up choking or gasping […] have you ever been told that you stop breathing in your sleep or wake up choking or gasping?”; b% endorsed yes to “have you been diagnosed or treated for any of the following conditions?”; caverage of apneas and hypopneas (4%) per hour of valid recording time; daverage of apneas, hypopneas (4%), and flow limited events per hour of valid recording time; ePhi coefficients (F) <0.10 were considered negligible.
Abbreviations: AHI, apnea hypopnea index; BMI, body mass index; ESS, Epworth Sleepiness Scale; HSAT, home sleep apnea testing; OSA, obstructive sleep apnea; RDI, respiratory disturbance index; SD, standard deviation.
Nature and Science of Sleep downloaded from https://www.dovepress.com/ by 118.70.13.36 on 24-Aug-2020
Dovepress
Cairns et al
Figure 1 Distribution of age for males and females being evaluated for obstructive sleep apnea by home sleep apnea testing.
Frequency (n)
1,000 2,000 3,000 4,000 5,000
0
10 20 30 40 50 60
Age (years)
70 80 90 100
1,000 2,000 3,000 4,000 5,000
0
10 20 30 40 50 60
Age (years)
70 80 90 100
Female Male
hours and mean valid recording time of 5.5±1.2 hours. Studies with more than one night of data collected were not excluded from analyses; rather, study information (AHI, recording duration, etc) was averaged over the number of study nights collected. Number of study nights (c2 [1, 272,695]=1.6, P=0.21) and study duration (Δ5 minutes; F [1, 272,703]=58.3, P<0.001; h2=0.00) were similar for males and females. Age, BMI, and ESS were remarkably similar for males and females (although statistically significantly different, measures of effect size were negligible). Females were less likely to report some of the “classic” symptoms of sleep apnea, namely, fre-quent snoring and witnessed apneas (Table 1). Females were more likely to report insomnia, depression, and use of sleep medication. In general, females had test results indicative of less severe OSA compared to males.
Sex differences in OSA prevalence
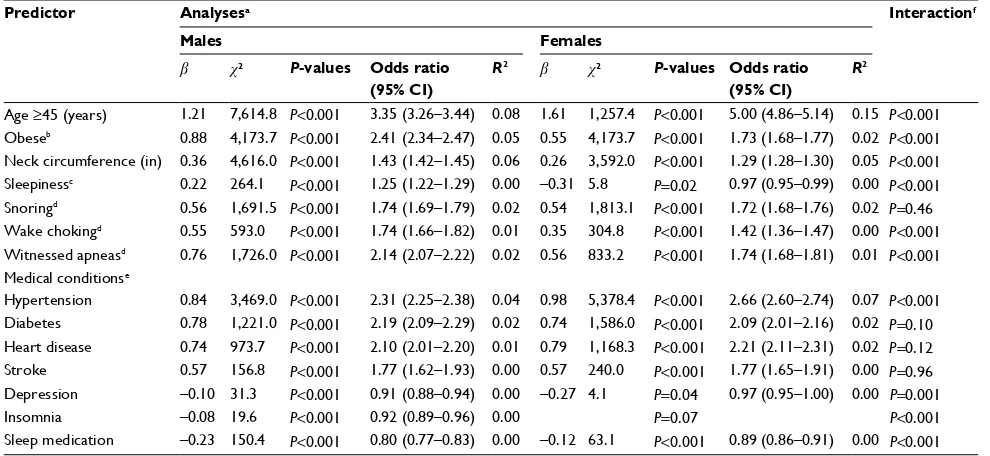
across age
Sex (unadjusted) accounted for 3.6% of the variance in OSA in that males were more likely to have test outcomes indica-tive of OSA than females, especially moderate-to-severe OSA (AHI ≥15). However, Figure 2 illustrates that the prevalence of OSA in females increases in a more precipitous fashion than males, especially after 45 years of age. In fact, females appear to “catch up” with their male counterparts in late middle age when using AHI ≥5 or respiratory disturbance index ≥15 as a diagnostic cutoff. When defined as an AHI
≥5, the prevalence of OSA in males and females was much more similar after 45 years (88.1% males vs 78.7% females)
compared to earlier in life (68.8% males vs 42.5% females). However, the prevalence of moderate-to-severe OSA (AHI
≥15) was always more pronounced in males (Figure 2).
Domain 1: age
Middle age (≥45) was the single most robust predictor of OSA in unadjusted (Table 2) and adjusted (Table 3) analyses for both sexes, accounting for over 10% of the variance in OSA (AHI ≥5). On average, individuals over 45 years of age had four times the odds of having an AHI ≥5, controlling for sex, BMI, neck circumference, and medical conditions. Middle age was particularly foretelling for females (Table 2), even after controlling for measures of adiposity (neck cir-cumference and BMI) and medical conditions (Table 3). The function was similar for moderate-to-severe OSA (AHI ≥15; females odds ratio: 4.72 vs males odds ratio: 3.03; interaction c2 [1, 272,705]=726.8, P<0.001).
Domain 2: adiposity
Obesity (BMI ≥30) and neck circumference performed better as predictors of OSA for males than females (Table 2), even after controlling for age and medical conditions (Table 3). On average, every inch increase in neck circumference was associated with a >20% increased risk for OSA, controlling for sex, age, BMI, and medical conditions.
Domain 3: symptoms of OSA
Frequent snoring was a robust predictor of OSA and performed equally for both sexes (Table 2), even after controlling for
Nature and Science of Sleep downloaded from https://www.dovepress.com/ by 118.70.13.36 on 24-Aug-2020
Dovepress Sex differences in OSA
Figure 2 Sex differences in HSAT outcomes across age.
Abbreviations: AHI, apnea hypopnea index; HSAT, home sleep apnea testing; RDI, respiratory disturbance index.
Prevalence of AHI>5
Age group (years)
18–22 23–27 28–32 33–37 38–42 43–47 48–52 53–58 59–63 >63
Prevalence (%)
10 20 30 40 50 60 70 80 90 100
Males Females
Age group (years)
18–22 23–27 28–32 33–37 38–42 43–47 48–52 53–58 59–63 >63
Prevalence (%)
0 10 20 30 40 50 60 70 80 90 100
Males Females
Prevalence of AHI>15
Age group (years)
18–22 23–27 28–32 33–37 38–42 43–47 48–52 53–58 59–63 >63
Prevalence (%)
0 10 20 30 40 50 60 70 80 90 100
Male Female
Prevalence of RDI>15
A B
C
Table 2 Unadjusted logistic regression analyses of predictors of OSA (AHI ≥5)
Predictor Analysesa Interactionf
Males Females
b c2 P-values Odds ratio
(95% CI)
R2 b c2 P-values Odds ratio
(95% CI)
R2
Age ≥45 (years) 1.21 7,614.8 P<0.001 3.35 (3.26–3.44) 0.08 1.61 1,257.4 P<0.001 5.00 (4.86–5.14) 0.15 P<0.001 Obeseb 0.88 4,173.7 P<0.001 2.41 (2.34–2.47) 0.05 0.55 4,173.7 P<0.001 1.73 (1.68–1.77) 0.02 P<0.001 Neck circumference (in) 0.36 4,616.0 P<0.001 1.43 (1.42–1.45) 0.06 0.26 3,592.0 P<0.001 1.29 (1.28–1.30) 0.05 P<0.001 Sleepinessc 0.22 264.1 P<0.001 1.25 (1.22–1.29) 0.00 –0.31 5.8 P=0.02 0.97 (0.95–0.99) 0.00 P<0.001 Snoringd 0.56 1,691.5 P<0.001 1.74 (1.69–1.79) 0.02 0.54 1,813.1 P<0.001 1.72 (1.68–1.76) 0.02 P=0.46 Wake chokingd 0.55 593.0 P<0.001 1.74 (1.66–1.82) 0.01 0.35 304.8 P<0.001 1.42 (1.36–1.47) 0.00 P<0.001 Witnessed apneasd 0.76 1,726.0 P<0.001 2.14 (2.07–2.22) 0.02 0.56 833.2 P<0.001 1.74 (1.68–1.81) 0.01 P<0.001 Medical conditionse
Hypertension 0.84 3,469.0 P<0.001 2.31 (2.25–2.38) 0.04 0.98 5,378.4 P<0.001 2.66 (2.60–2.74) 0.07 P<0.001 Diabetes 0.78 1,221.0 P<0.001 2.19 (2.09–2.29) 0.02 0.74 1,586.0 P<0.001 2.09 (2.01–2.16) 0.02 P=0.10 Heart disease 0.74 973.7 P<0.001 2.10 (2.01–2.20) 0.01 0.79 1,168.3 P<0.001 2.21 (2.11–2.31) 0.02 P=0.12 Stroke 0.57 156.8 P<0.001 1.77 (1.62–1.93) 0.00 0.57 240.0 P<0.001 1.77 (1.65–1.91) 0.00 P=0.96 Depression –0.10 31.3 P<0.001 0.91 (0.88–0.94) 0.00 –0.27 4.1 P=0.04 0.97 (0.95–1.00) 0.00 P=0.001
Insomnia –0.08 19.6 P<0.001 0.92 (0.89–0.96) 0.00 P=0.07 P<0.001
Sleep medication –0.23 150.4 P<0.001 0.80 (0.77–0.83) 0.00 –0.12 63.1 P<0.001 0.89 (0.86–0.91) 0.00 P<0.001
Notes: aAnalyses representunadjusted logistic regression of each predictor for each sex separately; bbody mass index ≥30 kg/m2; cEpworth Sleepiness Scale ≥10; d% answer “at least frequently (3–4 times per week)” to “on average in the past month, how often have you snored or been told that you snore […] do you wake up choking or gasping […] have you ever been told that you stop breathing in your sleep or wake up choking or gasping?”; e% endorsed yes to “have you been diagnosed or treated for any of the following conditions?”; finteraction = sex ×predictor.
Abbreviations: AHI, apnea hypopnea index; CI, confidence interval; OSA, obstructive sleep apnea.
Nature and Science of Sleep downloaded from https://www.dovepress.com/ by 118.70.13.36 on 24-Aug-2020
Dovepress
Cairns et al
age, measures of adiposity, and medical conditions (Table 3). Waking choking “at least frequently” was a fair predictor of OSA in the unadjusted model, especially for males (Table 2), but was no longer significant in the adjusted model (males P=0.15, females P=0.05). Witnessed apneas remained robust in the adjusted model but were better for males than females (Table 3). Sleepiness, although slightly better in predicting OSA for males than females, was not a reliable predictor of OSA as it accounted for negligible variance (Table 2; R2<0.01), and thus was not added to the adjusted model.
Domain 4: medical comorbidities
A history of hypertension performed better as a predictor of OSA for females than males (Table 2), even after controlling for age, measures of adiposity, and other medical conditions (Table 3). Diabetes and heart disease performed equally for both sexes (Table 2) but were attenuated in the adjusted model (Table 3). Stroke, although appearing to predict OSA in unadjusted models, accounted for negligible variance in OSA outcomes (Table 2; R2<0.01), and was thus not added to the adjusted model.
Insomnia, sleep medication, and depression
Neither insomnia nor depression predicted OSA for either sex. Interestingly, the use of sleep medication was associated with slightly less OSA risk, namely, for males, but effect sizes were negligible and thus not added to the adjusted model.
Discussion
To the best of our knowledge, this is the first study to evalu-ate sex differences in predictors of OSA in patients being
evaluated by at-home sleep testing. This study found that males and females report different symptoms upon clini-cal evaluation for suspected sleep apnea, with some of the classic OSA features, including anthropometric measures of adiposity and witnessed apneas, to be more common in and robustly predictive for males. Females indeed were more likely to report depression, insomnia, and use of sleep medication; however, these factors were not associated with HSAT outcomes. The finding that sex mediated the potency of OSA predictors highlights the need for sex-specific pre-diction models to maximize the sensitivity and specificity of pretest screening for OSA.
Male risk for OSA
Even in this high OSA risk sample, females were generally less likely to have test results indicative of OSA, especially moderate-to-severe OSA. On average, males in this sample were ~1.6–2 times more likely to have test results indicative of OSA compared to females. Male risk for OSA is likely at least partially attributable to other risk factors not assessed in this study, including craniofacial/airway structure and function. For example, data have suggested that females gen-erally have “more favorable” airway mechanics than males as evidenced by the fact that females consistently have less severe OSA despite smaller pharyngeal airways.18,19 However, an interesting finding was that OSA that was at least mild in nature (AHI ≥5) became much more prevalent in females and was remarkably similar to males later in life, corroborating what has been observed in community samples.4 This, in conjunction with the finding that age was a particularly robust predictor for OSA in females, even when holding measures of
Table 3 Adjusted logistic regression analyses of predictors of OSA (AHI ≥5)
Predictor Analyses Interactionf
Malesa Femalesb
b c2 P-values Odds ratio (95% CI) b c2 P-values Odds ratio (95% CI)
Age ≥45 (years) 1.28 6,382.6 P<0.001 3.58 (3.47–3.69) 1.62 9,941.3 P<0.001 5.06 (4.90–5.22) P<0.001 Obese 0.52 901.2 P<0.001 1.69 (1.63–1.75) 0.27 250.6 P<0.001 1.31 (1.27–1.35) P<0.001 Neck circumference (in) 0.22 1,156.1 P<0.001 1.24 (1.23–1.26) 0.20 1,395.6 P<0.001 1.22 (1.21–1.24) P=0.30 Snoring 0.53 1,116.8 P<0.001 1.69 (1.64–1.75) 0.51 1,162.5 P<0.001 1.67 (1.62–1.72) P=0.37 Witnessed apneas 0.59 669.4 P<0.001 1.81 (1.73–1.89) 0.40 253.2 P<0.001 1.49 (1.42–1.56) P<0.001 Hypertension 0.31 357.0 P<0.001 1.37 (1.32–1.41) 0.42 697.5 P<0.001 1.52 (1.47–1.57) P<0.001 Diabetes 0.11 20.9 P<0.001 1.12 (1.07–1.18) 0.09 17.7 P<0.001 1.09 (1.05–1.14) P=0.44 Heart disease 0.29 121.8 P<0.001 1.34 (1.27–1.41) 0.24 84.3 P<0.001 1.27 (1.20–1.33) P=0.07
Notes: aMales – overall model was significant (c2 [9, 149,071]=17,292.8, P<0.001) and accounted for 18.1% of the variance in OSA (AHI ≥5); bFemales – overall model was
significant (c2 [9, 1,12,794]=20,628.4, P<0.001) and accounted for 23.6% of the variance in OSA (AHI ≥5). Waking choking was not statistically significant (males P=0.15;
females P=0.05). fInteraction =sex × predictor. For obese: body mass index ≥30 kg/m2. For snoring and witnessed apneas: % answer “at least frequently [3–4 times per week]” to “on average in the past month, how often have you snore or been told that you snore […] have you ever been told that you stop breathing in your sleep or wake up choking or gasping?”. For hypertension, diabetes, and heart disease: % endorsed yes to “have you been diagnosed or treated for any of the following conditions?”.
Abbreviations: AHI, apnea hypopnea index; CI, confidence interval; OSA, obstructive sleep apnea.
Nature and Science of Sleep downloaded from https://www.dovepress.com/ by 118.70.13.36 on 24-Aug-2020
Dovepress Sex differences in OSA
adiposity constant, highlights the potential role of age-related changes in hormones in airway patency.12
Self-reported symptoms
Similar to previous reports,8,9 some of the classic high pretest symptoms of OSA, including snoring and witnessed apneas, were less commonly reported as presenting symptoms of OSA in females. Although it is not entirely clear why this is, several possibilities exist. It is possible that females are simply less likely to have these symptoms or that these symptoms require a “severe” OSA phenotype. It is also possible that menopausal status mediates the manifestation of these symptoms in females. For example, reductions in estrogen and progesterone during the menopausal period may allow for OSA (and thus symp-toms) to manifest via changes in upper airway dilator activity,12 especially in the presence of other risk factors found to predict female OSA, such as increased adiposity. Also, females may simply be better reporters for their male counterparts’ symp-toms as opposed to vice versa. Lastly, it is also a possibility that females underreport snoring and witnessed apneas because of embarrassment or social norms (ie, not “lady-like”).7
The finding that females in this sample were more likely to report “atypical OSA symptoms”, such as a diagnosis of insomnia, depression, and use of sleep medication, was similar to other studies.6,8,9 However, because these factors were not particularly helpful in determining female risk of OSA, this finding suggests a higher base rate of these com-plaints in females. It does, however, highlight that females with OSA may be at an increased risk of more complicated sleep management, as they may require comanagement by mental health care providers and sleep medicine specialists. It is important to note that we did not assess other “atypical OSA symptoms” found to be more commonly reported in females, including fatigue, tiredness, or lack of energy.19
Risk factors stronger for male OSA
Not only were males more likely to report some of the clas-sic features of sleep apnea, but these factors were also better predictors of OSA in males than females. Obesity, as per cutoffs derived from BMI, is likely a better predictor of OSA for males as they are more likely to have visceral as opposed to peripheral (as in females) adiposity.20 Visceral adiposity directly influences OSA risk via excess fat deposition in the parapharyngeal space and/or increased work of breathing.21 If males are more likely to have this upper airway phenotype, then it holds true that choking, which is a direct manifestation of reduced pharyngeal space, would be a better indicator for males. Neck circumference as an anthropometric measure
faired more similarly for males and females and is intuitive as it is a more direct measure of pharyngeal restriction than overall body habitus.21
Risk factors stronger for female OSA
In this study, advancing age was the single strongest predictor of OSA for both sexes. Age is a well-known risk factor associated with changes in upper airway tone, pharyngeal fat distribution, and the development of comorbid diseases.4 The finding that advancing age uniquely and robustly predicted OSA in females reinforces our understanding that age-related changes in sex hormones, including estradiol, follicle stimulating hormone, progesterone, and testosterone, play a role in the development and/or manifestation of sleep disordered breathing.11 Most importantly, this highlights the need for quantifying menopausal status in OSA screening tools – something “not” typically assessed. The finding that hypertension was a stronger predictor of female OSA could indicate a longer exposure to abnormal breathing, and thus more advanced disease, or that clinicians were simply more likely to refer female patients if hypertension was present. These data warrant further investigation.
Sex-neutral OSA predictors
Despite males being more likely to report frequent snoring, it was the most robust and sex-neutral self-reported symptom of OSA. These findings support other data22 and are encour-aging as snoring is a salient factor that many clinicians and standardized measures query.23,24 With regard to medical conditions, diabetes was equally predictive for both sexes. The link between OSA and diabetes has been well established both under controlled laboratory and naturalistic conditions and is thought to be attributable to maladaptive response of repetitive sleep fragmentation/restriction and long-term exposure to intermittent hypoxemia on glucose metabolism.25
Factors not associated with OSA
Sleepiness, as assessed by the ESS, was a weak predictor of OSA, especially for females. This has been reported by multiple studies previously26,27 and highlights the importance of avoiding sleepiness as the “sole” indicator of sleep apnea.28 These findings have important policy implications as many payors and care utilization companies rely on sleepiness as per the ESS to warrant sleep testing.29 Our data suggested that a history of stroke resulted in a 77% increase in odds ratios of sleep disordered breathing, but the variance accounted for was small (<0.001%). This suggests that risk for OSA in this sample was due to other factors that may coexist with a history of stroke, such as obesity and heart disease.
Nature and Science of Sleep downloaded from https://www.dovepress.com/ by 118.70.13.36 on 24-Aug-2020
Dovepress
Cairns et al
Conclusions drawn from this study must be made with the study’s limitations in mind. The most pronounced limitation was in regard to the nature of the sample. The sample was not a random sample and consisted of patients who were deemed at risk for sleep apnea, namely, those who were able to suc-cessfully complete an at-home sleep test. Thus, prediction models may have been driven by factors outside of what we directly measured in this study, including the clinician’s sense of the patient’s pretest risk for OSA. Also, all questionnaire data were self-reported in nature and may not align with practitioner assessment. It is important to note that there were likely patients who were deemed to have an abnormal AHI as per the HSAT, but were actually normal (specificity 0.76). Another limitation was that we were not able to evalu-ate race/ethnicity as a predictor of OSA. Recent data have suggested that certain racial groups, especially Asians, are at a particularly high risk for OSA,30 even in the absence of obesity.31 Despite these limitations, the study had a number of strengths, including a very large sample size with estimates of effect size, adequate representation of both sexes, and a variety of factors for which to evaluate OSA risk.
Acknowledgment
This study was funded by SleepMed, Inc.
Disclosure
Doctor Cairns, Doctor Bogan, and Greg Poulos are employed by SleepMed, Inc. The authors report no other conflicts of interest in this work.
References
1. Harvard Medical School. The Price of Fatigue: The Surprising
Eco-nomic Costs of Unmanaged Sleep Apnea. Boston, MA: Harvard Medical
School; 2010.
2. Collop NA, Anderson WM, Boehlecke B, et al. Clinical guidelines for the use of unattended portable monitors in the diagnosis of obstructive sleep apnea in adult patients. J Clin Sleep Med. 2007;3(7):737–747. 3. Collop N. Home sleep testing: appropriate screening is the key. Sleep.
2012;35(11):1445–1446.
4. Young T, Skatrud J, Peppard PE. Risk factors for obstructive sleep apnea in adults. JAMA. 2004;291(16):2013–2016.
5. Young T, Palta M, Dempsey J, Skatrud J, Weber S, Badr S. The occur-rence of sleep-disordered breathing among middle-aged adults. N Engl
J Med. 1993;328(17):1230–1235.
6. Quintana-Gallego E, Carmona-Bernala C, Capotea F, et al. Gender differences in obstructive sleep apnea syndrome: a clinical study of 1166 patients. Respir Med. 2004;98(10):984–989.
7. Lin CM, Davidson TM, Ancoli-Israel S. Gender differences in obstructive sleep apnea and treatment implications. Sleep Med Rev. 2008;12(6):481–496.
8. Shepertycky MR, Banno K, Kryger MH. Differences between men and women in the clinical presentation of patients diagnosed with obstructive sleep apnea syndrome. Sleep. 2005;28(3):309–314.
9. Valipour A, Lothaller H, Rauscher H, Zwick H, Burghuber OC, Lavie P. Gender-related differences in symptoms of patients with suspected breathing disorders in sleep: a clinical population study using the sleep disorders questionnaire. Sleep. 2007;30(3):312–319.
10. Young T, Finn L, Austin D, Peterson A. Menopausal status and sleep-disordered breathing in the Wisconsin sleep cohort study. Am J Respir
Crit Care Med. 2003;167(9):1181–1185.
11. Joffe H, Massler A, Sharkey K. Evaluation and management of sleep disturbance during the menopause transition. Semin Reprod Med. 2010;28(5):404–421.
12. Popovic RM, White DP. Upper airway muscle activity in normal women: influence of hormonal status. J Appl Physiol. 1998;84(3):1055–1062. 13. Popovic D, Velimirovic V, Ayappa I, et al. Sleep/wake classification
using head actigraphy, snoring and airflow signals [abstract]. Sleep. 2008;32:379.
14. Ayappa N, Norman RG, Seelall V, Rapoport D. Validation of a self-applied unattended monitor for sleep disordered breathing. J Clin Sleep
Med. 2008;4(1):26–37.
15. Levondowski D, Olmstead R, Popovic D, Carper D, Berka C, Westbrook PR. Assessment of obstructive sleep apnea risk and severity in truck drivers: validation of a screening questionnaire. Sleep Diagnosis Ther. 2007;2(2):20–26.
16. Johns, M. A new method for measuring sleepiness: the Epworth sleepi-ness scale. Sleep. 1991;14(6):540–545.
17. Morgan S, Reichert R, Harrison T. From Numbers to Words: Reporting
Statistical Results for the Social Sciences. Boston, MA: Allyn & Bacon;
2001.
18. Mohsenin V. Gender differences in the expression of sleep-disordered breathing. Chest. 2001;120:1442–1447.
19. Chervin RD. Sleepiness, fatigue, tiredness, and lack of energy in obstructive sleep apnea. Chest. 2000;118(2):372–379.
20. Taylor RW, Grant AM, Williams SM, Goulding A. Gender differences in regional body fat distribution from pre- to post puberty. Obesity. 2010;18(7):1410–1416.
21. Redline S. Genetics of obstructive sleep apnea. In: Kryger M, Roth T, Dement W, editors. Principles and Practices of Sleep Medicine. 5th edition. Missouri: Elsevier; 2011:1183–1193.
22. Young, T, Hutton R, Finn L, Badr S, Palta M. The gender bias in sleep apnea diagnosis: are women missed because they have different symp-toms? Arch Intern Med. 1996;156(21):2445–2451.
23. Chung F, Yegneswaran B, Liao P, et al. A tool to screen patients for obstructive sleep apnea. Anesthesiology. 2008;108:812–821. 24. Netzer, NC, Stoohs RA, Netzer CM, Clark K, Strohl KP. Using the
Berlin Questionnaire to identify patients at risk for the sleep apnea syndrome. Ann Intern Med. 1999;31(7):485–491.
25. Tasali E, Mokhlesi B, Van Cauter E. Obstructive sleep apnea and type 2 diabetes: interacting epidemics. Chest. 2008;133(2):496–506. 26. Sil A, Barr, G. Assessment of predictive ability of Epworth
scor-ing in screenscor-ing of patients with sleep apnoea. J Laryngol Otol. 2012;126(4):372–379.
27. Chervin RD, Aldrich MS. The Epworth Sleepiness Scale may not reflect objective measures of sleepiness or sleep apnea. Neurology. 1999;52(1):125–131.
28. Bixler EO, Vgontzas AN, Lin HM, Calhoun SL, Vela-Bueno A, Kales A. Excessive daytime sleepiness in a general population sample: the role of sleep apnea, age, obesity, diabetes, and depression. J Clin Endocrinol
Metab. 2005;90(8):4510–4515.
29. Quan SF. Abuse of the Epworth sleepiness scale. J Clin Sleep Med. 2013;9(10):987.
30. Leong WB, Arora T, Jenkinson D, et al. The prevalence and severity of obstructive sleep apnea in severe obesity: the impact of ethnicity. J
Clin Sleep Med. 2013;9(9):853–858.
31. Chen X, Wang R, Zee P, et al. Racial/ethnic differences in sleep dis-turbances: the multi-ethnic study of atherosclerosis (MESA). Sleep. 2015;38(6):877–888.
Nature and Science of Sleep downloaded from https://www.dovepress.com/ by 118.70.13.36 on 24-Aug-2020
Dovepress
Nature and Science of Sleep
Publish your work in this journal
Submit your manuscript here: https://www.dovepress.com/nature-and-science-of-sleep-journal
Nature and Science of Sleep is an international, peer-reviewed, open access journal covering all aspects of sleep science and sleep medicine, including the neurophysiology and functions of sleep, the genetics of sleep, sleep and society, biological rhythms, dreaming, sleep disorders and therapy, and strategies to optimize healthy sleep. The manuscript
management system is completely online and includes a very quick and fair peer-review system, which is all easy to use. Visit http://www. dovepress.com/testimonials.php to read real quotes from published authors.
Dove
press
Sex differences in OSA
Nature and Science of Sleep downloaded from https://www.dovepress.com/ by 118.70.13.36 on 24-Aug-2020