THE USE OF ULTRA SCALE-DOWN
FOR THE FAST PROCESS
CHARACTERISATION OF
PLASMID DNA PROCESSES FOR
GENE THERAPY
A Thesis submitted for the degree of
Doctor of Philosophy
by
Andrew Francis Day BSc (Hons)
Advanced Centre for Biochemical Engineering
Department of Biochemical Engineering University
ProQuest Number: 10016125
All rights reserved
INFORMATION TO ALL USERS
The quality of this reproduction is dependent upon the quality of the copy submitted. In the unlikely event that the author did not send a complete manuscript and there are missing pages, these will be noted. Also, if material had to be removed,
a note will indicate the deletion.
uest.
ProQuest 10016125
Published by ProQuest LLC(2016). Copyright of the Dissertation is held by the Author. All rights reserved.
This work is protected against unauthorized copying under Title 17, United States Code. Microform Edition © ProQuest LLC.
ProQuest LLC
789 East Eisenhower Parkway P.O. Box 1346
“The mountains melted from before the lord...”
Acknowledgements
A big thank you to Prof. Nigel Titchener-Hooker for all the help, advice and direction he has provided over the course of the PhD, and for knowing when to apply just the right amount of pressure. My thanks to Dr Tim Clayton for his help with theory and practical work and for making space and time for me at Beckenham. It was much appreciated.
I am grateful to all my colleagues at UCL and GSK for help, support and the occasional beer. Thanks go to all my friends, some of whom had to listen to me whinge on a Friday night about strange bacteria and DNA for several years. Cheers.
Andrew F. Day Abstract
Abstract
In the production of plasmid DNA for gene therapy the product is separated from chromosomal DNA by an alkaline lysis operation. During this key step a typical rheological profile with respect to time is developed and this has previously been examined using a viscometer as an ultra scale down reactor.
The aim was to elucidate changes in rheological behaviour and plasmid DNA yield of E.coli alkaline lysates as a function of fermentation time. This data was used to determine operational windows for fermentation harvesting.
A comparative study of two rheometers showed that the optimum shear rate for the viscosity vs. time profile was 180 s '\ Any rheometer used must achieve this shear rate without breaching the torque limit.
Investigations into E.coli cell resistance to physical breakage showed that cells had the least resistance (disruption rate constant (K) 0.9) during exponential growth phase, compared to early exponential and stationary phase values of 0.6 and 0.4 respectively. However, the same effect was not seen for chemical cell lysis, where total cell lysis due to alkaline lysis was maintained at 40 s throughout batch and fed-batch fermentation.
The viscosity vs. time profile for E.coli DH1 was seen to change as a function of fermentation time. During exponential growth phase the secondary peak appeared later every hour (from 120 s to 180 s), and the apparent viscosity was higher. This change was due to an increase in chromosomal DNA during exponential growth.
Plasmid DNA yield was seen to peak at stationary growth (69 mg/kg). During early exponential and exponential growth phases the plasmid DNA yield was seen to increase with increasing neutralisation time, except for stationary phase where plasmid yield dropped after 100 s. The reasons for this are undetermined. Yield did not change as a function of fed-batch fermentation time.
Andrew F. Day Contents
Table of Contents
Title Page... I
Acknowledgements... iv
Abstract...v
Table of C ontents...vi
List of Figures... xvii
List of T ab le s... xxii
1. Introduction and Theory... 1
1.1. Introduction... 1
1.2. Gene Therapy...2
1.2.1. The Theory Behind Gene Therapy... 2
1.2.2. Vectors Used in Gene Therapy... 3
1.2.3. Production of Vectors for Gene Therapy... 4
1.2.3.1. Fermentation...6
1.2.3.2. Cell Harvest... 7
1.2.3.3. Purification... 7
1.2.3.4. Finishing... 9
1.2.4. Plasmid DNA Purity...9
1.2.5. Process Problems... 11
1.2.5.1. Fermentation... 11
1.2.5.2. Downstream Processing... 12
1.3. Alkaline Lysis... 13
1.3.1. Cell Lysis... 14
Andrew F. Day Contents
1.4. Rheology... 15
1.4.1. Introduction to Rheology...15
1.4.2. Viscosity... 17
1.4.2.1. Measuring Viscosity... 19
1.4.3. Elasticity...20
1.4.4. Viscoelastic Fluids...20
1.4.4.1. Impact of Viscoelastic Behaviour...22
1.4.4.2. Normal Stresses and Their Impact on Fluid Behaviour.... 23
1.4.5. Non-Newtonian Fluids... 24
1.4.5.1. Apparent Viscosity... 24
1.4.5.2. Shear-Thinning (Pseudo-Plastic)...24
1.4.5.3. Shear-Thickening (Dilatant)... 25
1.4.6. Measuring Viscoelasticity... 25
1.4.6.1. The Storage and Loss M odulus...26
1.4.7. Rheology in Industry...27
1.4.8. Factors Affecting Rheology... 28
1.4.8.1. The Effect of Time on Non-Newtonian F luids... 28
1.4.8.2. The Effect of Temperature on Non-Newtonian Fluids 28 1.5. Summary of Previous W ork... 30
1.5.1. Rheological Properties of Alkaline Lysates... 30
1.5.2. Classic Alkaline Lysis Viscosity vs. Time P rofile... 31
1.5.2.1. Primary Peak... 32
1.5.2.2. Secondary Peak...33
1.5.2.3. Pseudo-Steady S tate... 33
Andrew F. Day Contents
2. Materials and Methods...35
2.1. introduction...35
2.2. Cell Strains and Plasmids...35
2.2.1. E.C0//DH5a... 35
2.2.2. E.coli ...36
2.2.3. Strain Maintenance...36
2.3. Fermentation...37
2.3.1. Growth Medium and Inoculum Preparation... 37
2.3.1.1. Preparation of Inoculum for 20 L LH Fermenters... 37
2.3.1.2. Preparation of Inoculum for SGI and Applikon Fermenters 37 2.3.1.3. Preparation of Inoculum for Fed-batch Fermenters...38
2.3.2. Fermentation Protocol... 38
2.3.2.1. Shake-flask Fermentation...38
2.3.2.2. Batch Fermentation 1 ... 39
2.3.2.3. Batch Fermentation 2 ...40
2.3.2.4. Fed-batch Fermentation...41
2.3.3. Fermenter Sampling... 42
2.3.3.1. Sampling 20 L LH Fermenter... 42
2.3.3.2. Sampling Batch and Fed-batch Applikon/SGI Fermenters43 2.3.4. Fermenter Harvest...44
2.4. Alkaline lysis Using Scale-Down Co-axial Rheometer... 44
2.4.1. Alkaline Lysis Protocol 1: Lysis Step Only... 45
2.4.2. Alkaline Lysis Protocol2:Lysis Step Followed By Neutralisation 45 2.4.3. Reproducibility of Bohlin... 45
2.4.4. Rheological Analysis Using Scale-Down Reactor... 45
Andrew F. Day Contents
2AA.2. Strain Sweep...46
2.4.4.3. Shear Stress vs. Shear Rate...46
2.5. Determining Physical Cell Strength Using An Industrial High Pressure Homogeniser... 47
2.5.1. Micron Lab 40... 47
2.5.2. Emulsiflex C5... 48
2.6. Analytical Techniques...49
2.6.1. Measuring Optical Density...49
2.6.2. Determination of Protein Concentration (Coomassie Assay) ..49
2.6.3. Cell Counting... 50
2.6.4. Determination of Plasmid DNA (Agarose Gel Electrophoresis)51 2.6.4.1. Treatment of Alkaline Lysates... 51
2.6.4.2. Preparation, Loading and Running G el... 52
2.6.4.3. Staining and Photographing G e l...53
2.6.4.4. Analysis of Gel Bands... 53
3. The Use of and Reproducibility of Shake-flask, Batch and Fed-batch Fermentations for Plasmid DNA Production... 57
3.1. Summary... 57
3.2. Introduction... 57
3.2.1. A im s ... 58
3.2.2. Scale-up and Scale-down... 58
3.2.3. Shake-flask Fermentations...58
3.2.4. Batch Fermentations... 59
3.2.5. Fed-batch Fermentations... 59
3.3. Materials and Methods...60
Andrew F. Day Contents
3.3.2. Batch Fermentation...60
3.3.3. Fed-batch Fermentation... 60
3.4. Results... 61
3.4.1. Shake-flask Fermentations... 61
3.4.2. Batch Fermentations... 62
3.4.2.1. E.coli DH5a /pQR235 Growth in 20 L LH Fermenter 62 3.4.2.2. E.coli DH1 /pXY Grown in 3 L Applikon...63
3.4.2.3. E.coli DH1 /pXY Grown in 7 L Applikon...63
3.4.2.4. E.coli DH1 Parental Strain Grown in 7 L Applikon....63
3.4.2.5. E.coli DH1 /pXY Grown in 10 L S G I... 64
3.4.2.6. E.coli DH5a /pXX Grown in 10 L S G I... 64
3.4.3. Fed-batch Fermentations... 64
3.4.4. Maximum Specific Growth R ates... 65
3.4.4.1. Shake-flask Fermentations... 65
3.4.4.2. Batch Fermentations... 66
3.4.4.3. Fed-batch Fermentation...67
3.5. Discussion...67
3.5.1. Shake-flask Fermentations...67
3.5.2. Batch Fermentations... 69
3.5.2.1. Fermenter Configuration...69
3.5.2.2. Cell Strain... 70
3.5.2.3. Growth Curve...70
3.5.3. Fed-batch Fermentations... 71
Andrew F. Day Contents
4. Establishing a Suitable Rheometer as a Scale-Down M im ic... 84
4.1. Summary... 84
4.2. Introduction... 84
4.2.1. A im s ... 84
4.2.2. The Characteristic Viscosity vs. Time Profile... 85
4.2.3. The Comparative Scale-down Reactors...85
4.3. Materials and Methods...86
4.3.1. Bohlin Rheometer... 86
4.3.2. Brookfield Viscometer... 87
4.4. Results... 88
4.4.1. Reproducing the Classic Profile Using the Brookfield Viscometer 88 4.4.2. Effect of Fermenter Sample T im e ... 90
4.5. Discussion... 91
4.5.1. Limitations of the Brookfield Viscom eter... 91
4.5.2. Choice of Scale-Down Reactor...93
4.6. Conclusion... 94
5. Escherichia coli Resistance to Breakage by Physical and Chemical Methods as a Function of Fermentation T im e ...99
5.1. Summary... 99
5.2. Introduction... 99
5.2.1. A im s ... 99
5.2.2. Cell Culture Growth and Associated Metabolic L o a d ... 100
5.2.2.1. Cell Culture Growth...100
5.2.2.2. Metabolic Load... 100
Andrew F. Day Contents
5.2.4. Chemical Cell Strength Measurements... 102
5.3. Materials and Methods... 103
5.3.1. Physical Cell Strength...103
5.3.1.1. Physical Cell Strength of E.coli DH5a /pQR235.103 5.3.1.2. Physical Cell Strength of E.coli DH1 /pXY... 104
5.3.2. Chemical Cell Strength...104
5.4. Results...104
5.5. Discussion... 107
5.5.1. Physical Cell Strength...107
5.5.2. Chemical Cell Strength... 109
5.6. Conclusion... 110
6. Correlating the Changes in the Rheological Behaviour of Escherichia coli Alkaline Lysates During Cell G row th... 117
6.1. Summ ary... 117
6.2. Introduction... 117
6.2.1. A im s ... 118
6.2.2. Alkaline Lysis...118
6.3. Materials and Methods... 119
6.3.1. Fermentation and Cell Strains...119
6.3.2. Alkaline Lysis and Scale-Down Reactor... 119
6.4. Results...120
6.4.1. The Impact of Freezing Cell Paste on the Viscosity vs. Time Profiles... 120
6.4.2. Effects of Shake-flask Fermentation Time on Viscosity vs. Time Profile for E.coli DH1 /pXY Grown on CIM M edia...120
Andrew F. Day Contents
6.4.4. Viscosity vs. Time Profile as a Function of Batch Fermentation
Growth Phase for E.coli DH5a /pXX...122
6.4.5. Viscosity vs. Time Profile for E.coli DH1 /pXY Grown Using Fed- batch Protocol... 124
6.5. Discussion... 125
6.5.1. Viscosity vs. Time Profiles for Different Growth Phases of E.coli DH1 /pXY Grown on CIM Media in 0.2 v/v Shake-flask 125 6.5.2. Viscosity vs. Time Profile Changes for E.coli DH1 /pXY as a Function of Batch fermentation Growth P hase...126
6.5.3. Effect of Strain on Viscosity vs. Time Profiles...128
6.5.4. Viscosity vs. Time Profiles for the Alkaline Lysis of E.coli DH1 /pXY Samples Grown Using Fed-batch Protocol 128 6.5.5. Apparent Viscosity...129
6.6. Conclusions... 130
7. Investigating the Causes of the Observed Changes in Rheological Behaviour of E co//Alkaline Lysates during Batch Cell Growth... 136
7.1. Summ ary... 136
7.2. Introduction... 136
7.2.1. A im s ... 136
7.2.2. Changes in Viscosity vs. Time Profile for Alkaline Lysates as a Function of Cell Culture Growth Phase...137
7.2.3. Selected “Factors” ... 137
7.3. Materials and Methods... 138
7.3.1. Strain and Plasmid Vector... 138
7.3.2. Fermentation...138
7.3.3. Alkaline Lysis...138
Andrew F. Day Contents
7.3.4. Treatment of Cells to Remove Chosen Factor... 139
7.3.4.1. Removal of R N A ... 139
7.3.4.2. Removal of Chromosomal D N A...140
7.3.4.3. Removal of Intracellular Proteins...140
7.3.5. Agarose Gel Electrophoresis... 140
7.4. Results...141
7.5. Discussion... 144
7.6. Conclusions... 149
8. Changes in Plasmid Quantity and Quality as a Function of Fermentation Age and Neutralisation T im e ...161
8.1. Summary... 161
8.2. Introduction... 161
8.2.1. A im s ... 162
8.2.2. Plasmid Yield...162
8.2.3. Quality Criteria... 162
8.3. Materials and Methods... 163
8.3.1. Fermentation and Sampling... 163
8.3.2. Alkaline Lysis... 163
8.3.3. Agarose Gel Electrophoresis... 164
8.3.4. RNA Removal... 164
8.4. Results...164
8.4.1. Analysis of Plasmid DNA Samples... 164
8.4.2. Plasmid Yield... 165
8.4.3. Plasmid Quality... 166
Andrew F. Day Contents
8.5.1. Plasmid Yield... 169
8.5.2. Plasmid Quality... 171
8.5.3. Correlation Between Viscosity vs. Time Profile and Absolute Mass of Plasmid DNA Present... 174
8.5.4. Window of Operation for Fermenter Harvest Time and the Time of Neutralisation for Alkaline Lysis Reaction, as Determined by Plasmid Quality and Quantity...175
8.5.4.1. Batch Fermentation... 175
8.5.4.2. Fed-Batch Fermentation... 175
8.6. Conclusion...176
9. Quantitative Study of the Rheology of E. co//Alkaline Lysates...184
9.1. Summary...184
9.2. Introduction...184
9.2.1. A im s ...185
9.3. Materials and M ethods...185
9.3.1. Fermentation and Source of Experimental Samples...185
9.3.2. Alkaline Lysis and Neutralisation S te p ...185
9.3.3. Rheological Techniques...186
9.3.3.1. Shear Stress vs. Shear Rate...186
9.3.3.2. Shear Sweeps...186
9.4. Results...187
9.4.1. Shear Stress vs. Shear Rate Analysis...187
9.4.2. Shear Sweep Analysis...188
9.4.2.1. Untreated Cell Suspension...189
9.4.2.2. Lysed Samples...190
Andrew F. Day Contents
9.4.3. Oscillatory Strain Sweep Analysis...190
9.4.3.1. Untreated Cell Suspension...190
9.4.3.2. Lysed Samples...191
9.4.3.3. Neutralised Samples... 191
9.5. Discussion... 192
9.5.1. Rheology of Untreated Cell Suspension... 192
9.5.2. Rheology of Alkaline Lysates... 192
9.5.3. Rheology of Neutralised Alkaline Lysates... 193
9.5.4. Significance of Rheological Results on Industrial Process 194 9.6. Conclusion... 195
10. Overall Conclusions... 200
10.1. Introduction...200
10.2. Conclusions...200
10.2.1. Summary of Conclusions... 200
10.2.2. Characterisation of Alkaline Lysis Process... 202
10.2.3. Operational Window for Cell Harvest...203
10.3. Industrial Ramifications of PhD...205
11. Further Studies...207
Appendix A ...209
Appendix B...211
Appendix C (Glossary)...213
Appendix D (Nomenclature)... 214
Andrew F. Day List of Figures
List of Figures
Figure 1.1 General process flow diagram for the industrial 8
purification of plasmid DNA
Figure 1.2 A map of plasmid pQR235 11
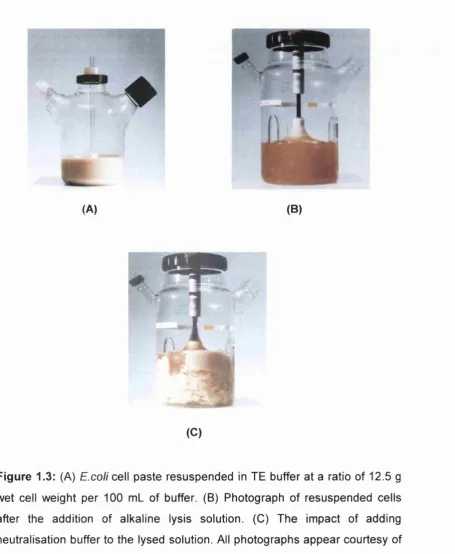
Figure 1.3 Photographs of alkaline lysis of E.coli cell paste 16
Figure 1.4 Sketch of viscosity forces acting on fluid 19
Figure 1.5 Logarithmic shear stress plots for Newtonian and 21
non-Newtonian fluids
Figure 1.6 The result of the application of shear stress to block 23
of Hookean solid
Figure 1.7 An example of the Weissenberg effect 24
Figure 1.8 Application of shear stress and resultant shear 29
strain response of a viscoelastic fluid undergoing oscillatory rheometric analysis
Figure 1.9 Example of a viscosity vs. time profile for E.coli 32
DH5a cells undergoing alkaline lysis
Figure 2.1 Cross section of Bohlin Rheometer 54
Figure 2.2 Detail of co-axial cylinder geometry 55
Figure 2.3 Cross section of Micron Lab 40 homogeniser 56
Figure 3.1 Classic natural log growth curve 73
Figure 3.2 Growth curve for E.coli DH1 /pXY grown on CIM 74
media in 0.2 working volume/total volume ratio shake-flask
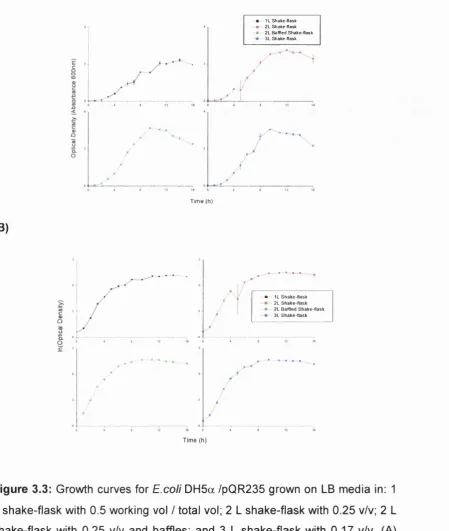
Figure 3.3 Growth curves for E.coli DH5a /pQR235 grown on 75
LB media in various shake-flasks
Figure 3.4 Growth curve for E.coli DH5a /pQR235 grown on 76
Andrew F. Day List of Figures
Figure 3.5 Growth curve for E.coli DH1 /pXY grown on CFM 77
media in a 3 L Applikon fermenter
Figure 3.6 Growth curve for E.coli DH1 /pXY grown on CFM 78
media in a 7 L Applikon fermenter
Figure 3.7 Growth curve for E.coli DH1 parental strain grown 79
on CFM media in a 7 L Applikon fermenter
Figure 3.8 Growth curve for E.coli DH1 /pXY grown on CFM 80
media in a 10 L SGI fermenter
Figure 3.9 Growth curve for E.coli DH5a /pXX grown on CFM 81
media in a 10 L SGI fermenter
Figure 3.10 Growth curve for E.coli DH1 /pXY grown on FBM 82
media in a 7 L Applikon fed-batch fermenter
Figure 3.11 Relationship between measured optical density, 83
dissolved oxygen tension (DOT) and impeller speed
Figure 4.1 Schematic of the Brookfield viscometer 95
Figure 4.2 Apparent viscosity vs. time profile for the alkaline 96
lysis of E.coli DH1 /pXY cell paste grown on CFM media in a 7 L Applikon batch fermenter
Figure 4.3 Apparent viscosity vs. time profile for the alkaline 97
lysis of E.coli DH1 /pXY. Cell paste sampled at 6 h. Three different shear rates: 31 s '\ 49 s '\ 183 s'^
Figure 4.4 Apparent viscosity vs. time profile for the alkaline 98
lysis of E.coli DH1 /pXY. Cell paste sampled at: (A) 1 h, (B) 6 h, (C) 10 h. Constant shear rate 31 s'^
Figure 5.1 Coomassie assay calibration curve of optical 111
density (A595nm) vs. protein concentration (mg/ml)
Figure 5.2 Maximum protein release over batch fermentations. 112
Andrew F. Day List of Figures
Figure 5.3 Protein release at 300 bar as fraction of total protein 113
released at 1200 bar per pass through homogeniser. E.coli DH5 /pQR235 20 L ferm on LB
Figure 5.4 Protein release at 300 bar as fraction of total protein 114
released at 1200 bar per homogeniser pass. E.coli
DH5 /pQR235 20 L ferm on CFM
Figure 5.5 Protein release 300bar/protein released 1200bar 115
per homogeniser pass. E.co//DH1/pXY 7 L on CFM
Figure 5.6 Cell lysis time (E.coli DHI/pXY) as function of time 116
of neutralisation and fermentation time
Figure 6.1 Viscosity profile for alkaline lysis of un-frozen DH1 131
/pXY (A) after 1 h fermentation, (B) 6 h, (C) 10 h
Figure 6.2 Viscosity profile for alkaline lysis of frozen DH1 132
/pXY (A) after 1 h fermentation, (B) 5 h, (C) 9 h
Figure 6.3 Viscosity profile for alkaline lysis of frozen DH1 133
/pXY (A) after 2 h fermentation, (B) 4 h, (C) 8 h, grown in shake-flask
Figure 6.4 Viscosity profile for alkaline lysis of frozen DH5a 134
/pXX (A) after 1 h fermentation, (B) 6 h, (C) 10 h
Figure 6.5 Viscosity profile for alkaline lysis of frozen DH1 135
/pXY grown in fed-batch fermentation a) after 0 h feed regime, b) 2 h, c) 6 h., d) 10 h
Figure 7.1 Image of plasmid DNA samples run on agarose 150
gels, before (a) and after (b) treatment with RNase
Figure 7.2 E.coli DH1 /pXY cell paste plasmid DNA samples 151
pre-treated with Benzonase and run on agarose gel
Figure 7.3 Viscosity vs. time profiles for E.coli DH1 /pXY from 152
Andrew F. Day List of Figures
Figure 7.4 Viscosity vs. time profile for E.coli DH 1/pXY batch 153
fermentation: early exponential (A), exponential (B) and stationary (C) phase; all treated with RNase
Figure 7.5 Effect of treatment with Benzonase on E.coli DH1 154
/pXY. Panels showing untreated (A) and treated (B) viscosity vs. time profiles
Figure 7.6 Viscosity vs. time profile for alkaline lysis of E.coli 155
□H I /pXY pre-treated with Benzonase, sampled during early exponential (A), exponential (B) and stationary (C) growth phases of batch fermentation
Figure 7.7 Effects of Proteinase K treatment on alkaline lysate 156
viscosity vs. time profiles
Figure 7.8 Viscosity vs. time profile for E.coli DH1 /pXY pre- 157
treated with Proteinase K sampled during early exponential (A), exponential (B) and stationary (C) growth phases of batch fermentation
Figure 7.9 Comparison of viscosity vs. time profile for E.coii 158
DH1 /pXY cell paste (A) and E.coli DH1 parental cell paste (B) from batch fermentation
Figure 7.10 Viscosity vs. time profile for parental E.coli DH1 159
sampled during early exponential (A), exponential (B) and stationary (0) growth of batch fermentation
Figure 7.11 Viscosity vs. time profile for E.coli DH1 /pXY cell 160
paste sampled at completion of batch fermentation using adjusted alkaline lysis solution
Figure 8.1 Example of agarose gel electrophoresis of plasmid 177
DNA samples removed from batch fermentation
Figure 8.2 Plasmid DNA as function of fermentation growth 178
Andrew F. Day List of Figures
Figure 8.3 Plasmid DNA as function of fermentation growth 179 phase and neutralisation time. E.coli grown in batch
fermenter. Lysates treated with RNase during lysis
Figure 8.4 Plasmid DNA from E.coli cell culture as a function of 180 fermentation time and neutralisation time, grown in
fed-batch fermenter. Treated with RNase
Figure 8.5 Amount of OC DNA in samples as function of ferm 181 time and neutralisation time, of batch fermentation
Figure 8.6 Purity of plasmid for RNase treated (a) batch 182 samples and (b) fed-batch samples
Figure 8.7 Correlation between plasmid DNA data from the 183 agarose gels and equivalent viscosity vs. time
profiles: (a) early exponential; (b) exponential; (c) stationary growth phase
Figure 9.1 Shear stress vs. rate for cell suspension compared 196 with: early exponential, exponential and stationary
cells lysed(A); early exponential, exponential and stationary cells lysed and neutralised after 5 min(B)
Figure 9.2 Shear sweep (A) and strain sweep (B) analysis of 197
E.coli DH1 /pXY cell paste No treatment with alkaline lysis prior to analysis
Figure 9.3 Example of shear sweep (A) and strain sweep (B) 198 analysis of E.coli DH1 /pXY treated with alkaline
lysis solution for 5 minutes prior to analysis
Figure 9.4 Example of shear sweep (A) and strain sweep (B) 199 for cell culture treated with alkaline lysis solution for
Andrew F. Day List of Tables
List of Tables
Table 1.1 Vector systems used for the transfer of therapeutic 4
DNA for gene therapy
Table 1.2 Final plasmid prep quality criteria 10
Table 2.1 Method to make 1 L of Luna Bertani liquid medium 38 Table 2.2 The relationship between total and working volume 41
of a fermenter and the inoculum volume used
Table 2.3 Description of the fed-batch feeding regime 43
Table 2.4 TE, PBS and alkaline lysis solution method 47
Table 2.5 Volumes of media blank and fermenter cell culture 50
for Optical Density (A eoonm) dilutions
Table 3.1 Fermenter scales used during thesis and working 61
volume/total volume ratio
Table 3.2 Maximum fermentation optical density achieved 65
Table 3.3 Maximum specific growth rates for shake-flasks 66
Table 3.4 Maximum specific growth rates from fermentation 68
campaign
Table 3.5 Inoculum volume to working volume ratios for 72
fermenters
Table 4.1 The gold standard viscosity vs. time profile for the 86
alkaline lysis of E.coli DH5a at 367 s'^ and 293 K
Table 5.1 Disruption rate constant (K) for E.coli DH1 and 107
DH5a as a function of fermentation growth phase
Table 6.1 Variation in timing of primary peak and secondary 123
Andrew F. Day List of Tables
Table 6.2 Maximum apparent viscosities for viscosity vs. time 124
profile of cells sampled in early exponential, exponential and stationary growth phases
Table 7.1 The composition of an average E.coli cell 137
Table 8.1 Plasmid DNA quality for samples removed from fed- 167
batch fermentation
Table 8.2 Comparison between batch and fed-batch 168
fermentation plasmid DNA purity and yield
Table 9.1 Flow behaviour index (s) and consistency index (K) 189 for resuspended cells, lysed and neutralised cells
Table 9.2 The impact on the phase angle of amplitude applied 192
during strain sweep experiments, for resuspended cells, alkaline lysates and neutralised samples
Andrew F. Day Chapter 1
1. Introduction and Theory
1.1. Introduction
This PhD is concerned with understanding the influence of fermentation conditions on the rheology of the alkaline lysis process - a key stage in the industrial production of plasmid DNA. The experiments will all be conducted at lab scale, and the use of scale-down techniques will aid the characterisation of the alkaline lysis process.
Scale-up and scale-down are tools used in the biotechnology industry to convert lab-scale data to larger scale pilot plant or industrial production. For this reason scale-up is an important step in product development, with its success dependent on the data and process development during lab scale work. If a process needs to be revised, then scale-down techniques can be utilised, by simulating industrial or large-scale conditions in small-scale experiments before subsequent scale-up (Oosterhuis and Kossen, 1983). Scale-down techniques can generate more precise, higher quality scale-up data and hence scale-up design. There are several applications for scale-up. Biological factors that are unimportant at small scale may be at large scale, and so scale-down can be used for screening production strains, or scale- down can be used to collect scale-up data (Jem, 1989 and Humphrey, 1998). Some experiments, for example medium optimisation are only practical to do in shake-flasks (Kennedy et al., 1994), hence the importance of scale-down techniques. The method used in this PhD is ultra scale-down, which comprises volumes measuring only 1 0 - 2 0 m l.
Andrew F. Day Chapter 1
and industry. This chapter also includes a summary of previous work related to this thesis, conducted by researchers at UGL. A detailed analysis of the aims of the experimental protocols completes this chapter. All references in this thesis are listed in the appropriate section.
1.2. Gene Therapy
Gene therapy is one of the fastest developing areas in modern medical research. In 1992 there were only 37 total protocols, 15 active protocols and 54 patients recorded as being in receipt of gene therapy (Morgan and Anderson, 1993). Currently there are over 532 separate active clinical trials world-wide with roughly 3,400 patients involved, targeting a wide variety of diseases ranging from cancer to HIV, cystic fibrosis to diabetes, immune deficiencies, metabolic disorders and arthritis (J. Gene Med website (www.wiley.co.uk/genmed Clinical trials database) 2001, Blankenstein, 1999 and Mountain, 2000). Most current clinical gene therapy studies involve cancer as the target disease (Martin and Thomas, 1998, Friedmann, 1999). The projected market for gene therapy products could exceed US$45 billion by 2010 (Prazeres et al., 1999).
1.2.1. The Theory Behind Gene Therapy
Gene therapy can be defined as the transfer of new genetic material to the cells of an individual with resulting therapeutic benefit to that individual (Anderson, 1992). The first successful attempt to treat a genetic disease, adenosine deaminase (ADA) deficiency, using gene therapy was performed on 14‘^ September 1990 (Anderson 1992). The patient, a four year old girl, received an infusion of her own T lymphocytes that contained normal copies of the ADA gene: this thirty minute procedure ended five years of laboratory work and three years of government review (Morgan and Anderson, 1993).
Andrew F. Day Chapter 1
diseases (e.g. cystic fibrosis) require tissue targeting for effective therapeutic treatment. This is especially true for cancer treatment, where the problem is the need to target every single malignant cell. Despite this hurdle, of the 532 active trials, a large proportion are for cancer research (Robinson et al., 1997 and Blankenstein 1999).
1.2.2. Vectors Used in Gene Therapy
There are three main types of vectors that can be used for the delivery of therapeutic DNA: viral, non-viral and physical (Mountain, 2000). Currently the most extensive usage has been with the RNA viruses (the retroviruses). This is mainly because the biology of retroviruses is so well understood, and because long term expression can be achieved. However there is an increasing move towards using naked or plasmid DNA vectors, due to ease of delivery and relatively simple manufacture, by the end of 1996, about 24% of clinical trials underway used plasmids as vectors (Prazeres eta!., 1999). This represents a massive shift of focus toward plasmid DNA vectors.
The major vectors that have been developed for the delivery of the therapeutic DNA are:
> Retrovirus vectors > Adenovirus vectors
> Adeno-associated vectors > Plasmid DNA
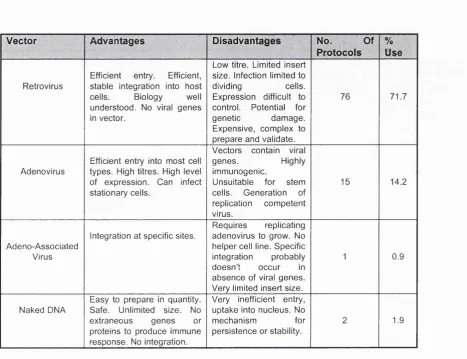
Table 1.1 lists the advantages and disadvantages for each vector in gene therapy, and the frequency of their use in protocols by 1996.
Andrew F. Day Chapter 1
ex vivo requires the removal of cells, whereas in vivo can be achieved by direct injection. This is preferable because it means treatment is easier for both the doctor and patient.
Vector advantages
- Disadvantages ProtocolsI Use
Retrovirus
Efficient entry. Efficient, stable integration into host cells. Biology well understood. No viral genes in vector.
Low titre. Limited insert size. Infection limited to
dividing cells.
Expression difficult to control. Potential for
genetic damage.
Expensive, complex to prepare and validate.
76 71.7
Adenovirus
Efficient entry into most cell types. High titres. High level of expression. Can infect stationary cells.
Vectors contain viral
genes. Highly
immunogenic.
Unsuitable for stem cells. Generation of replication competent virus.
15 14.2
Integration at specific sites. Adeno-Associated
Virus
Requires replicating adenovirus to grow. No helper cell line. Specific integration probably doesn’t occur in absence of viral genes. Very limited insert size.
0.9
Naked DNA
Easy to prepare in quantity. Safe. Unlimited size. No extraneous genes or proteins to produce immune response. No integration.
Very inefficient entry, uptake into nucleus. No
mechanism for
persistence or stability.
1.9
Table 1.1: Vector systems used for the transfer of therapeutic DNA for gene therapy (Orkin and Motulsky, 1995).
1.2.3. Production of Vectors for Gene Therapy
As noted earlier, roughly a quarter of the clinical trials under way use plasmids as vectors. This mode of treatment requires multiple doses, and thus large amounts of plasmid DNA, at a pharmaceutical grade (i.e. suitable for direct injection). For example, a typical dose size for a melanoma patient is 0.3pg, but a full course of treatment could require milligrams (Prazeres et al.,
Andrew F. Day Chapter 1
plasmid DNA is produced, and the problems and bottlenecks that face the biochemical engineer at a large scale.
Plasmid DNA can be manufactured by the fermentation of a recombinant bacterial cell carrying the plasmid vector followed by harvesting of the cell paste and then lysis of the cells. The chromosomal and plasmid DNA can then be separated in a primary recovery step. Cell lysis and DNA separation can be combined in the alkaline lysis procedure (Birnboim and Doly, 1979). This is a crucial step in the production process but suffers from problems ranging from pH control and lysate mixing through to shear- sensitivity of the genomic contaminants and of the product leading to possible yield loss (Levy et al., 2000).
Before it can be produced, a plasmid must first be designed and constructed to perform the required gene therapy. Once a gene therapy plasmid has been designed in this way, it must be established in a suitable production strain of a microorganism, usually a bacteria such as E.coli.
Desirable phenotypes include the ability to ferment to a high cell density and high plasmid copy number, minimal generation of non-plasmid containing cells, minimal potential for genetic alterations to the plasmid and compatibility with subsequent purification procedures. Currently, well-characterised strains of E.coli K-12 such as DH5a or DH10B are the industrial standard (Durland and Eastman 1998). The production process can be split into several stages:
> Fermentation > Harvesting > Purification > Finishing
Andrew F. Day Chapter 1
followed by the major problems associated with each.
1.2.3.1. Fermentation
Much is already known about the fermentation of E.coli, and so this section will only consider the specific requirements relevant for plasmid production in shake flasks and stirred tank reactors (STR). Most E.coli strains can be used to propagate plasmid DNA. For the experimental work in this thesis two strains were used: E.coli DH5a and DH1. Figure 1.2 shows an example of one of the plasmids used for the experimental work: pQR235. From the diagram it can be seen that it has a pUC origin of replication (and therefore a high copy number), encodes for kanamycin resistance and p-galactosidase selection (other plasmids used are described in Chapter 2, which provides greater detail on the protocols used during experimental work, for each of the steps in the purification process).
E.coli fermentations can be either batch or fed-batch (these are preferred over continuous operation since they allow for batch identification of the finished plasmid and for ease of scale-up) and in both cases the fermentation proceeds to a defined end-point, and this is usually the point for maximum plasmid yield, defined empirically (Durland and Eastman 1998).
Andrew F. Day Chapter 1
1.2.3.2. Cell Harvest
Bacteria are usually harvested in the late log phase (Horn et a!., 1995), and the nature of the product (i.e. extra- or intra-cellular) will determine the process used. Plasmids are intra-cellular, and so cell harvesting involves retaining the cell paste for further treatment. For plasmid DNA production, there are two recognised methods: centrifugation or microfiltration (Prazeres
at a i, 1999). For the purposes of this report, centrifugation is the method used (see Chapter 2). Following the cell harvesting, the cells are resuspended in TE buffer, for subsequent downstream processing.
1.2.3.3. Purification
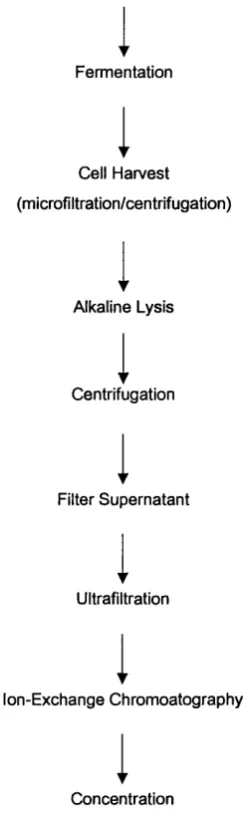
Figure 1.1 shows the steps involved in the plasmid DNA process. The process has been developed with several factors in mind: the yield and purity must be as high as reasonably possible while the cost, time and number of process steps are minimised; all procedures must be scaleable and all procedures must be reproducible to ensure that all batches of plasmid meet the required specifications.
Andrew F. Day Chapter 1
Seed Tank
Fermentation
Cell Harvest
(microfiltration/centrifugation)
Alkaline Lysis
Centrifugation
Filter Supernatant
Ultrafiltration
Ion-Exchange Chromoatography
Concentration
(ultrafiltration/diafiltration)
Andrew F. Day Chapter 1
From Figure 1.1 it can be seen that there are five steps in the purification process: alkaline lysis, centrifugation, supernatant filtration, ultra filtration and ion exchange chromatography. Briefly, the filtration steps are performed on the centrifugation supernatant to produce a sterile and homogeneous cleared lysate, which will be used for the chromatography step. The chromatography step intends to remove residual contaminants such as nucleotides, proteins, RNA, single stranded DNA and lipopolysaccharides. The plasmid DNA is then eluted by a high salt buffer and precipitated with isopropanol. The precipitated DNA is then ready for finishing (Rehm and Reed, 1999). This is at pilot plant scale of operation and above, using a STR, and small-scale shake flask experiments generally go no further than alkaline lysis. The most important step in terms of scale up, and the least characterised, is alkaline lysis (see section 1.3). This forms a focal point for this thesis, as described in the thesis aims (section 1.6).
1.2.3.4. Finishing
Following purification, the next step is to concentrate the product, or to exchange unwanted buffers. This is achieved using ultrafiltration or diafiltration. Sterile filtration is often the final step in the production of bulk plasmid, for human usage, and following this polishing step the plasmid is stored at 4°C (Durland and Eastmann, 1998) prior to secondary manufacturing e.g. formulation.
There are requirements for the level of purity and the maximum amount of contaminants allowed in a plasmid DNA batch, and these are detailed in the following section.
1.2.4. Plasmid DNA Purity
Andrew F. Day Chapter 1
lipopolysaccharides: common components of the cell wall of gram negative bacteria), and any antibiotics used in growth of production strain (Dertzbaugh, 1998). Therefore, during production a high degree of removal of these impurities is necessary (Schleef ef a/., 1997).
Table 1.2 provides a summary of the quality criteria demanded by the FDA. If these criteria are not met, then validation of the process and acceptance of the end product will be extremely difficult (Schorr et al., 1995). Good manufacturing practices should be employed at all times (Epstein, 1996). The current understanding is that plasmid vectors should be in the supercoiled, or covalently closed circle form, as it is more effective at transferring gene expression than the open circle, linear, multimeric or partially denatured forms (Prazeres at a/., 1999). The current ruling is that plasmid DNA homogeneity should be greater than 90% ccc (Schorr at a/., 1995). This is a specification that places significant demands on the biochemical engineer wishing to design and operate a large-scale process.
Quality Criteria FDA Requirement
E .c o li g e n o m ic D N A < 1 0 ng dose'"'
H o st p rotein < 1 0 ng d o se
R N A level N one seen on 0 .8 % a g a ro s e gel
E n d o to xin < 0.1 E n d o to xin U nits (E U ) (p g plasm id)'^
D N A h o m o g e n e ity > 9 0 % c o v a le n tly clo se d c irc u la r (c c c )
S te rility No c o lo n ie s a fte r 21 d a y try p to s e b roth c u ltu re
P u rity S p e c tro p h o to m e ric s c a n s b e tw e e n A220 and A320
Id e n tity R e strictio n d ig e s t
A b s o rb e n c y a t A260/280 1 . 7 5 - 1 .8 5
P o te n c y T ra n s fe c tio n e x p e rim e n ts
Table 1.2: Final plasmid prep quality criteria (Prazeres at a/., 1999 and Schorr
at a!., 1995).
Andrew F. Day Chapter 1
EcoRI
Xhol
,B a m H l
! /® a l
Saol
Am p
p U C o ri
PQR235
8.1 kb
HindIII
Sacl PstI
Km
HindIII
PstI
S a lG l\\ BamHI
pSVp-Km orientation no. 1
Figure 1.2: A plasmid map of pQR235, a high copy number, pUC origin plasmid expressing ampicillin resistance (Amp), kanamycin reistance (Km) and beta galactosidase selection (p-gal).
1.2.5. Process Problems
This section looks at the process problems and bottlenecks experienced so far in the two major parts of the production: fermentation and downstream processing.
1.2.5.1. Fermentation
The main fermentation aspect for the biochemical engineer is the question of yield and the problems of scale-up. In a large-scale process, high cell
Andrew F. Day Chapter 1
densities are reached (Optical Density (Agoo nm) = 30-100), and therefore to develop an equivalent plasmid yield, a combination of plasmid and host-strain selection with optimisation of media and fermentation are required. It is possible to achieve plasmid yields (expressed per unit volume of cell culture) as high as 220 pg m L'\ This is compared to shake flask yields for high copy- number plasmids in Eco// growing in Luria Bertani (LB) broth at 37°C of 3-5 pg ml'^ (Prazeres etal., 1999).
1.2.5.2. Downstream Processing
The majority of problems in the production of plasmids are encountered in the downstream processing operations, aimed at removing cellular contaminants (Prazeres at a/., 1999). Figure 1.1 shows the unit operations, and the following bullet points consider the important process problems for cell harvesting, alkaline lysis and purification:
A: Cell harvesting - efficient removal of cells from broth with limited loss of cells in the waste stream.
B: Alkaline lysis (see section 1.3) - this is a crucial step in the process, and one with a lot of potential problems (Prazeres at a!., 1999). Briefly, the main problems are:
> pH range and control - maintaining pH within the required range for efficient alkaline lysis, as values higher than 12.5 can cause irreversible plasmid dénaturation (Prazeres at a!., 1998).
> Mixing of lysate - it is important to have good mixing to ensure complete and efficient alkaline lysis throughout the cell sample undergoing lysis (Marquet at a!., 1995).
> Shear-sensitivity of lysate - previous work has shown that the resultant gel matrix is shear sensitive (Ciccolini at a!., 1998). Mixing should be gentle to avoid shearing gDNA and plasmid DNA, to help with separation down stream (Prazeres at a!., 1999).
Andrew F. Day Chapter 1
solution and neutralisation buffer,
> Lack of reproducibility - the alkaline lysis process is not well characterised, leading to a considerable range in yield.
> Loss of plasmid - caused by any or a combination of the above problems. Plasmid DNA can also be lost in the liquid held in the solid phase (Theodossiou etal., 1997).
0: Purification - contaminants remaining include RNA, gDNA fragments, endotoxins and plasmid variants. These are all very similar molecules to the plasmid DNA product and provide a potential purification problem for size exclusion and ion-exchange chromatography: although RNA is easily removed, gDNA fragments and endotoxins may co-purify with the plasmid due to similar binding affinities (Prazeres at a/., 1999). The passage of gDNA fragments downstream are of particular concern given the poor resolving capacity of chromatographic methods for this material relative to the plasmid product.
In the next section the role and design of the alkaline lysis process itself is described in detail from the perspective of the process operation.
1.3. Alkaline Lysis
In section 1.2 the use of alkaline lysis for the production and purification of plasmid DNA for gene therapy was introduced. This section provides an introduction to the theory of alkaline lysis. Details of all the protocols used are presented in Chapter 2.
The alkaline lysis reaction was developed as a procedure for extracting plasmid DNA from bacterial cells (Birnboim and Doly, 1979). There are three defined stages to the method, which produces plasmid DNA from the cell paste harvested from the STR. This method is an established industry norm, and the three stages are:
Andrew F. Day Chapter 1
> Neutralisation
The cell lysis and neutralisation steps will be considered in detail in the following sub-sections. According to the method of Birnboim and Doly, before the lysis and neutralisation the E.coli cell paste is resuspended in I E buffer at a concentration of 12.5 g wet cell weight per 100 ml. The cell lysis stage then follows.
1.3.1. Cell Lysis
The cell lysis step is initiated by the addition of a solution of sodium hydroxide containing sodium dodecyl sulphate (SDS) to the cell paste suspension. The lysis reaction occurs as a result of the interaction of SDS with lipids and proteins in the cell wall, solubilising the cell wall and hence releasing the intracellular contents (Birnboim and Doly, 1979 and Cicollini etal., 1998).
Within a narrow pH range (12 - 12.5) it is known that high molecular weight DNA is irreversibly denatured, and low molecular weight DNA is reversibly denatured. The presence of NaOH in the solution provides the required alkaline pH in the mixture and hence causes the reversible dénaturation of the low molecular weight plasmid DNA and the irreversible dénaturation of high molecular weight chromosomal DNA.
1.3.2. Neutralisation
Andrew F. Day Chapter 1
1998).
The three stages can be clearly seen in figure 1.3(a)-(c). Previous work at UGL (e.g. Ciccolini et al., 1998) investigating the rheological changes that occur during alkaline lysis using a co-axial rheometer is described in section 1.5.
The rheology of the alkaline lysis reaction is important as viscoelastic properties may have a negative impact on the process for manufacturing plasmid DNA when sudden changes in rates of deformation occur, for example during flow start-up and stop. The possible impact is considered in greater depth along with the theory behind rheology in the next section.
1.4. Rheology
This section discusses the theory behind the science of rheology and how it is employed in industry. It also considers how rheology may be used to analyse the alkaline lysis of E.coli cell cultures sampled from fermentations run as described in Chapter 3. Finally the rheology section discusses the importance of rheology in the production of plasmid DNA for gene therapy.
1.4.1. Introduction to Rheology
The original definitions of solids and liquids as two sharp and separate physical laws, as established by Hooke and Newton respectively, have been found to be inadequate in their ability to describe the behaviour of a wide class of materials that are now known as viscoelastic solids or elastic liquids (Walters, 1974). The study of these complex materials has come to be known as the study of rheology, and is the topic of this section of the thesis. The viscosity coefficient is traditionally measured in a viscometer. However, as explained in section 1.4.4, the viscometer is inadequate for characterising the behaviour of many of these complex materials, and has to be replaced by a rheometer, defined as an instrument for the measurement of rheological properties (Walters, 1980).
Andrew F. Day Chapter 1
College, Indiana in the 1920s, and means “the study of the deformation and flow of matter” (Barnes et. al., 1989). Rheology covers the study of the properties and behaviour of a wide range of materials, from asphalt to rubber, and lubricants to plastics.
(A) (B)
(C)
Figure 1.3: (A) E.coli cell paste resuspended in TE buffer at a ratio of 12.5 g wet cell weight per 100 m l of buffer. (B) Photograph of resuspended cells after the addition of alkaline lysis solution. (C) The impact of adding neutralisation buffer to the lysed solution. All photographs appear courtesy of GlaxoSmithKline R&D, Beckenham, UK.
Andrew F. Day Chapter 1
Significant advances have been made in the study of the rheology of many of these industrial and household products; advances in polymer rheology and suspension rheology have lead to a greater understanding of the importance of rheology in the chemical processing industries.
In the field of biology, many body fluids have been shown to have viscoelastic behaviour including blood, synovial fluid and various forms of mucus. This has lead to the development of an international society of biorheology (Walters, 1974), and the increased use of rheological techniques in the biotechnology industry.
Figure 1.4 illustrates how flow is initiated by a shear stress, and this is discussed in greater detail in section 1.4.2. However, fluid flow patterns and the relationship between fluid deformation and stress are more complex generally than the one shown in Figure 1.4. Rheology is the discipline that studies this complex relationship, by obtaining constitutive equations by which stresses may be derived from deformation rates (Perry, 1997).
The following three sections discuss the theory of viscosity, elasticity and viscoelasticity.
1.4.2. Viscosity
Isaac Newton published the “Principia” in 1687, and in it hypothesised that “the resistance which arises from the lack of slipperiness of the parts of the liquid, other things being equal, is proportional to the velocity with which the parts of the liquid are separated from one another." This lack of slipperiness is what we now call viscosity; this term is synonymous with internal friction and is a measure of resistance to flow. The force per unit area (F/A) required to produce motion is denoted by t and is proportional to the velocity gradient, or shear rate U/d. In other words, if you double the force you double the velocity gradient. This relationship is described by Newton's postulate:
T = r|U/d (Equation 1.1)
Andrew F. Day Chapter 1
simply as viscosity) t is termed shear stress and U/d is the shear rate (it is usual to write y° for shear rate, and this will be used from now on in the thesis). Viscosity and apparent viscosity are derived using equation 1.1, with units of Pa.s. Kinematic viscosity is the ratio of viscosity to density, measured in n fls.
V=T|/p (Equation 1.2)
Where V is kinematic viscosity, r| is viscosity and p is density.
Figure 1.4 illustrates how flow is initiated by a shear stress ( t ) . In the case of a Newtonian liquid, the flow persists as long as there is a stress applied. Purely viscous fluids can be divided into time-dependent (shear stress depends on past history of shear rates, due to structural build-up or breakdown during deformation) and time-independent (shear stress depends on current shear rate) fluids (Perry, 1997).
Newtonian behaviour in experiments conducted at constant temperature and pressure has the following characteristics:
> The only stress generated in simple shear flow is the shear stress ( t ) , with both normal stress differences being zero.
> The shear velocity does not vary with shear rate.
> The viscosity is constant with respect to the time of shearing and the stress in the liquid falls to zero immediately the shearing is stopped. A fluid that deviates from any of the above characteristics has non-Newtonian behaviour (Barnes et al., 1989).
Viscosity is the most important property affecting flow behaviour of a fluid. It has a marked impact on pumping, mixing, mass transfer, heat transfer and aeration of fluids (Doran, 1998).
Andrew F. Day Chapter 1
1.4.2.1. Measuring Viscosity
In order to measure viscosity it is necessary to create a controlled flow environment (rotational motion with laminar flow) where easily measured parameters (torque (M) and angular velocity (Q)) can be related to shear stress ( t ) and shear rate (y°), using approximate formulae depending on the geometry of the apparatus. Figure 1.5 shows the expected shear stress vs. shear rate rheograms for Newtonian, dilatant, pseudoplastic, and Bingham plastic fluids. These values can then be used for evaluation of viscosity for Newtonian fluids, or parameters important in the characterisation of non- Newtonian fluids (Doran, 1998). Experiments for measuring rheological behaviour are always measured at constant temperature and pressure, to avoid changes in measured viscosity/apparent viscosity (see section 1.4.8).
F
Figure 1.4: Two parallel planes of area A, at y = 0 and y = d, the intervening space being filled with sheared liquid. The upper plane moves with velocity U and the lengths of the arrows between the planes are proportional to the local velocity Vx in the liquid.
Andrew F. Day Chapter 1
1.4.3. Elasticity
Robert Hooke wrote the “True Theory of Elasticity” in i678, within which he proposed, “the power of any spring is in the same proportion with the tension thereof.” That is, if you double the tension you double the extension. This is the theory of classical elasticity. For a Hookean solid, a shear stress (t) applied to the surface of a solid results in deformation. Once the deformed state is reached it is maintained as long as the stress is applied.
Figure 1.6 illustrates this principle. The constitutive equation is shown below:
T =
G y
(Equation 1.3)Where the angle y is called the strain, and G is referred to as the rigidity modulus.
1.4.4. Viscoelastic Fluids
Andrew F. Day Chapter 1
(A)
10*01 M Pa
— Viscosity niPas Shoai s tre s s Pa
10M
(B)
1MM
10M
1#
10 IMrear thickening _
Miighatn plastic lew toniaii area# thinning 1---1
i 1
Î ---1
10 100
Slieai rate . 1/s
1000
(C)
10000 10000
1000 1000
Viscosity n i P a s 10 Shear s tre s s Pa
100 1000
Figure 1.5: Series of rheograms showing logarithmic shear stress plots for Newtonian fluid (A); different types of non-Newtonian fluids (Bingham plastic, shear thickening and shear thinning) (B); and for an arbitrary fluid with K=10 pas^ (s = 0.7) (0) (Source: http://chemeng1.kat.lth.se/staff/ulf-b/mp-rheo.htm).
Andrew F. Day Chapter 1
1.4.4.1. Impact of Viscoelastic Behaviour
Viscoelastic fluids exhibit elastic recovery from deformation when stress is removed. Viscoelastic properties may be important when designing plasmid DNA processes when sudden changes in rates of deformation occur for a number of reasons: during flow start-up and stop; with rapidly oscillating flows; and as fluid passes through sudden expansions and contractions where acceleration occurs. If there is a process with a fully developed flow where none of these factors occur then viscoelastic fluids behave as if they were purely viscous (Perry, 1997). In viscoelastic flows, normal stresses perpendicular to the direction of shear are different from those in the parallel direction, and this impacts the behaviour of the fluid causing the Weissenberg effect where fluid climbs up the rotating shaft in the fluid (Figure 1.7), and die swell where a stream of fluid issuing from a tube may expand to two or three times the tube diameter (Perry, 1997). The Weissenberg effect has a negative impact on mixing, reducing the efficiency of mixing (Walters, 1974).
The Deborah number (De) is an important parameter that can be used to indicate the importance of viscoelastic effects for a particular fluid (see equation 1.4). It measures the ratio of the characteristic relaxation time of the fluid to the characteristic time scale of the flow.
= y (Equation 1.4)
Where X is the characteristic relaxation time and t is the characteristic time scale of the flow.
Andrew F. Day Chapter 1
Figure 1.6: The result of the application of a shear stress a to a block of Hookean solid - on the application of the stress the section ABCD is deformed to become A’B’C’D’.
1.4.4.2. Normal Stresses and Their Impact on Fluid Behaviour
Normal stress differences (N^ and Ng) are associated with non-linear effects. The generation of unequal normal stress components and hence non-zero values of N^ and Ng, arises from the fact that in a flow process the microstructure of the liquid becomes anisotropic. These normal stresses are responsible for a number of effects of laboratory interest and of commercial importance, such as the Weissenberg effect (see Figure 1.7).
Whereas a Newtonian liquid would be forced towards the rim of the vessel by inertia, the elastic liquid produces a free surface that is much nearer the rod. The rise of the surface is independent of the direction of the rotation.
Andrew F. Day Chapter 1
m
: ; ; ÿ - Y
' V ï i <- • ; ' j •:
Figure 1.7: An example of the impact of elastic component: the Weissenberg effect. The rod - climbing can be clearly seen, caused by normal stresses acting on the fluid (Barnes et al., 1989).
1.4.5. Non-Newtonian Fluids
1.4.5.1. Apparent Viscosity
The logarithmic shear stress rheograms shown in Figure 1.5 show that non- Newtonian fluids do not exhibit the same constant relationship between shear stress and shear rate that Newtonian fluids have: when the shear rate acting upon a non-Newtonian fluid is varied, the shear stress doesn’t vary in the same proportion, or even in the same direction (Brookfield Manual). This means that the viscosity will change as the shear rate is altered, and thus the measured viscosity of a non-Newtonian fluid is known as the apparent viscosity (r|J. The apparent viscosity is only accurate when experimental parameters and conditions are adhered to and quoted alongside any measured value.
1.4.5.2. Shear-Thinning (Pseudo-Plastic)
Andrew F. Day Chapter 1
rate. Many polymer melts and solutions, as well as some solid suspensions are shear thinning, and they follow the power law model over a range of shear rates (Perry, 1997). The power law model is shown in equation 1.5.
T = r|a(y7 (Equation 1.5)
Where s is the power law index, which gives a measure of the degree of non- Newtonian behaviour of the material. For shear-thinning fluids, 0 < e < 1.
1.4.5.3. Shear-Thickening (Dilatant)
Some fluids show increasing viscosity with increasing shear rate. They may be described by the power law model (equation 1.5) when e < 0.
If the shear stress (x) and the shear rate (y°) are plotted on logarithmic axis, the equation obtained is:
Log T = (Log ri) + s (Log y°) (Equation 1.6)
If (Log T|) = K (consistency index), then equation 1.6 becomes: Log T = 8 (Log y°) + K (Equation 1.7)
This is the equation of the straight line where K is the intercept with the y-axis and the degree of Newtonian behaviour (e) is the slope of the line. The consistency index, K, reflects the apparent viscosity of the measured material at a point in time. If it changes as a function of the time during which a strain is applied to the sample the material displays time dependent flow (see section 1.4.8). Other more complex flow equations are described in appendix A.
1.4.6. Measuring Viscoelasticity
Andrew F. Day Chapter 1
viscous flow - the principle behind viscometry tests. At low strains the elastic component plays a part in the materials behaviour and so it is necessary to define and measure it, using a suitable rheometer (Ciccolini, 1999).
A rheometric measurement normally consists of a strain (deformation) or a stress analysis at a constant frequency (normally 1 Hz) combined with a frequency analysis, for example between 0.1 and 100 Hz. The strain sweep gives information on the elastic or storage modulus (O’), the viscous or loss modulus (G” ) and the phase angle ô (Bolmstedt, 2001). The experimental studies completed for this thesis used only oscillatory techniques based on the protocol used by Ciccolini (1998). This is detailed in Chapter 2. The oscillatory techniques involve the application of a stress or strain whose value changes continuously according to a sine wave equation. The induced response (strain or stress) will also follow a sine wave. The complete cycle of the sine wave is considered as 360°, and the differences between the two phases (applied and response) are termed phase angles (Ciccolini, 1999).
A large value of G’ in comparison to G” indicates pronounced elastic properties of the fluid being analysed. If the fluid is highly elastic then the phase angle is small, around 20°. A phase angle of 0° means a perfectly elastic material and a phase angle of 90° means a perfectly viscous material (Bolmstedt, 2001). This is because the strain is directly related to the stress in an elastic solid, and so at maximum stress the strain will be at its maximum, and the strain response is totally in phase with the applied stress; with viscous fluids, the strain is completely out of phase with the applied stress (Ciccolini, 1999), as shown in Figure 1.8(a).
The frequency sweep gives information about the elastic strength where a large slope of the G’ curve indicates low strength and a small slope indicates high strength (Bolmstedt, 2001).
1.4.6.1. The Storage and Loss Modulus
Andrew F. Day Chapter 1
strain is constantly changing, and hence so is G. The material’s complex modulus (G*) is obtained from the ratio of the stress amplitude to the strain amplitude. G* is the sum of the elastic component and the viscous component, and is defined by equation 1.8:
G* = G’ + jG ” (Equation 1.8)
Where G’ is the storage modulus, G” is the loss modulus and j is the imaginary number = -1 ). The units of G* are Pa.
The phase angle ô is the difference between the stress and strain (as shown in Figure 1.8(a)), and is given by:
Ô = tan-1 X (G”/G’) (Equation 1.9)
This relationship is shown graphically in figure 1.8(b), as well as the relationship between G*, G’ and G” . G’ and G” can be defined in terms of sine and cosine, as described in equations 1.10 and 1.11:
G’ = G * x c o s 5 (Equation 1.10)
G” = G* X sin Ô (Equation 1.11)
1.4.7. Rheology in Industry