O R I G I N A L R E S E A R C H
Functional and Structural Changes of the Retinal
Nerve Fiber Layer and Ganglion Cell Complex in
Heavy Smokers
This article was published in the following Dove Press journal: Clinical Ophthalmology
Marwa Abdelshafy Ahmed Abdelshafy
Ophthalmology Department, Benha University, Benha, Egypt
Purpose: To assess the functional and structural changes in the retinal nerve fiber layer
(RNFL) and the ganglion cell complex (GCC) in heavy smokers using pattern electroretino-gram (PERG), photopic negative response(PhNR) and spectral domain optical coherence tomography (SD-OCT).
Patients and Methods: Sixty eyes of 30 heavy smokers (at least 15 cigarettes/day for 10
years) (study group) and 60 eyes of 30 age and gender-matched healthy non-smoker subjects (control group) were included. After full ophthalmologic examination (PERG), (PhNR) using RETI-port/scan 21 (Roland Consult, Brandenburg, Germany) and (SD-OCT using Topcon 3D OCT model 2000 FA version.8.30) were tested for all participants. Statistical analysis was performed to compare GCC, RNFL thicknesses, PERG and phNR values between groups.
Results: The mean age was 36.67±4.13 years in the study group and 36.0±4.76 years in the
control group. There were no statistical significant differences between the two groups regarding intraocular pressure (p=0.43), axial length (p=0.37), and central corneal thickness (p=0.86). There were significant differences of GCC thickness values between the study group (88.4±6.6 µm) and control group (94.83±5.25 µm) (p<0.001). The mean RNFL values of study and control groups were 97.87±5.88 and 106.43±6.59 µm, respectively (p<0.001). In the study group the superior and inferior quadrants of RNFL were significantly thinner, but there were no significant differences between the two groups in nasal and temporal quadrants. There were no significant differences of PERG-P50 amplitude (p=0.49) and latency (p=0.71); however, PERG-N95 amplitude and latency showed significant differences between the two groups (p<0.001).There were significant differ-ences of phNR amplitude and latency between the two groups (p<0.001). Multiple regression analyses demonstrated that the PhNR, PERG amplitude and latency are the most important determinants for both RNFL and GCC thicknesses.
Conclusion:In heavy smokers RNFL thickness was decreased, the PhNR, PERG-N95
ampli-tudes were diminished and the implicit times were prolonged compared to non-smokers. PhNR and PERG reflect both dysfunction and loss of ganglion cells and their axons.
Keywords:GCL, nervefiber layer, optical coherence tomography, pattern electroretinogram,
photopic negative response
Introduction
The World Health Organization (WHO) estimated that tobacco could kill around six million individuals each year, includingfive million deaths due to direct tobacco use and about 600,000 deaths of non-smokers being vulnerable to passive smoking. The increased number of cigarettes smoked per day and the duration of smoking are emphatically affiliated to high mortality and morbidity rate.1
Correspondence: Marwa Abdelshafy Faculty of Medicine, Ophthalmology Department, Benha University, 1 El Amirafawzya Street, Benha, Qalubiya Governorate, Benha 13512, Egypt Email [email protected]
Clinical Ophthalmology
Dovepress
open access to scientific and medical research
Open Access Full Text Article
Clinical Ophthalmology downloaded from https://www.dovepress.com/ by 118.70.13.36 on 24-Aug-2020
Tobacco smoke consists of more than 4000 synthetic compounds that are harmful to the cardiovascular and respiratory systems. Smoking increases the risk of athero-sclerotic and thrombo-embolic complications.2 It also increases the risk of developing many visual pathologies such as glaucoma, cataract, diabetic retinopathy, hyperten-sive retinopathy, thyroid orbitopathy, age-related macular degeneration (ARMD), ischemic optic neuropathy, kerato-conjunctivitis sicca and retinal vein occlusion.3,4
Heavy smoking and excessive nicotine result in direct neu-rotoxic impact on the optic nerve. This neuneu-rotoxic effect may be accompanied by vasoconstriction and reduction of bloodflow that lead to ganglion cell and retinal nervefiber layer (RNFL) loss.5Previous research reported diminished retinal sensitivity and peripheral scotoma in the visualfields of heavy smokers.6
Spectral domain-optical coherence tomography (SD-OCT) with advanced software (e.g., enhanced depth imaging) generates high resolution cross-sectional images and provides a quantitative measurement of the peripapillary retinal nerve
fiber layer (cpRNFL) and ganglion cell-inner plexiform layer complex (GC-IPL).7The pattern electroretinogram (PERG) is an objective test that provides assessment of the central/macu-lar retinal functions.8The origins of N95 wave from ganglion cell allow electrophysiological assessment of their function in primary and secondary optic nerve dysfunctions, where parti-cular loss of N95 component can be noticed.9
The photopic negative response (PhNR) is the negative potential that occurs after the b-wave of the ERG. It originates from the retinal ganglion cells (RGC) and their axons so it represents the ganglion cell and inner retinal cell function.10 It can be decreased in diseases that infl u-ence the inner retina, including glaucoma and different types of optic neuropathy.11Previous studies have reported a correlation between the amplitudes and latency of the PhNR with the mean RNFL thickness. This indicates that the RGC function is correlated to RNFL thickness.12
With these advances, ophthalmologists have the chance to evaluate the impact of heavy cigarettes smoking on the retinal nerve fiber layer and ganglion cell layer in more detail. The purpose of this study was to assess the basic morphological and functional changes in RNFL and GCC of heavy smokers in comparison to non-smokers.
Materials and Methods
Patients
This study was conducted in the Ophthalmology Department of Benha University Hospitals in the period between
January 2018 and February 2019 after the required ethical approval from the local research ethical committee of Benha Faculty of Medicine. The study followed the basic rules of declaration of Helsinki involving human trials and all parti-cipants signed written informed consent.
One hundred and twenty eyes of 60 participants were included in this study. They were divided into two groups according to their smoking status; group (A) 30 heavy smokers (defined as subjects who smoke at least 15 cigar-ettes per day for 10 years) and group (B) 30 age and gender-matched healthy non-smoker participants.
The inclusion criteria were patients of both gender, age ranged between 29 and 45 years, best corrected visual acuity of 20/20 or better with spherical refraction ranged from +1.0 to
−1.0 dioptre and intraocular pressure less than 21mmHHg. Exclusion criteria were any evidence of systemic disease that was diagnosed upon history taking, general physical examina-tion and laboratory investigaexamina-tions such as; diabetes mellitus, hypertension, multiple sclerosis and Alzheimer’s disease. Subjects with history of glaucoma, eye trauma, Lasik surgery, retinal surgery, previous retinal diseases, and alcohol or drug intake of preparation that could affect the measurements espe-cially systemic vasoactive substances were also excluded.
Ophthalmological Examination
Full ophthalmological examination were performed to all subjects including slit-lamp examination, intraocular pressure measurement (IOP) by Goldmann applanation tonometry, refraction, best-corrected visual acuity (BCVA) and fundus examination. The central corneal thickness (CCT), and axial length (AXL) were measured by the LenStar LS900.
SD-OCT (Topcon 3D OCT model 2000 FA ver-sion.8.30) was used to measure the peripapillary RNFL and GCC thickness from the macular map scan which calculated automatically through the device’s software.
PERG and PhNR were recorded using the RETI-port /scan 21 (Roland Consult, Brandenburg, Germany). The PERG test was performed without Pupils dilation to improve the quality of the retinal image and under photopic condition. Stimulation of both eyes at the same time was used with patient refraction/correction for 100 cm viewing distance.
PERG stimulation parameters included the following: large and small black-and-white backward-moving checker-board stimulus (>15° field of view), >80% contrast, mean luminance 50 (cd/m2), with a check size equals to 1° 2′; and 2 reversals/s.
The ground gold disk electrode was placed over the forehead, while the HK-loop electrode was applied into
Clinical Ophthalmology downloaded from https://www.dovepress.com/ by 118.70.13.36 on 24-Aug-2020
the lower fornix after usage of local anesthesia eye drops and the surface reference electrodes were fixed on the ipsilateral outer canthus skin of each eye. The PERG test was performed following the ISCEV guidelines.13
The PhNR examination was performed following the strict ISCEV Standards for the photopic ERG; including pupil dila-tion and 10 minutes of light adaptadila-tion. Ganzfeld settings were: Background blue 25 cds/m2 (455 nm), red lightflash stimulus 0.4 cds/m2 (625 nm), with Inter-flash interval: 1 s.
The PhNR amplitude was identified as the difference between the baseline and the trough of the negative wave following the b-wave (Figure 1).11The implicit time was identified as the time interval from onset of the stimulus and the peak of the negative wave.
Statistical Analysis
Statistical analysis of the data was performed using the SPSS software version 20. Quantitative information was presented in terms of mean ± SD, while descriptive data were tested using chi-square test. Independent samplet-test and Mann–WhitneyU-test were utilized accordingly, when-ever applicable, for performing inter-group comparisons. Pearson’s correlation analysis and Regression analyses assessed various factors that could affect the RNFL and GCC thickness. Comparisons were considered significant when (p< 0.05) and highly significant when (p< 0.001).
Results
A total of 120 eyes of 60 participants were included in this study, 60 eyes of 30 heavy smokers as the study group (A) and 60 eyes of 30 non-smokers as the control group (B).
Demographics
Group A consisted of 22 males (73.3%) and 8 females (26.7%) with age ranging from 29 to 44 years, while the control group consisted of 20 males (66.7%) and 10 females (33.3%) with same age range.
No statistically significant differences regarding age, gen-der, visual acuity (VA), BCVA, refraction, IOP, AXL and CCT were found between the two groups (Table 1). Group (A) smoked an average of (36.0 ± 16.95) cigarettes daily with range between 15 and 60 cigarettes. The duration of smoking ranged between 10 and 31 years with mean of (18.0 ± 6.60) years (Table 2).
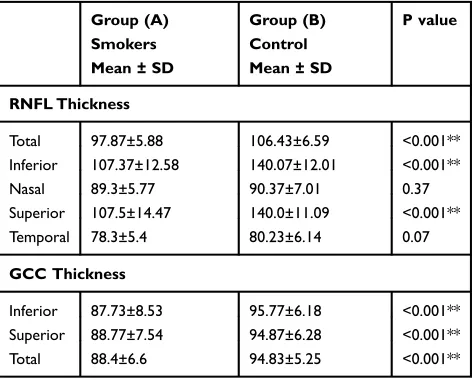
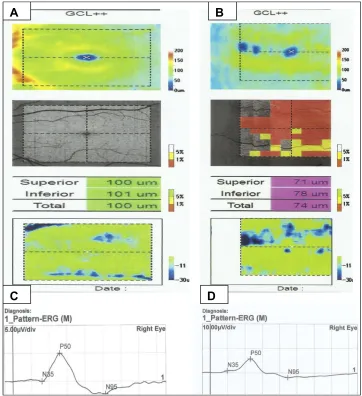
The mean RNFL values showed a statistically signifi -cant differences between the study and control groups (p<0.001). Furthermore, superior and inferior quadrants of RNFL were significantly thinner in the study group (p< 0.001 and p< 0.001) respectively, but no significant differences were found in temporal or nasal quadrants (p=0.07 and p=0.37 and) respectively (Table 3). Also, total GCC values were significantly thinner in the study (smokers) group in comparison to control group (p<0.001) (Table 3) (Figure 2). The reduction of GCC thickness was more in males (87.0 ±6.84 µm) than females (92.25 ± 3.96 µm) (p=0.005).
There was no significant difference of PERG-P50 amplitude (p = 0.49) or latency (p = 0.71). However, PERG-N95 amplitude and latency showed significant dif-ferences between smokers and non-smokers (p < 0.001) (Table 4). There were significant differences of phNR amplitude and latency between the two groups (p < 0.001) (Table 4).
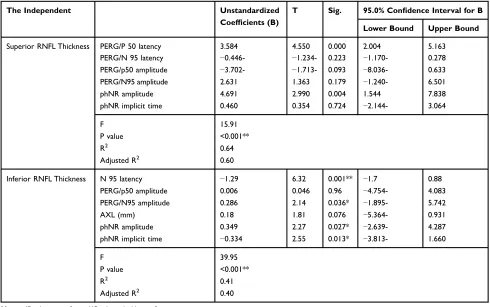
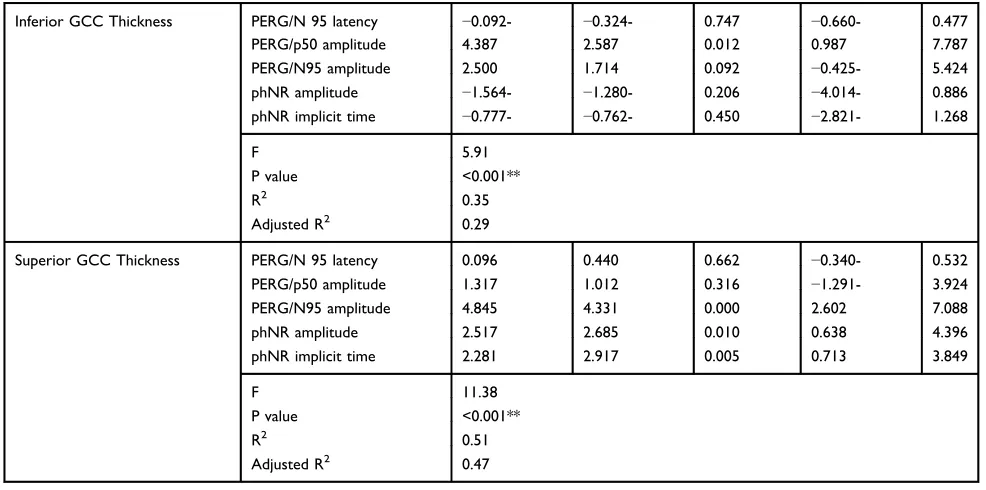
Significant negative correlation was found between superior, inferior RNFL & GCC thicknesses with PERG-N95 and PhNR latency (p<0.001) (Table 5). On the other hand, there was a significant positive correlation between them with PERG-N95 and PhNR amplitude (p< 0.001). Multiple regression analyses demonstrated that the PhNR, PERG amplitude and latency are the most influencing variables on RNFL and GCC thicknesses (Tables 6and7).
Discussion
Smoking has been known to increase the risk for several serious ocular diseases, such as dry eye, glaucoma, ARMD, Graves ophthalmopathy and cataract.14,15 Smoking causes high oxidative stress with release of the free radicals that produced by these oxidizing agents which lead to cell damage and death by apoptosis.16
Figure 1The PhNR amplitude calculation.
Clinical Ophthalmology downloaded from https://www.dovepress.com/ by 118.70.13.36 on 24-Aug-2020
Hepsen and Evereklioglu6demonstrated diminished ret-inal sensitivity in the visualfields of chronic heavy smokers. Tamaki et al17reported that heavy cigarette smoking reduce the blood stream tissue velocity and reduce the peripheral vessel dimensions in the choroid and optic nerve head. These
findings suggest that chronic smoking might influence the inner retinal layer and retinal ganglion cells.
This study was conducted to assess harmful effects of chronic heavy smoking on RNFL and GCC using multiple imaging modalities. We found that the average RNFL thickness was significantly thinner in heavy smokers than the control group. Sub-analysis showed that the significantly affected quadrants were the super-ior and infersuper-ior, while no significant differences were found in temporal or nasal quadrants between the two groups. These variations in the quadrants could be explained by the less structural support of axons in superior and inferior optic disc poles due to larger lamina cribrosa fenestrations in theses quadrants in comparison to nasal and temporal poles resulting in greater damage to ganglion cell axons in these areas.
These findings concur with the published data by Dervişoğulları et al,18 they demonstrated that the aver-age RNFL was significantly thinner in smokers com-pared with non-smokers. Also, measurements of superior and inferior quadrants were significantly reduced in smoker cases, with no significant changes in temporal or nasal quadrants. Demirci et al stated that cigarette smoking may cause significant reduction of RNFL thickness in migraine patients.19
Our results showed that GCC measurements of chronic smokers were much lower than that of non-smokers. This was in accordance with the outcomes reported by Moschos et al20 who demonstrated thinner GCC thickness in smo-kers. We also found that GCC thickness was more reduced in males than females (p=0.005). This may be due the higher rates of smoking in males than females.21 Further research are required to evaluate gender related differences regarding the effects of heavy smoking on ganglion cell layer.
Although El-Shazly et al22 concluded that total RNFL and GCC were not significantly influenced when they compared active and passive smokers, the sub-analysis of the quadrants showed that superior and inferior quadrants of RNFL were thinner in the active smokers than passive smokers, with no change in tem-poral or nasal quadrants. These findings were fairly similar to our results.
The reduction of the RNFL and GCC thickness could be explained by either direct neurotoxic impact on the optic nerve or the decreased blood stream because of the vasoconstrictive impact of nicotine.23
In the present study, PERG-P50 amplitude and latency did not show significant differences between both groups, while PERG-N95 demonstrated statistically significant
Table 1Demographics and Clinical Findings of the Whole Study
Population as Well as Comparison Between the Two Groups
Group (A) Smokers Mean ± SD
Group (B) Control Mean ± SD
P value
Gender n (%)
Male 22(73.3%) 20(66.7%) 0.57
Female 8(26.7%) 10(33.3%)
Age 36.67±4.13 36.0±4.76 0.56
V/A (logMAR) 0.053±0.05 0.03±0.046 0.01
BCVA(logMAR) 0.00 ± 0.00 0.00 ± 0.00
SE (dioptre) −0.07±0.63 −0.03±0.49 0.71
AXL (mm) 22.54±0.86 22.41±0.67 0.37
CCT (mm) 517.5±28.73 518.4±28.81 0.86
IOP (mmHg) 14.47±1.87 14.2±1.77 0.43
Abbreviations:VA = visual acuity; BCVA = best corrected visual acuity; SE = spherical equivalent; AXL = axial length; CCT = central corneal thickness; IOP = intra ocular pressure.
Table 2Description of Smoking Status of Study Group
Mean ± SD Range
Duration of smoking/year 18.0±6.60 10–31
No of cig/day 36.0±16.95 15–60
Table 3Comparison of the RNFL and GCC Thickness Between
Smokers and Non- Smokers Participants
Group (A) Smokers Mean ± SD
Group (B) Control Mean ± SD
P value
RNFL Thickness
Total 97.87±5.88 106.43±6.59 <0.001**
Inferior 107.37±12.58 140.07±12.01 <0.001**
Nasal 89.3±5.77 90.37±7.01 0.37
Superior 107.5±14.47 140.0±11.09 <0.001**
Temporal 78.3±5.4 80.23±6.14 0.07
GCC Thickness
Inferior 87.73±8.53 95.77±6.18 <0.001**
Superior 88.77±7.54 94.87±6.28 <0.001**
Total 88.4±6.6 94.83±5.25 <0.001**
Note:**P value is highly significant.
Abbreviations:RNFL = retinal nervefiber layer; GCC = ganglion cell complex.
Clinical Ophthalmology downloaded from https://www.dovepress.com/ by 118.70.13.36 on 24-Aug-2020
differences between the smokers and control groups. These results are comparable to studies by El-Shazly et al,22 Gűndogân et al24and Holder25which reported that smoking affects PERG amplitude and latency significantly in heavy smokers compared with non-smokers.
We also found significant reduction of phNR ampli-tude and prolonged latency in heavy smokers compared with control group.PERG-N95 and phNR are objective tests for ganglion cell functions.26,27 The phNR arises from the electrical activity of RGC and their axons, so it is a useful diagnostic tool for diseases affecting the inner retina and optic nerve such as glaucoma,28 how-ever the amount of research involving the phNR is insufficient.
In heavy smokers group we found a significant positive correlation between RNFL and GCC thickness with
A
B
C
D
Figure 2(A) Optical coherence tomography (OCT) of normal control:normal GCC thickness (B) OCT of chronic heavy smoker: there is reduction of GCC thickness (C) PERG of normal control: with normal amplitude and latency (D) PERG of chronic heavy smoker: with decreased amplitude and delay in latency.
Table 4Comparison of PERG and PhNR Parameters Between
Smokers and Non-Smoker Participants
Group (A) Smokers Mean ± SD
Group (B) Control Mean ± SD
P value
Pattern ERG(PERG)
P50 latency (ms) 50.56±1.61 50.45±1.53 0.71
N95 latency (ms) 107.39±6.22 94.8±3.21 <0.001**
P50 amplitude (μV) 4.10±0.83 4.2±0.69 0.49
N95 amplitude (μV) 2.96±1.09 5.74±0.92 <0.001**
Photopic Negative Response(PhNR)
PhNR amplitude(μV) 12.43±1.71 19.22±1.41 <0.001**
phNR implicit time(ms) 59.41±2.02 52.02±2.39 <0.001**
Note:**P value is highly significant.
Abbreviations: PERG = pattern electroretinogram; phNR = photopic negative response.
Clinical Ophthalmology downloaded from https://www.dovepress.com/ by 118.70.13.36 on 24-Aug-2020
PERG-N95 and PhNR amplitude, while the RNFL and GCC thickness were negatively correlated with PERG-N95 and PhNR latency. These outcomes may indicate that smoking affects mainly the RNFL and optic nerve.
One limitation of this study was the relatively small sample size. Further examinations and studies involving bigger numbers of samples are needed to measure the
influence of heavy smoking on different retinal parameters.
In conclusion, RNFL and GCC thickness decrease in chronic heavy smokers, the PhNR and PERG-N95 amplitudes were diminished and the implicit times were delayed in com-parison to non-smokers. PhNR and PERG reflect both dys-function and loss of ganglion cells and their axons.
Table 5Correlation Between RNFL, GCC Thickness with Other Variables
RNFL Thickness Smokers (60)
Superior Inferior Total Inferior GCC Superior GCC Total GCC
R P r P R P R P r P r P
PERG/P50 latency 0.43 0.001** 0.06 0.66 0.07 0.59 0.19 0.16 0.22 0.09 0.28 0.03
PERG/N95 latency −0.59 <0.001** −0.64 <0.001** −0.74 <0.001** −0.46 <0.001** −0.52 <0.001** 0.02 0.89
PERG/p50 amplitude 0.39 0.002** 0.44 <0.001** 0.63 <0.001** 0.48 <0.001** 0.50 <0.001** 0.02 0.90
PERG.N95 amplitude 0.47 <0.001** 0.59 <0.001** 0.53 <0.001** 0.49 <0.001** 0.59 <0.001** 0.22 0.099
AXL (mm) −0.17 0.19 −0.28 0.03 −0.26 0.045 −0.023 0.86 −0.04 0.76 −0.03 0.82
CCT (mm) −0.10 0.44 0.12 0.35 0.10 0.44 0.13 0.33 0.05 0.68 0.13 0.34
PhNR amplitude 0.69 <0.001** 0.63 <0.001** 0.67 <0.001** 0.36 0.005** 0.54 <0.001** −0.09 0.49
phNR implicit time −0.58 <0.001** −0.61 <0.001** −0.63 <0.001** −0.39 0.002** −0.39 0.002** −0.10 0.43
Note:**P value is highly significant.
Abbreviations:RNFL = retinal nervefiber layer; GCC = ganglion cell complex; PERG = pattern electroretinogram; phNR = photopic negative response; AXL = axial length; CCT = central corneal thickness.
Table 6Stepwise Linear Regression of Superior & Inferior RNFL Thickness with Other Variables
The Independent Unstandardized
Coefficients (B)
T Sig. 95.0% Confidence Interval for B
Lower Bound Upper Bound
Superior RNFL Thickness PERG/P 50 latency 3.584 4.550 0.000 2.004 5.163
PERG/N 95 latency −0.446- −1.234- 0.223 −1.170- 0.278
PERG/p50 amplitude −3.702- −1.713- 0.093 −8.036- 0.633
PERG/N95 amplitude 2.631 1.363 0.179 −1.240- 6.501
phNR amplitude 4.691 2.990 0.004 1.544 7.838
phNR implicit time 0.460 0.354 0.724 −2.144- 3.064
F 15.91
P value <0.001**
R2 0.64
Adjusted R2 0.60
Inferior RNFL Thickness N 95 latency −1.29 6.32 0.001** −1.7 0.88
PERG/p50 amplitude 0.006 0.046 0.96 −4.754- 4.083
PERG/N95 amplitude 0.286 2.14 0.036* −1.895- 5.742
AXL (mm) 0.18 1.81 0.076 −5.364- 0.931
phNR amplitude 0.349 2.27 0.027* −2.639- 4.287
phNR implicit time −0.334 2.55 0.013* −3.813- 1.660
F 39.95
P value <0.001**
R2 0.41
Adjusted R2 0.40
Notes:*P value is significant, **P value is highly significant.
Abbreviations:RNFL = retinal nervefiber layer; PERG = pattern electroretinogram; phNR = photopic negative response; AXL = axial length.
Clinical Ophthalmology downloaded from https://www.dovepress.com/ by 118.70.13.36 on 24-Aug-2020
Acknowledgments
The abstract of this paper was presented at the 57th Annual Symposium of the International Society for Clinical Electrophysiology of Vision (ISCEV 2019) Conference at Seoul/south Korea 5-10 Octobre as a poster presentation with interimfindings. The poster’s abstract was published in“Poster Abstracts”in Journal Documenta Ophthalmologica, Springer.
Disclosure
The authors report no conflicts of interest in this work.
References
1. Müezzinler A, Mons U, Gellert C, et al. Smoking and all-cause mortality in older adults: results from the CHANCES consortium.Am J Prev Med.
2015;49(5):e53–e63. doi:10.1016/j.amepre.2015.04.004
2. Solberg Y, Rosner M, Belkin M. The association between cigarette smoking and ocular diseases. Surv Ophthalmol. 1998;42:535–547. doi:10.1016/S0039-6257(98)00002-2
3. Asfar T, Lam BL, Lee DJ. Smoking causes blindness: time for eye care professionals to join thefight against tobacco.Invest Ophthalmol Vis Sci.2015;56(2):1120–1121. doi:10.1167/iovs.15-16479
4. Kolar P Risk factors for central and branch retinal vein occlusion: a meta-analysis of published clinical data.J Ophthalmol.2014;2014:5. doi: 10.1155/2014/724780.724780
5. Grzybowski A, Holder GE. Tobacco optic neuropathy(TON)–the historical and present concept of the disease.Acta Ophthalmol (Copenh).2011;89 (5):495–499. doi:10.1111/j.1755-3768.2009.01853.x
6. Hepsen IF, Evereklioglu C. Defective visual field tests in chronic heavy smokers. Acta Ophthalmol Scand. 2001;79(1):53–56. doi:10.1034/j.1600-0420.2001.079001053.x
7. Mwanza JC, Budenz DL, Godfrey DG, Carter R, Crandall AS. Diagnostic performance of optical coherence tomography ganglion cell inner plexi-form layer thickness measurements in early glaucoma.Ophthalmology.
2012;119(6):1151–1158. doi:10.1016/j.ophtha.2011.12.014
8. Akamine T, Nishimura Y, Ito K, Uji Y, Yamamoto T. Effects of haloperidol on K(+) currents in acutely isolated rat retinal ganglion cells.Invest Ophthalmol Visual Sci.2002;43(4):1257–1261. 9. Holder GE. Pattern electroretinography(PERG) and an integrated
approach to visual pathway diagnosis.progress in retinal and eye research. Prog Retinal Eye Res. 2001;20(4):531–561. doi:10.1016/ s1350-9462(00)00030-6
10. Kim HD, Park JY, Ohn Y-H. Clinical applications of photopic negative response (PhNR) for the treatment of glaucoma and diabetic retinopathy. Korean J Ophthalmol.2010;24(2):89–95. doi:10.3341/kjo.2010.24.2.89 11. Frishman L, Sustar M, Kremers J. ISCEV extended protocol for the photopic negative response (PhNR) of the full-field electroretinogram. Doc Ophthalmol. 2018;136(3):207–211. doi:10.1007/s10633-018-9638-x
12. Ventura LM, Sorokac N, De Los Santos R, et al. The relationship between retinal ganglion cell function and retinal nerve fiber thickness in early glaucoma. Invest Ophthalmol Vis Sci.
2006;47:3904–3911. doi:10.1167/iovs.06-0161
13. Bach M, Brigell MG, Hawlina M, et al. ISCEV standard for clinical pattern electroretinography (PERG): 2012 update.Doc Ophthalmol.
2013;126(1):1–7. doi:10.1007/s10633-012-9353-y
14. Cheng ACK, Pang CP, Leung ATS, Chua JKH, Fan DSP, Lam DSC. The association between cigarette smoking and ocular diseases. HKMJ.2000;6:195–2022.
15. Morgan RW, Drance SM. Chronic open-angle glaucoma and ocular hypertension: an epidemiology study. Br J Ophthalmol.
1975;59:211–2153. doi:10.1136/bjo.59.4.211
16. Bertram KM, Baglole CJ, Phipps RP, Libby RT. Molecular regulation of cigarette smoke induced-oxidative stress in human retinal pigment epithelial cells: implications for age-related macular degeneration. Am J Physiol Cell Physiol. 2009;297:C1200–C1210. doi:10.1152/ ajpcell.00126.2009
Table 7Stepwise Linear Regression of Superior & Inferior GCC Thickness with Other Variables
Inferior GCC Thickness PERG/N 95 latency −0.092- −0.324- 0.747 −0.660- 0.477
PERG/p50 amplitude 4.387 2.587 0.012 0.987 7.787
PERG/N95 amplitude 2.500 1.714 0.092 −0.425- 5.424
phNR amplitude −1.564- −1.280- 0.206 −4.014- 0.886
phNR implicit time −0.777- −0.762- 0.450 −2.821- 1.268
F 5.91
P value <0.001**
R2 0.35
Adjusted R2 0.29
Superior GCC Thickness PERG/N 95 latency 0.096 0.440 0.662 −0.340- 0.532
PERG/p50 amplitude 1.317 1.012 0.316 −1.291- 3.924
PERG/N95 amplitude 4.845 4.331 0.000 2.602 7.088
phNR amplitude 2.517 2.685 0.010 0.638 4.396
phNR implicit time 2.281 2.917 0.005 0.713 3.849
F 11.38
P value <0.001**
R2 0.51
Adjusted R2 0.47
Note:**P value is highly significant.
Abbreviations:GCC = ganglion cell complex; PERG = pattern electroretinogram; phNR = photopic negative response.
Clinical Ophthalmology downloaded from https://www.dovepress.com/ by 118.70.13.36 on 24-Aug-2020
17. Tamaki Y, Araie M, Nagahara M, Tomita K, Matsubara M. The acute effects of cigarettes smoking on human optic nerve head and poster-ior fundus circulation in light smokers.Eye.2000;14(Part 1):67–72. doi:10.1038/eye.2000.15
18. DervişoğullarıMS, Totan Y, Tenlik A, Yüce A, Güler E. Effect of smoking on retina nervefiber layer and ganglion cell-inner plexiform layer complex. Cutan Ocul Toxicol. 2015;34(4):282–285. doi:10.3109/15569527.2014.975240
19. Demirci S, Gunes A, Demirci S, Kutluhan S, Tok L, Tok O. The effect of cigarette smoking on retinal nervefiber layer thickness in patients with migraine.Cutan Ocul Toxicol.2015;1–5. doi:10.3109/ 15569527.2014.1003935
20. Moschos MM, Nitoda E, Laios K, Ladas DS, Chatziralli IP. The impact of chronic tobacco smoking on retinal and choroidal thickness in Greek population.Oxid Med Cell Longev.2016;2016:2905789. 21. Chinwong D, Mookmanee N, Chongpornchai J, Chinwong S.
A comparison of gender differences in smoking behaviors, intention to quit, and nicotine dependence among thai university students. J Addict.2018;37:739–742. Article ID 8081670.
22. El-Shazly AA, Farweez YAT, Elewa LS, Elzankalony YA, Farweez BAT. Effect of active and passive smoking on retinal nerve fibre layer and ganglion cell complex. J Ophthalmol.
2017;10. doi: 10.1155/2017/6354025. Article ID 6354025.
23. Langhans M, Michelson G, Groh MJ. Effect of breathing 100% oxygen on retinal and optic nerve head capillary blood flow in smokers and non-smokers.Br J Ophthalmol.1997;l81(5):365–369. doi:10.1136/bjo.81.5.365
24. Gundogan FC, Durukan AH, Mumcuoglu T, Sobacı G, Bayraktar MZ. Acute effects of cigarette smoking on pattern electroretinogram. Doc Ophthalmol. 2006;113(2):115–1217. doi:10.1007/s10633-006-9021-1
25. Holder GE. The pattern electroretinogram. In: Heckenlively JR, Arden GB, editors.Principles and Practice of Clinical Electrophysiology of Vision. Cambridge: MIT Press;2006:341–352.
26. Luo X, Frishman LJ. Retinal pathway origins of the pattern electro-retinogram (PERG).Invest Ophthalmol Vis Sci.2011;52:8571–8584. doi:10.1167/iovs.11-8376
27. Viswanathan S, Frishman LJ, Robson JG, Walters JW. The photopic negative response of the flash electroretinogram in primary open angle glaucoma.Invest Ophthalmol Vis Sci.2001;42:514–522. 28. Rangaswamy NV, Shirato S, Kaneko M, Digby BI, Robson JG,
Frishman LJ. Effects of spectral characteristics of Ganzfeld stimuli on the photopic negative response (PhNR) of the ERG. Invest Ophthalmol Vis Sci.2007;48:4818–4828. doi:10.1167/iovs.07-0218
Clinical Ophthalmology
Dovepress
Publish your work in this journal
Clinical Ophthalmology is an international, peer-reviewed journal cover-ing all subspecialties within ophthalmology. Key topics include: Optometry; Visual science; Pharmacology and drug therapy in eye dis-eases; Basic Sciences; Primary and Secondary eye care; Patient Safety and Quality of Care Improvements. This journal is indexed on PubMed
Central and CAS, and is the official journal of The Society of Clinical Ophthalmology (SCO). The manuscript management system is completely online and includes a very quick and fair peer-review system, which is all easy to use. Visit http://www.dovepress.com/ testimonials.php to read real quotes from published authors.
Submit your manuscript here:https://www.dovepress.com/clinical-ophthalmology-journal
Clinical Ophthalmology downloaded from https://www.dovepress.com/ by 118.70.13.36 on 24-Aug-2020