IJEDR1302015 INTERNATIONAL JOURNAL OF ENGINEERING DEVELOPMENT AND RESEARCH | IJEDR Website: www.ijedr.org | Email ID: [email protected] 72
Mathematical Modeling of Disc Type Winding of
Power Transformer
Sandeep Patel
M Tech scholar
Sagar institute of research and technology Bhopal
Prof. D. KOLI Associate Professor
Sagar institute of research and technology Bhopal
Abstract- In order to achieve this network modeling method was studied and network model for the said winding type was understood. A MATLAB programme was written with top down approach to solve hydraulic and thermal network of the said winding. A simplified heat conduction model was developed and implemented in MATLAB code for prediction of hot spot in a conductor of a disc. The coupled thermo-hydraulic network model studied was then implemented in a simple MATLAB code that used functions to solve hydraulic network, thermal network and conductor heat conduction model.
Keyword - Transformer winding, Mathematical model, CFD, Network modelling, MATLAB code.
I. INTRODUCTION
A device was designed and perfected over several decades in 19th century by several of European and American engineers that used principals of electromagnetic induction for voltage manipulations. It was called Transformer. By the end of 19th century 3 phase transformers had came to existence in its form that is used till date. A power transformer is the electrical device which is used to change the voltage of AC in power transmission system. The first transformer in the world was invented in 1840s. Modern large and medium power transformers consist of oil tank with oil filling in it, the cooling equipment on the tank wall and the active part inside the tank. As the key part of a transformer, the active part consists of 2 main components: the set of coils or windings (at least comprising a low voltage, high voltage and a regulating winding) and the iron core. For a step-up transformer, the primary coil is low voltage (LV) input and the secondary coil is high voltage (HV) output. The situation is opposite for a step-down transformer. The iron core is the part inducing the varying magnitude flux. Nowadays, transformers play key roles in long distance high-voltage power transmission.
II. NETWORK MODELING AND DEVELOPMENT OF MATLAB CODE
Methodology
The methodology implemented in aforementioned research paper authored by Oliver A.J. (1980) [8]is described in following section
Fig.1.1 Simple network diagram
A collection of interconnecting flow paths or ducts can be represented on the network diagram of the type shown in Figure 1.1 Each element of the network represents a single path with the nodes usually being placed at the junctions. In the model, values of the pressure and bulk temperature are determined for each node. Values of fluid velocity and average wall temperature are determined for each path. If the temperature varies significantly along a path, then that path could be split into several elements in order to calculate this variation.
The required values of pressure, bulk temperature, fluid velocity and wall temperature are obtained by solving the set of equations which can be obtained from the following:
a. conservation of mass applied to each node
b. conservation of thermal energy applied to each node c. pressure-drop equation applied to each path
d. heat-transfer equation applied to each path.
The actual equations and the method of solution are discussed in later section.
Solution Procedure
The following assumptions were made in deriving the equations:
Flow in ducts is assumed 1D laminar (Re < 200) Oil is completely mixed at junction i.e. all branches
leaving node have same Thermodynamic state. Hydraulically developed boundary layer i.e. uniform
velocity along length of duct
Pure convective heat transfer with developing thermal boundary layer i.e. linearly increasing temperature profile along length of duct
IJEDR1302015 INTERNATIONAL JOURNAL OF ENGINEERING DEVELOPMENT AND RESEARCH | IJEDR Website: www.ijedr.org | Email ID: [email protected] 73 The set of equations which are obtained from (a) to (d) in
preceding Section are given below.
Application of the conservation of mass to a node i, see Figure 1.1, gives
∑
∑ ̇
where,∑ represents all the paths which connect nodes j to node i. Where is connection matrix for flow network. Its value is,
+1 if flow is from node j to i -1 if flow is from node i to j 0 if node j and i are not connected
∑ allows for more than one path between a node i and a node j. The case of l > 1 can be handled by the solution procedure, but to simplify the equations it will be assumed for the rest of this Section that two nodes i and j are directly connected by only one path (i.e. l = 1). In this case eqn. 4.1 reduces to
∑
̇
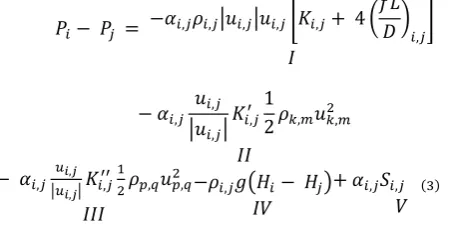
The pressure drop equation for a path (i, j) joining nodes i and j can be expressed as
| | * (
)
+
| |
| |
( )
where term I represents the losses which are related to the
velocity head, for example friction; terms II and III are the losses which are proportional to the velocity head in another pipe, these could occur at junctions; term IV represents the gravitational head; term V allows for any pressure sources (pumps) or sink.
These equations form a complete set for the network considered. Their solution provides values of pressure, Pi, and bulk temperature (tb)i at each node and values of velocity, ui,j, and mean wall temperature (tw)i,j for each duct.
Friction Facto
CFD calibrated correlation for friction factor is given formulated in aforementioned research paper authored by Wu W. et al. (2012) [21] is given below.
*
( )
( )
+
Junction Pressure Loss Coefficient:
Coefficients of equation for the junction pressure loss equations in Tee junction presented in research paper authored by Jamison were corrected using CFD. The corrected correlations are as follows:
For Junction Pressure Loss in confluence,
Where a is 1 or 2
( ̇ ̇ )
( ̇ ̇ ) {
( ) ( ⁄ ) } ̇
̇ ( ̇
̇ )
( ̇ ̇ ) ( ̇
̇ ) {(
) ( ⁄ )}
( ̇
̇ ) ( ) ̇
̇ ( ̇
̇ )
The notation used to identify each branch at junction in equations of junction pressure losses is given shown in fig. 1.2
IJEDR1302015 INTERNATIONAL JOURNAL OF ENGINEERING DEVELOPMENT AND RESEARCH | IJEDR Website: www.ijedr.org | Email ID: [email protected] 74 Heat transfer in rectangular duct with laminar oil flow regime
was studied by CFD and Nusselt corrected Nusselt number equation was presented as follows.
( ⁄ )
( )
Boundary values
For any flow network problem, a pressure must be specified at one node at least. Furthermore for a node i with a mass source it is necessary to either
(i) specify ̇ and (tb)i or
(ii) specify Pi and (tb)i
and for a node j with a mass sink then either (iii) specify ̇
or
(iv) specify Pj
For winding network condition (i) and (iv) were used
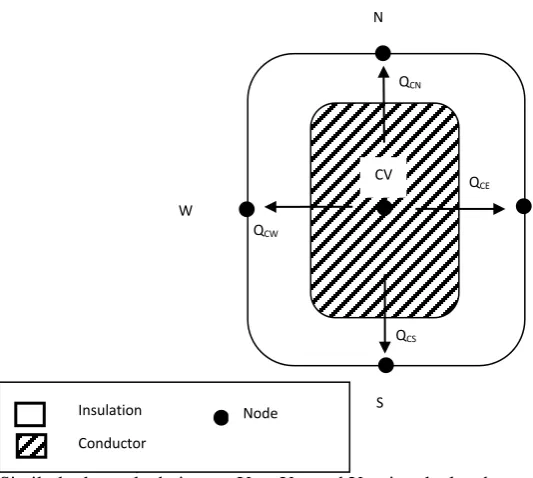
Fig. shows vertical section of the disc with as many conductors as there are turns in the disc. In a disc Heat is generated at every location along the length of conductor cable but heat dissipation to transformer oil takes place only from top and bottom surfaces as well as inner and outer walls on circumference of disc. Heat conduction along the length of conductor that is in circumferential direction is assumed to be negligible. Fig. shows enlarged view of individual conductor section and its heat interactions at boundary.
Node C represent the shaded region which is cross section of conductor. Node N, E, S and W represent the top, right, bottom and left wall of conductor-insulation cross section respectively. Qgen,c is rate of heat generation at the Node C in W/m. The Heat generated dissipates through 4 walls at the boundary of conductor-insulation section by conduction. Thus QCN, QCE, QCS and QCW represent conductive heat transfer from Node C to Node N, E, S and W respectively.
Thus from conservation of energy,
Conduction heat transfer between Node C an N can be represented by,
Where YCW is thermal admittance of composite section of conductor and insulation material between Node C and Node ES.
TC is conductor temperature and TE is temperature of corresponding wall.
Thus
( ( )
)
(( )
)
Where Kins. and Kcond. are thermal conductivity of insulation and conductor material respectively.
Dimensions dc, dp and b are defined
Similarly thermal admittance YCN, YCS and YCW is calculated. By substituting Eq. 3.16 in 3.15,
To solve Equation for conductor temperature TC; TN, TE, TS and TW should be known in priory. In the analysis of winding network disc wall temperatures are obtained as mentioned in 'Methodology'. Thus for all conductors in a disc temperature at Node N and S is known but temperature at nodes E and W are unknown except for end conductors where temperature of one more node is known which is in contact with oil duct. In order to eliminate the unknown terms in equation conservation of energy is applied to Node on wall of conductor interfacing conductor 1 and 2.
Hence,
Where X is W or E
Since all conductor-insulation sections are identical Hence
Substituted in equation for n conductors in a disc. The set of equation is expressed as,
{∑ ∑
( )
}
[∑ { ( ) ( )}] [∑ { ( ) ( )}]
∑ Where k is {N, S, E, W}
βpk is 0 if temperature at node k of conductor p is unknown and 1 if otherwise
γpk ,
is +1 if conductor p shares node k with conductor p+1 is -1 if conductor p shares node k with conductor p-1 is 0 otherwise
CV
E N
W
S Insulation
Conductor
Node QCW
QCE
QCN
IJEDR1302015 INTERNATIONAL JOURNAL OF ENGINEERING DEVELOPMENT AND RESEARCH | IJEDR Website: www.ijedr.org | Email ID: [email protected] 75 Dimensions of investigated geometry, material properties
and excitation condition
The pass example is from a disc-type winding and the studied section is between two neighbouring spacers, as shown in Fig. 1.4.
Fig. 1.4 Studied Section of Winding Geometry
There are 8 discs in the pass; they are cooled with oil which flows in from the bottom inlet, through horizontal channels between the rows of 'heat generating' discs, and joins up with a single vertical channel at the opposite side that carries the oil upwards and through a gap to next pass. The next pass starts from the oil block washer equipped just below the 9th disc; all washers are assumed as fully tight.
Comparison of results
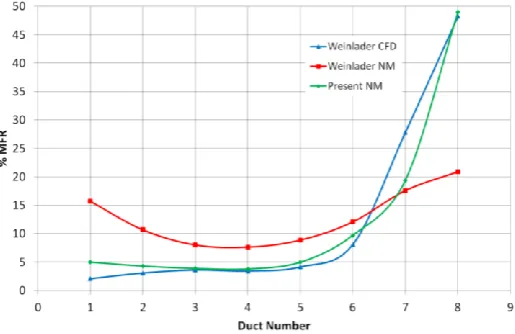
The results for oil flow distribution in studied winding pass in research paper authored by Weinlader A. et al. (2012) [24] are presented in graphical form. Mass flow rate in each horizontal duct of pass is normalized as follows.
Ducts are numbered from bottom to top.
Fig. 1.5, 1.6 and 1.7 compares % MFR in ducts predicted by case 1, 2 and present network model for inlet oil flow rate of 2 lit/min, 10 lit/min and 20 lit/min respectively. The comparison for inlet mass flow rate of 5 lit/min and 15 lit/min is not shown here.
Fig. 1.5 Comparison of %MFR vs Duct number for 2 lit/min.
Fig. 1.6 Comparison of %MFR vs Duct number for 10 lit/min.
Fig. 1.6 Comparison of %MFR vs Duct number for 20 lit/min. CONCLUSION
Use of CFD in the analysis of cooling duct design of disc type winding with oil guiding washers yields thorough understanding of heat interactions and flow patterns of oil in winding but it requires high computational efforts. Network modeling is developed and used for transformer in thermal analysis of disc type winding since 1980s' which is well balanced between calculation speed and accuracy of results. To obtain general idea of flow pattern and fair estimates of temperature distribution in winding development of
Disc
Space r
IJEDR1302015 INTERNATIONAL JOURNAL OF ENGINEERING DEVELOPMENT AND RESEARCH | IJEDR Website: www.ijedr.org | Email ID: [email protected] 76 mathematical tool based on network modeling was summoned
in Crompton Greaves Ltd which is one of the major international manufacturers of power transformer.
REFERENCES
[1] Zhang J. and Li X., "Coolant flow distribution and pressure loss in ONAN transformer windings. Part I: Theory and model development," Power Delivery, IEEE Transactions on, vol. 19, no. 1, pp. 186-193, 2004. [2] Zhang J. and Li X., "Coolant flow distribution and
pressure loss in ONAN transformer windings. Part II: Optimization of design parameters," Power Delivery, IEEE Transactions on, vol. 19, no. 1, pp. 194-199, 2004. [3] Rahimpour E., Barati M., and Schefer M., "An
investigation of parameters affecting the temperature rise in windings with zigzag cooling flow path," Applied Thermal Engineering, vol. 27, no. 11-12, pp. 1923-1930, 2007.
[4] Radakovic Z.R. and Sorgic M.S., "Oil forced versus oil directed cooling of power transformers," Power Delivery, IEEE Transactions on, vol. 25, no. 4, pp. 2590-2598, 2010.
[5] Weinläder A., Wu W., Tenbohlen S. and Wang Z.D., “Prediction of the Oil Flow Distribution in Oil-immersed Transformer Windings by Network Modelling and CFD” IET Electric Power Applications, Vol. 6, No. 2, pp. 82-90, 2012.
[6] Jiao Y., "CFD Study On The Thermal Performance of Transformer Disc Winding Without Oil Guides ", Master of science Thesis, KTH School of Industrial Engineering and Management Energy Technology,2012.
[7] Del Robert M., Poulin Bertrand, Feghali Pierre T., Shah Dilipkumar M., and Ahuja Rajendra, “Transformer Design Principles: With Applications to Core-Form Power Transformers”. Gordon and Breach Science Publishers, 2001.
[8] W.J. McNutt, "Insulation thermal life considerations for transformer loading guides," Power Delivery, IEEE Transactions on, vol. 7, no. 1, pp. 392-401,1992.
[9] Rosenhow W. M., Hartnett J. P., "Handbook of heat transfer", McGrow-Hill, 1973.
[10] Wu W., Wang Z.D., Revell A., Iacovides H. and Jarman P., “CFD calibration for network modelling of transformer cooling oil flows – Part I heat transfer in oil ducts” IET Electric Power Applications, Vol. 6, No. 1, pp. 20-27, 2012.
[11] Wu W., Wang Z.D., Revell A. and Jarman P., “CFD Calibration for Network Modelling of Transformer Cooling Flows – Part II Pressure Loss at Junction Nodes” IET Electric Power Applications,Vol. 6, No. 1, pp. 28-34, 2012.
[12] Weinläder A., Wu W., Tenbohlen S. and Wang Z.D., “Prediction of the Oil Flow Distribution in Oil-immersed Transformer Windings by Network Modelling and CFD” IET Electric Power Applications, Vol. 6, No. 2, pp. 82-90, 2012.
[13] 'Developments in thermal modeling of transformer', CIGRE WG A2.38, 2008.
[14] Paramane S., Veken W., "Effect of modeling methods on temperature distribution in disc type transformer winding using computational fluid dynamics", Proc. 5th Int. Large