R E S E A R C H
Open Access
Optimizing end user QoS in heterogeneous
network environments using reputation and
prediction
David Giacomini
*and Anjali Agarwal
Abstract
Telecommunication consumers are fueling a demand for mobile devices that are rapidly increasing in their capability to provide a wider range of services. These services in turn are consuming more bandwidth and require richer quality of service (QoS) in order to ensure a good end user experience when performing activities such as streaming video content or facilitating voice over IP. As a result, network providers are expanding and improving their coverage area while technology to establish Wi-Fi hotspots is becoming more accessible to every day users. This combination of increase in demand and accessibility, coupled with users' ever-increasing expectations for high quality service presents a growing need to seamlessly optimize the use of the overlaid heterogeneous networks in urban areas to maximize the end user experience via the use of a vertical handover mechanism (VHO). Grey systems theory has been used in a wide range of systems including economic, financial, transportation, and military to accurately forecast time series based on limited information. In this paper, we build on a novel reputation-based VHO decision rating system by proposing the use of the grey model first-order one variable, GM(1,1), in the handover decision making progress. The low complexity of the GM(1,1) model allows for a quick and efficient prediction of the future reputation score for a given network, providing deeper insight into the current state of the target network. Furthermore, simulations show that the proposed model, in comparison with the original reputation model, improves the decision capability of a mobile node and helps balance the load across the heterogeneous networks employing its strategy.
Keywords:Vertical handover (VHO); Heterogeneous networks; Decision; Reputation; Grey model; Grey forecasting; Quality of service (QoS)
1 Introduction
Large metropolitan cities are increasingly forming eco-systems for overlaid heterogeneous networks via the co-existence of 3G/4G networks, Wi-Fi hotspots, and WiMAX networks to name a few. Furthermore, mobile devices accessing these networks are exponentially growing in their ability to consume services which are bandwidth and latency intensive, such as video stream-ing and video chattstream-ing. In order to optimize the end user's experience while navigating through this abun-dance of distinct network access points, the IEEE 802.21 standard [1] was defined, providing a framework for the identification and solicitation of new networks
and the mechanism for the actual handover between networks. A key aspect of the vertical handover (VHO) solution which is not covered by this standard is the decision making algorithm itself, which has been the focus of much debate and in which a variety of pro-posals have been put forth.
In the literature, three general categories of decision making solutions can be observed: solutions based on network conditions, multiple attribute algorithms, and artificial intelligence. In network condition-based solu-tions, the typical examples leverage the receiver signal strength (RSS) or the signal-to-interference-and-noise ratio (SINR) measured by the mobile node. In [2], the latter was analyzed in relation to the RSS of the mobile node, yielding an overall higher throughput experienced by the mobile node user. The drawback with using the * Correspondence:[email protected]
Electrical and Computer Engineering Department, Concordia University, Montreal, Quebec H3G 2W1, Canada
network condition approach, as indicated in [3], is that this results in an inefficient power solution as the mo-bile node must keep both interfaces active in order to measure when the conditions are right to perform the VHO. Furthermore, the quality of service (QoS) extrap-olated from the target network by the mobile is not ne-cessarily accurate as there is no understanding of the current load or resource utilization.
In multiple attribute solutions, the authors improve upon the QoS perceived by the mobile node in the net-work selection process through the use of multiple attri-bute decision maker (MADM) algorithms which leverage multiple network conditions and performance metrics. In [4], this was accomplished using the analytical hierarchical process (AHP) to assign weights against the alternative networks in relation to the current network, and tech-nique for order preference by similarity to an ideal solu-tion (TOPSIS) was employed to select the best opsolu-tion. In this experiment, criteria such as cost per byte, total band-width, allotted bandband-width, utilization, delay, jitter, and packet loss were used to assess the QoS. In comparison with the network condition approach, this method per-forms much better, but the solution to implement it is much more complex. As a result, this could yield higher delays as the mobile node requires more time to process the algorithms necessary to make the decision, as was ob-served in [5].
The most popular implementations of VHO decision algorithms using artificial intelligence (AI) are through the use of fuzzy logic or neural networks. In [6], the au-thors use fuzzy logic in association with a TOPSIS MADM model. In order to make a decision which opti-mizes the QoS experienced by the user, the TOPSIS model uses resource availability, RSS, mobile node speed, network type, network link business cost, and security as criteria in the analysis. In comparing this technique to the network-condition based solutions, a significant perform-ance gain is seen with the tradeoff resulting in an in-creased handover delay due to the high complexity of the solution [5].
Through the review of the literature, a novel handover mechanism using reputation scores was observed in the work from Zekri et al. in [7]. In this paper, we build on this scheme by leveraging the grey model first-order one variable (GM(1,1)) prediction algorithm, first proposed in [8] by treating these network scores, which represent the overall QoS of the network, as input into the predic-tion model. Through using this algorithm, we anticipate that the mobile node will be able to better judge whether the target network is more desirable than the current based on the latest trend in offered QoS and that the heterogeneous ecosystem of networks should be able to better balance the traffic across the networks. In Section 2, the theory relevant to the reputation model and the
GM(1,1) process is discussed. In Section 3, the details on how the GM(1,1) algorithm is used in conjunction with the reputation model are presented. Subsequently, Section 4 covers the simulation and network configur-ation for the experiments, and Section 5 reviews the simulation results. Finally, the conclusion is presented in Section 6.
2 Related theory
2.1 VHO using network reputation
In order to minimize the computations calculated by the mobile node in the actual decision process, a novel ap-proach was proposed in [7] for a UMTS and WLAN overlaid network. This work serves as the basis of our proposed implementation and as such the theory is reviewed here in detail. The key aspect of this system is that the majority of complex calculations required to fa-cilitate the decision are carried out prior to the actual decision point. This is enabled by defining two types of agents in the overlaid network:
Mobile reputation agent: Each mobile node in the ecosystem has a reputation agent. The purpose of these agents is to collect real-time performance metrics upon entering and leaving the respective network in order to calculate sample reputation scores. The reputation score is evaluated as either good or bad and then sent to the network reputa-tion agent for aggregareputa-tion. Furthermore, this agent coordinates in obtaining the current network scores from the target and current network for decision evaluation.
Network reputation agent: Each distinct network in the ecosystem has one network reputation agent. The purpose of this agent is to aggregate scores received by all the mobile nodes utilizing its associated network and to provide the current aggregate score upon request.
In light of the above, the initial question which comes
to mind is ‘How does one determine whether the score
In building the score, a specific weight is assigned to each QoS performance metric, depending on the applic-able CoS in question through the use of the AHP. Spe-cifically, each QoS metric is correlated to a goal of a CoS; subsequently, through the use of the fundamental 1 to 9 AHP scale to denote relative importance [9], the goals are prioritized in relation to each other within a CoS. Assume pij is the prioritization of Goal i, Gi, in
Based on the above comparisons, the AHP matrix is established and normalized, as can be seen generically across any CoS in Table 1. The normalized values, pij,
are then used in [8] to calculate the weight,Wi,
associ-ated to a QoS parameter in a given CoS as
Wi¼pi1þpi2þpi3þpi4
4 : ð1Þ
Once the weights have been defined, the additional preparatory step required for calculation of the scores is to define normalization factors,XminorXmax, for each of the performance metrics and within each CoS in order to ensure that the inherent value of the QoS parameter does not drive the score. This can be readily seen when considering that the raw value of jitter is typically in the order of one thousandth, whereas bandwidth can be on the order of one million. The normalizing factor will
then be applied to the raw metric, Xraw, based on the
interpreted worth or cost of the parameter in order to obtainXnorm, the normalized value. As discussed in [7], if the parameter is valued more, the lower it becomes, as is the case for jitter, delay, and bit error rate, then the normalizing equation can be seen by (2). Otherwise, if
the higher value has more worth, as in the case of band-width, the normalizing equation is described by (3)
Xnorm¼Xmin
Now, with both the weights and the normalizing
fac-tors defined for each QoS performance metric, the Qth
for a given CoS, ci, can then be calculated (as
demon-strated in [7]) by normalizing the threshold value of the metric and CoS in question, and applying the corre-sponding weight, as seen in (4):
Qthð Þ ¼ci Wberð Þci
Similarly, in [7], the actual sample reputation score,Qn (ci), is calculated by the mobile node upon entering or
leaving a given network in the same fashion as the Qth. The only difference here being that the sample perform-ance metric obtained by the mobile node is normalized instead of the threshold value, as can be seen in (5):
Qnð Þ ¼ci Wberð Þci berminð Þci
Once the sample reputation score is calculated, it is compared against the threshold value obtained in (4) and ranked as either good or bad. The ranked score is then sent to the corresponding network-residing agent for aggregation. It is important to note that in [7], the network agent is modeled as processing multiple re-ceived scores within a given interval. Furthermore, the network-residing agent can allocate a separate weight for favorable vs. unfavorable scores,w+orw−, as seen in (6), in order to give more importance to poor network be-havior since this is typically of the most concern [7].
rsampleð Þ ¼t wþ
∑
rþðm;nÞ þw−∑
r−ðm;nÞ: ð6ÞIn addition to putting emphasis on the negative scores, the network-residing agent also places greater import-ance on the recently received scores in [7] via the use of a discounting factor, γ ϵ[0, 1]. This discount is applied against the summed and weighted new score in (6) and
Table 1 Normalized AHP matrix generalized for a class of service [7]
CoSi BER Delay Jitter BW
BER 1 p12 p13 p14
Delay 1/p12 1 p23 p24
Jitter 1/p13 1/p23 1 p34
then combined with the current network score to form the running aggregate score as seen in (7)
r
aggrð Þ¼
t
The running aggregate score raggr(t) is then provided by the network agent upon request from other mobile agents to facilitate handover.
2.2 GM(1,1) model
Grey system theory-based models were first introduced by Deng in [8], and since then, they have been used in numerous industries, with their multiple deviations emerging. These variations include the grey Verhulst model, which is beneficial in S-curve response systems [9], and grey residual error correction models, which le-verage Fourier series and other feedback mechanisms for systems requiring error correction [10]. The key benefit of the grey system is that only a minimum data set is re-quired to predict an accurate future value. The simplest and most popular implementation of this theory, which is utilized in this paper, is the grey model first-order one variable model, GM(1,1). This implementation of the grey system must have an input sequence that contains only positive values. In order to model this, letX(0)
rep-resent a time series with n values, which is to be
ana-lyzed for prediction
Xð Þ0 ¼ xð Þ0ð Þ1 ; xð Þ0ð Þ2 ;…;xð Þ0ð Þn
; n≥4: ð8Þ
This time sequence is then applied to an accumulation generation operation (AGO) function in order to buildX(1) and smoothen the randomness of the original values. This new sequence can be observed in (10) to be constantly growing
Subsequently, the AGO-generated sequence is then used to define a mean sequence of adjacent data,Z(1), as follows:
Zð Þ1 ¼ zð Þ1ð Þ1 ; zð Þ1ð Þ2 ;…;
From Deng's work in [8], it can be shown that the AGO-generated sequence can be modeled by the
first-order differential equation (also known as the whitening equation) in
dxð Þ1ð Þt
dt þax
1
ð Þð Þ ¼t b; ð13Þ
whereaandbare referred to as the development coefficient and grey input, respectively. Intuitively, from (10), one can also deduce that
As a result, by substituting (10), (12), and (14) into (13), one can obtain the grey differential equation:
xð Þ0ð Þ þk azð Þ1ð Þ ¼k b: ð15Þ
In order to solve Equation (15), one must obtain the solution for theaandbparameters. This can be achieved through the use of the least square error method as follows:
Once [a, b] is solved and knowing that the initial con-dition is x(1)(0) =x(0)(1), the solution to the first-order
where xp(1) is the AGO-generated value at the predicted time k+ 1. As such, in order to determine the predicted value atk+ 1, the inverse AGO is applied against (19) in order to obtain
3 Proposed model: VHO using network reputation and GM(1,1) predictions
Numerous approaches have been reviewed in the pursuit of facilitating a VHO decision module that results in not only minimal delay during the handover process but also making a choice that provides the most benefit to the applications currently in use by the mobile device. As a result, in order to improve upon the novel approach presented in [7] without impacting the efficiency of the decision making duration, the network calculated ag-gregate scores are used as an input into the GM(1,1) al-gorithm to predict the trend in which the network performance is heading. The purpose of this enhancement is to provide advance knowledge of the state of the net-work to the mobile node so that they can make a more in-formed decision.
In building the proposed model, several other modifi-cations were made to the original model proposed in [7]. First, in reviewing (5) and (6), it can also be noted that theQn(ci) calculated value provides a much richer
repre-sentation of the overall network experience than a binary transformed rate. As such, we propose to use the calcu-lated Qn(ci) as the input into the aggregation function.
Assuming that the network-residing agent will then cal-culate the aggregate score sequentially upon receipt of a score from the mobile agent (in a first-in-first-out man-ner), Equation (6) can be refactored as
rsampleð Þ ¼t w
Additionally, in order to ensure that the calculated ag-gregate reputation score represents the most current state of the network as closely as possible, we propose to instruct the mobile agents to poll for the Qn(ci) the
mo-ment the mobile agent enters the network and then peri-odically until it leaves.
Upon receiving the sample score, the network-residing agent will then immediately calculate the running aggre-gate network score instead of computing the difference of mobile nodes experiencing good service vs. those ex-periencing bad service. The reasoning behind this is that, to be consistent, it is preferable that each reported sam-ple score communicated by a mobile node affects the overall computed network reputation score in the same fashion. By first combining the scores in a given period, one mobile user's sample score in one interval could po-tentially have a different impact on the computed net-work score if the same score was leveraged in another interval. In this way, instead of combining the received scores within an interval, the network-residing reputa-tion agent in the proposed model queues sample scores
and processes them sequentially in a first-in-first-out (FIFO) manner.
As a result, when a mobile node approaches a poten-tial target network, instead of requesting the current aggregated reputation score, we propose that the mo-bile node requests the predicted future aggregate score. If the predicted score of the target network is greater than the predicted score of the current network and the acceptable threshold, a handover is initiated. Otherwise, the mobile node remains in the current network, as presented in Figure 1. This handover process is consid-ered the passive process in our simulation, as the hand-over investigation is triggered by the 802.21 MIH link detection events (i.e., not actively by the mobile node itself ). If the mobile node's RSS within the current net-work drops below a given threshold, which can be con-figured within the MIH protocol, a link going down event is received, forcing the mobile node to search for an available network to handover to before the connec-tion is lost. This is considered the forced handover process.
4 Simulation and network configuration
The simulation design and execution was carried out using the open-source discrete-event network simulation tool NS2. Modeling of the WiMAX entities and 802.21 protocol was made possible via the Mobility module, de-veloped in the‘Seamless and Secure Mobility’project by the National Institute of Science and Technology (NIST, Gaithersburg, USA) [11], and the modeling of the UMTS entities was made possible via the EURANE module, de-veloped by the European Commission (Brussels, Belgium)
5th Framework Project,‘SEACORN’[12]. An MPEG
traf-fic generation module was leveraged from [13] in order to simulate streaming video or voice.
In order to measure the performance of the proposed model vs. the original model defined in [7], several ex-periments were carried out. The first category of simula-tions pertained to observing one mobile node against varying network conditions using the two models, while the second category of simulations involved observing the overall network ecosystem while a multitude of mobile nodes interacted in the network under varying network conditions using the two models. In both categories, the layouts included UMTS ubiquitous coverage with a WiMAX network (range 500 m) overlapped with a Wi-Fi network (range 100 m). Additionally, the default network scores assigned to these networks were set to prioritize the networks in the following order: Wi-Fi, WiMAX, and UMTS, with the latter being given the lowest priority due to its typically higher cost.
types of speeds in order to simulate the different methods of urban travel:
Walking - 5 km/h, 1.38 m/s
Riding the bus - 40 km/h, 11.11 m/s Riding in the car - 75 km/h, 19.4 m/s.
Finally, the threshold values were defined using the minimum values required for conversational CoS trans-mission, and the weights were built using the values cal-culated in [14], which can be seen in Table 2.
5 Simulation results 5.1 Single mobile node
5.1.1 Scenario 1: gradually varying traffic
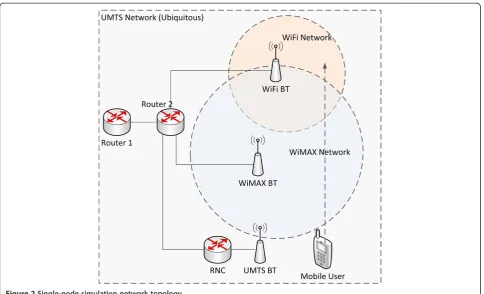
The first experiment involving a single node considers the gradual increase and decrease of traffic as a node
traverses from one network into another, as can be seen in the network topology depicted in Figure 2. In this sce-nario, the traffic applied to the Wi-Fi network is con-trolled in order to produce gradually varying scores. The mobile node is iteratively made to traverse from the WiMAX to the Wi-Fi zone at different times throughout the varying load curve, as seen in Figure 3. As a result of the gradual variance, the mean error between the pre-dicted score for timet(calculated att−1 s), and the ac-tual aggregate score observed at timetis 9.85%.
From the figure, it can be seen that as the network be-comes congested, the mobile node using the predicted score at time (t) has advanced warning that the QoS of the network is deteriorating. This can be seen at time
t= 35 s and t= 40 s, where the aggregate scores are
above the threshold and perceived as good, while the predicted scores are below the threshold and perceived as bad. Since the aggregate scores following the above time instances do fall beneath the threshold, the predicted scores allow the mobile node to make the VHO decision sooner and maintain an increased overall experience.
5.1.2 Scenario 2: traffic spike
The second experiment carried out against a single node considers a spike occurring within the traffic flow. In this scenario, the traffic applied to the Wi-Fi network is
Table 2 Weights calculated in [12] for each performance metric, per CoS
Traffic class BER Delay Jitter Bandwidth
Conversational 0.04998 0.45002 0.45002 0.04998
Streaming 0.03737 0.11380 0.42441 0.42441
Interactive 0.63593 0.16051 0.04304 0.16051
Background 0.66932 0.05546 00546 0.21976
controlled to produce gradually varying scores with a sudden surge introduced temporarily and then removed. Similarly to the first experiment, the mobile node is itera-tively made to traverse from the WiMAX to the Wi-Fi zone at different times throughout the varying load curve, as seen in Figure 4.
As is evident from the figure, the spike in traffic cor-responds to the sudden drop in the aggregate score at
t= 35 s. Furthermore, it is clear that the predicted
score does not provide any additional benefits in the case of a sudden degradation of the network and in fact yields a very large mean error of 38.78%. This makes sense as there are no prior values that can give advanced warning of the sudden change in traffic load. The advantage can be seen when the QoS is re-established at time t= 55 s. Instead of deciding to join on the first
Figure 2Single-node simulation network topology.
Figure 4Comparison of sampled reputation scores with traffic load spike.Comparison of sampled reputation scores over time between proposed prediction model and existing aggregate model.
instance of a perceived good score, as in the case of the aggregate score, the predicted score requires the occur-rence of at least two‘good’scores. This enables the mobile node to make a more confident VHO decision and help reduce the number of unnecessary handovers overall in the network.
5.2 Multiple mobile nodes
5.2.1 Scenario 1: traffic overload
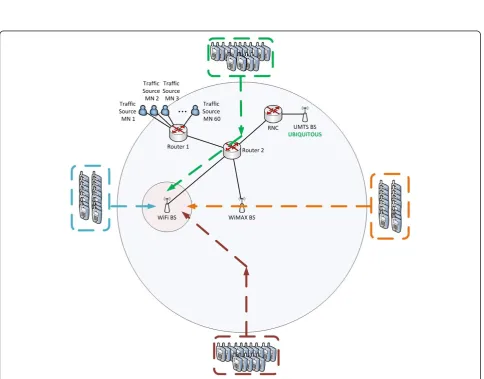
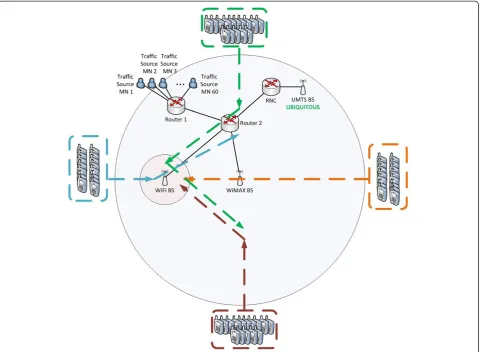
The first scenario leveraging multiple nodes consisted of 60 mobile nodes rapidly overloading the WiMAX net-work followed by overloading the Wi-Fi netnet-work, as
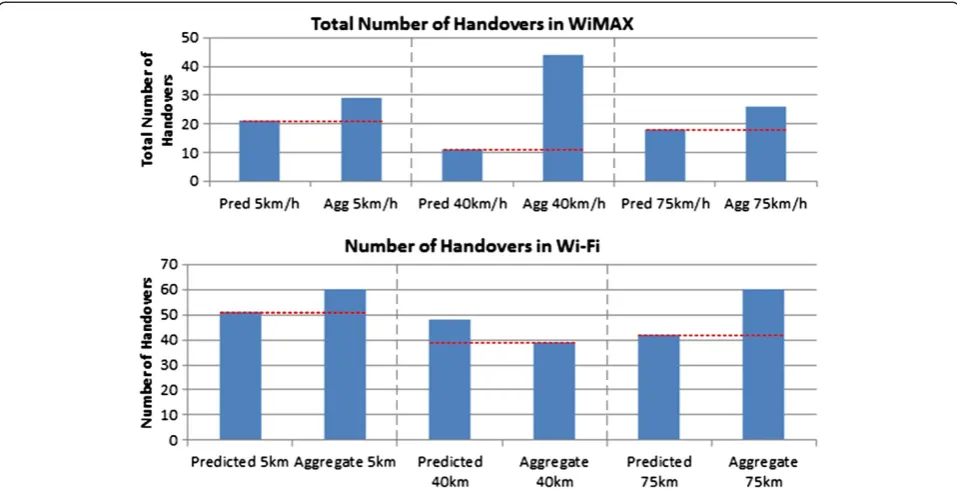
seen in Figure 5. The summary of the total number of handovers into the WiMAX and Wi-Fi network over the course of the entire simulation at the three different speeds is shown in Figure 6. As can be observed, in this scenario, the proposed prediction model results in fewer handovers to either network type at all speeds, except for handovers made to the Wi-Fi network at 40 km/h. Apart from the exception scenario just mentioned, this aligns to the expected results due to the fact that since the networks are being quickly overloaded, the predic-tion model is providing advanced notice to the mobile node, allowing more nodes to opt out of the handover.
Figure 6Comparison of total number of handovers between the proposed predicted and original aggregate models.Comparison of total number of handovers in WiMAX (top) and Wi-Fi (bottom) between the proposed predicted and original aggregate models throughout the simulation in scenario 1 for multiple nodes, across all speeds.
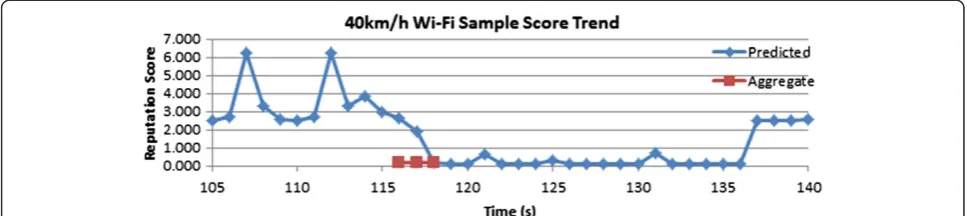
Upon investigating the exception scenario further, it can be seen that the reason why there are more handovers at 40 km/h into Wi-Fi under the proposed prediction model is the fact that there were very few handovers made ori-ginally to WiMAX. As a result, at 40 km/h, the majority of the nodes remained in UMTS when reaching WiMAX, and since UMTS had the lowest network score between the three networks, when these nodes arrived at the Wi-Fi hotspot, they more readily perceived the Wi-Fi network as better and thus joined. This is supported by Figures 7, 8, and 9 as follows. In Figure 7, we see that the number of handovers to Wi-Fi in the prediction model exceeds the original model at around 115 s; subsequently, in Figure 8, the sample scores in the prediction model are higher at around 115 s, while the WiMAX values are substantially lower in Figure 9. As a result, given that the UMTS score is slightly above the threshold, around 0.075, and the Wi-Fi scores are initially around 3, the majority of nodes handover.
5.2.2 Scenario 2: increase and decrease of traffic
In the second scenario, the WiMAX and Wi-Fi networks are more gradually overloaded; towards the end of the simulation, there is a reduction in traffic in the Wi-Fi network as mobile nodes are still joining, as shown in
Figure 10. Given this, the expectation is that again, in WiMAX there would be fewer handovers, while in Wi-Fi, there would be more due to the decrease in traffic.
After simulating the scenario at the three different speeds, the results can be seen in Figure 11. Contrary to the expected results, there were more handovers permit-ted via the proposed prediction model in WiMAX and fewer handovers in Wi-Fi. In reviewing the 40-km/h in-stance, for WiMAX, it is observed that due to the grad-ual increase in traffic, the prediction curve is not as steep, permitting more handovers in the prediction model, as seen by the sample scores calculated by the mobile nodes in Figure 12. In Wi-Fi, it is observed that the prediction model requires numerous positive results in order to result in an advertised score with increased value; this is due to the fact that while some of the nodes begin experiencing better QoS when the traffic slowdown occurs, there are still numerous nodes experiencing poor service, and the average of all the calculated scores still tends to be low, as see in Figure 13.
5.2.3 Prediction error
When comparing the predicted score against the actual score in scenario 1, there is a mean error of 76.23%
Figure 8Comparison of the reputation scores while within the Wi-Fi network with traffic overload.The scores are sampled by the mobile nodes while within the Wi-Fi network at 40 km/h, between the prediction model and aggregate model.
Figure 10Topology and mobile node path for WiMAX and Wi-Fi with increasing and decreasing traffic scenarios.
across the three different speeds. Similarly, in scenario 2, the prediction error sits at 62.06% across all speeds. In both scenarios, this can be attributed to the fact that the prediction model is generating significantly more sam-ples, which impact the prediction algorithm described in the GM(1,1) model. This can be seen in Figure 8, where only three samples are obtained for the original model in a given timeframe while the prediction model has roughly ten times the sample data, and in Figure 13, where the significantly higher sample counts keep the prediction curve much lower than the aggregate.
6 Conclusion
In synopsis, in this paper, we have investigated the per-formance of an improved VHO reputation model based on a reputation system proposed in [7] and extended by the GM(1,1) algorithm. In comparing the proposed algo-rithm vs. the original model with respect to a single node and a network ecosystem, clear improvements can be seen in both situations. From a single-mobile-node perspective,
there is an advanced warning of network degradation and an increased hold-off time during surge in network load, preventing needless handovers. From a network perspec-tive, the proposed model reduces the number of handovers between heterogeneous networks under rapid congestion scenarios, allowing the traffic to be well balanced in the ecosystem. In gradually varying network conditions, the prediction model will have a much diminished impact on the overall number of handovers so long as the target net-work is providing a sufficient quality of service. Further-more, as in the single-mobile-node case, it reduces the number of handovers during sudden reductions in traffic, diminishing the possibility of a handovers when the net-work has not yet stabilized. Our future net-work includes ex-ploring the advantages of using this enhanced model in comparison with MADM and artificial intelligence solu-tions, investigating the benefit of using other grey model systems such as the grey residual error correction model, and reducing the amount of score noise observed in the results.
Figure 12Comparison of the reputation scores while within the WIMAX network with varying traffic.The scores are sampled by the mobile nodes while within the WiMAX network at 40 km/h, between the prediction model and aggregate models.
Competing interests
Both authors declare that they have no competing interests.
Received: 31 October 2012 Accepted: 23 October 2013 Published: 1 November 2013
References
1. IEEE,Standard for Local and Metropolitan Area Networks—Part 21: Media Independent Handover. IEEE Std 802.21-2008(IEEE, New York, 2009) 2. AA Bathich, MD Baba, M Ibrahim, IEEE 802.21 based vertical handover in
WiFi and WiMAX networks. Paper presented at the IEEE symposium on computers and informatics (ISCI), Penang, Malaysia, 18–20 Mar 2012 3. A Nyamapfene, B Naeem, Seamless vertical handover in Wi-Fi and WiMAX
networks using RSS and motion detection: an investigation. Pac. J. Sci. Technol.12(1), 298–304 (2011)
4. L Mohamed, C Leghris, A Adib, A hybrid approach for network selection in heterogeneous multi-access environments. Paper presented at the 2011 4th IFIP international conference on new technologies, mobility and security (NTMS), Paris, France, 7–10 Feb 2011
5. AA Yussuf, WH Hassan, S Issa, A review of VHD approaches in next generation wireless networks. Paper presented at the second international conference on digital information and communication technology and its applications (DICTAP), Bangkok, Thailand, 16–18 May 2012
6. MM Alkhawlani, KA Alsalem, AA Hussein, Multi-criteria vertical handover by TOPSIS and fuzzy logic. Paper presented at the international conference on communications and information technology (ICCIT), Aqaba, Jordan, 29–31 Mar 2011
7. M Zekri, B Jouaber, D Zeghlache, On the use of network QoS reputation for vertical handover decision making. Paper presented at the IEEE 2010 GLOBECOM workshops on handover and network selection in future broadband networks, Miami, Florida, USA, 6–10 Dec 2010
8. JL Deng, Introduction to grey system theory. J. Grey System1(1), 1–24 (1989) 9. W Zhengxin, D Yaoguo, W Yemei, A new grey Verhulst model and its
application. Paper presented at the IEEE international conference on grey systems and intelligent services, Nanjing, China, 18–20 Nov 2007 10. E Kayacan, B Ulutas, O Kaynak, Grey system theory-based models in time
series prediction. Expert Syst. Appl.37(2), 1784–1789 (2010)
11. NIST, Seamless and secure mobility homepage, http://www.nist.gov/itl/ antd/emntg/ssm_tools.cfm. Accessed 1 Sept 2010
12. EURANE, The EURANE homepage, http://eurane.ti-wmc.nl/. Accessed 1 Sept 2010 13. A Matrawy, I Lambadaris, MPEG4 traffic source homepage, http://www.sce.
carleton.ca/~amatrawy/mpeg4/. Accessed 1 Sept 2010
14. E Stevens-Navarro, VWS Wong, Comparison between Vertical Handoff Decision Algorithms for Heterogeneous Wireless Networks. Paper presented at the IEEE 63rd vehicular technology conference (VTC), Melbourne, Australia, 7–10 May 2006
doi:10.1186/1687-1499-2013-256
Cite this article as:Giacomini and Agarwal:Optimizing end user QoS in heterogeneous network environments using reputation and prediction.
EURASIP Journal on Wireless Communications and Networking
20132013:256.
Submit your manuscript to a
journal and benefi t from:
7Convenient online submission
7Rigorous peer review
7Immediate publication on acceptance
7Open access: articles freely available online
7High visibility within the fi eld
7Retaining the copyright to your article
![Table 1 Normalized AHP matrix generalized for a class ofservice [7]](https://thumb-us.123doks.com/thumbv2/123dok_us/962375.1118007/3.595.56.290.662.734/table-normalized-ahp-matrix-generalized-class-ofservice.webp)
![Table 2 Weights calculated in [12] for each performancemetric, per CoS](https://thumb-us.123doks.com/thumbv2/123dok_us/962375.1118007/6.595.57.542.88.409/table-weights-calculated-performancemetric-cos.webp)