Computational models for the dynamics of
early mouse embryogenesis
ALEN TOSENBERGER
1, DIDIER GONZE
1, CLAIRE CHAZAUD
2,3,4and GENEVIÈVE DUPONT*
,1 1Unité de Chronobiologie Théorique, Faculté des Sciences, Université Libre de Bruxelles (ULB), Brussels, Belgium,2Clermont Université, Université d'Auvergne, Laboratoire GReD, Clermont-Ferrand, France, 3Inserm, UMR1103, Clermont-Ferrand, France and 4CNRS, UMR6293, Clermont-Ferrand, France
ABSTRACT Early embryonic development, from the zygote to the blastocyst, is a paradigm of a dynamic, self-organised process. It involves gene expression, mechanical interactions between cells, cell division and inter- and intracellular signalling. Imaging and transcriptomic data have significantly improved our understanding of early embryogenesis in mammals. However, they also reveal a great level of complexity. How the genetic, mechanical, and regulatory processes interact to ensure reproducible development is thus much investigated by computational modelling, which allows a dissection of the mechanisms controlling cell fate decisions. In this review, we discuss the main types of modelling approaches that have been used to investigate the dynamics of preim-plantation mammalian development. We also discuss the insights provided by modelling into our understanding of the specification processes leading to the three types of cells in the embryo 4.5 days after fertilization: the trophectoderm, the epiblast and the primitive endoderm.
KEY WORDS:
development, gene regulatory network, mathematical model, cell specification, signalling
Introduction
The development of the mammalian embryo is a paradigm of dynamic, self-organised process. While transcriptomes from different mammals, including human, are getting unravelled for preimplantation stages (Nakamura et al., 2016; Petropoulos et al., 2016; Boroviak et al., 2018), the mouse remains one of the best experimental models due to numerous genetic and functional analyses. The large amount of observations reported for this organ-ism motivated the development of computational analyses. Before implantation in the uterus around embryonic day E4.5 (Fig. 1), cells in the early mouse embryo undergo a series of divisions and differentiations leading to a blastocyst composed of ~120 cells of
three different types. These three cell types are the trophectoderm (TE), the epiblast (Epi) and the primitive endoderm (PrE). Epi cells are pluripotent and are the source of the embryo itself. PrE and TE cells form extra-embryonic structures such as the placenta (Lanner et al., 2014; Rivera-Pérez et al., 2014; Frum et al., 2015; Chazaud et al., 2016). Surprisingly, the zygote seems to develop into a multicellular organism in the absence of any pre-determined polarity that may drive this organized sequence of differentiation steps. Blastocyst formation also takes place independently of the maternal environment (Rossant, 2016). How the different cell
www.intjdevbiol.com
*Address correspondence to: Geneviève Dupont. Université Libre de Bruxelles (ULB), Campus Plaine CP 231, Boulevard du Triomphe, B 1050 Brussels, Belgium Tel: +32 2 650 57 94. Fax: +32 2 650 57 67. e-mail: [email protected] - web: http://www.ulb.ac.be/sciences/utc/home.html - https://orcid.org/0001-9230-8034
Submitted: 13 December, 2018; Accepted: 21 January, 2019.
ISSN: Online 1696-3547, Print 0214-6282
© 2019 UPV/EHU Press Printed in Spain
Abbreviations used in this paper: Epi, epiblast, GRN, gene regulatory network; ICM,
inner cell mass; ODE, ordinary differential equation; PrE, primitive endoderm; TE, trophectoderm.
types arise, and how they organize in the developing embryo is a subject of intensive experimental and theoretical investigation.
into a hollow sphere of cells known as blastocyst.
In recent years, advances in live imaging and single-cell tran-scriptomics have led to the accumulation of significant amounts of data related to the mechanism of blastocyst formation in mice. While these data considerably enhance our understanding of early mammalian development, they call for sophisticated methods to organise and formalise new knowledge. Mathematical modelling and computational analysis provide a useful tool to apprehend such complexity and to organize the acquired knowledge into a rational and predictive framework (Brodland, 2015). In this review, we focus on the advances that have been achieved in the compu-tational modelling of the dynamics of early embryogenesis in mice. After some general considerations about the modelling methods used to study early embryogenesis (section 2), we discuss a few theoretical studies focusing on the mechanical aspects (section 3). Next, we consider successively the two specification steps that occur before implantation (sections 4 and 5), emphasizing some noticeable contributions of computational modelling.
Key modelling choices
Models differ in their foundations, methods and scopes. The choice of the modelling framework is dictated by the question that is being asked. Here, we do not aim at making an exhaustive list of all the modelling methods that can be applied to investigate the dynamics of early development. Rather, we describe the methods that are used in selected publications to computationally describe the early mammalian development. We focus on the features to which biologists may wish to pay attention to appreciate the main modelling assumptions and the type of information that can be gained from a specific computational study. More mathematically oriented reviews in relation with the modelling techniques described here below can be found in (Newman, 2005; Soneji et al., 2007; Zhou and Huang, 20011; Swat et al., 2012; Vasieva et al., 2013; D’Alessandro et al., 2014), among others. In this section, when listing various modelling approaches, we mainly refer to models that will be discussed later in this review.
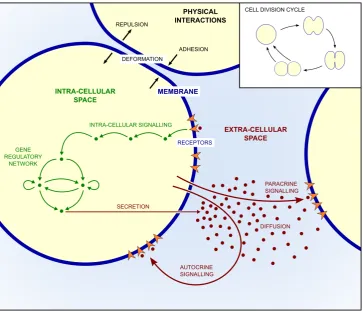
The choice of modelling methods used in a computational de-scription of a biological phenomenon depends on the processes that the model describes. One peculiarity of embryonic development
is that many processes are simultaneously at play and closely interact with each other (White et al., 2018). The main processes are schematized in Fig. 2. How cells evolve depends on their en-vironment and on the strength of the mechanical forces between neighbouring cells. Moreover, before implantation, cells are sur-rounded by the zona pellucida. This layer prevents a precocious and ectopic implantation, but no other function of zona pellucida during embryo development has been described yet. Embryo compaction creates repulsive forces between embryonic cells, which influences cell movement and leads to cell deformation. Cell division also leads to significant rearrangements inside the embryo as cells tighten up. Besides, cells are also subjected to intra- and extra-cellular signalling. Extra-cellular signalling occurs because cells secrete molecules, like growth factors, that diffuse in the extracellular space and can be perceived by cells that express the appropriate receptors. External signalling triggers a cascade of reactions that lead to the expression of specific genes in the nucleus. Cell differentiation indeed arises from the combination of several regulatory mechanisms, leading to the expression of cell type-specific sets of genes. Thus, from the genetic point of view, each cell type corresponds to a specific set of active regulatory genes. As the expression of these genes is most often regulated, we have to deal with the existence of intertwined networks of inter-acting genes. Thus, to describe cell differentiation, one must study the dynamical evolution and the steady-states of the underlying gene regulatory networks (GRN). For example, two cross-inhibiting genes constitute a simple GRN. The variables (nodes) of the network are the levels of expression of the two genes (e.g. A and B). The two negative feedbacks define the interactions (edges) in the network. Such a simple motif, known as the “toggle switch” can have two stable steady states, provided that the values of the kinetic parameters, such as the inhibition strengths for example, are in the right range of magnitude (Gardner et al., 2000). One stable steady state corresponds to a high level of expression of gene A and a low level of expression of gene B, and the second stable steady state to the opposite situation. These two states are associated to two different cell fates.
The complexity of early development is largely due to the fact that all the above mentioned processes are closely intertwined. For example, as further discussed in section 4 below, during the
TE
ICM
Epi
PrE
ICM
Nanog
Gata6 Cdx2
Oct4
Hippo ERK
E0 E2 E2.5 E3 E3.5 E4.5
phasis is put on the pathway itself. However, it has recently been shown that single-cell resolution analysis of gene expression can be used to predict critical transitions between lineages, associated to the loss of stability of a cell fate attractor (Mojtahedi et al., 2016; Richard et al., 2016).
In line with the importance of steady states, logic-based network descriptions use cause-effect relations to model and analyse GRN (Thomas and Kaufman, 2001; Abou-Jaoudé et al., 2016). In their simplest form, logic-based models are often referred to as Boolean models as they use Boolean algebra and permit each gene to be in one of two discrete states, ON or OFF. The state of a logical network evolves in a dynamic fashion as nodes of the network –i.e. gene states– are switched ON and OFF according to the state of the other nodes. Values of each node are updated iteratively. The trajectories in the state space can be simulated but there is no direct link with the “biological” time. Simulations generate a discrete sequence for the set of nodes, until the network settles in an unchanging state corresponding to an attractor, i.e. a cell fate. These models provide a good approximation of the qualita-tive behaviour of the GRN without the burden of a large number of kinetic parameters. They are increasingly used to model the behaviour of very large GRNs.
Logical dynamics belong to the class of discrete modelling methods. The states of the genes can only take a limited number of values (most often 2) and time evolves in discrete steps. The same concern holds for agent-based models. Such models simulate the evolution of a certain number of agents (i.e. cells) that follow a
number of rules. As a simple example, cell division or differentia-tion can be introduced in the form of “one cell becomes two cells if its volume exceeds a given threshold” or of “the fate of a cell switches if it is surrounded by cells of identical fate”. Such models allow to identify the developmental rules that suffice to reproduce experimental observations. Because of the large number of agents and of iterative applications of the rules, these models may lead to non-intuitive predictions. They highlight how complex phenom-ena can arise from the repetition and combination of simple rules (Nissen et al., 2017).
In contrast to discrete methods, in continuous methods, both the time and the variables vary in a continuous manner, i.e. all values are accessible for the time and for all the variables described in the model: gene activity, amounts of mRNA, levels of expressions of proteins, cell positions, etc. The most common type of continu-ous method is based on Ordinary Differential Equations (ODEs), where the system is described by a set of differential equations, each representing the evolution of a single biochemical species (Krupinski et al., 2011; Schröter et al., 2015; Holmes et al., 2017; Tosenberger et al., 2017). As such, continuous models are based on equations, in contrast to the above-mentioned models, which are based on rules. One of the main advantages of ODE models is that they are based on biochemical principles, such as physi-ological kinetic laws for the synthesis and degradation rates and for the regulations. This allows them to demonstrate a good predictive value. Moreover, these models provide a realistic dynamic view of the different variables involved in the network, and not only of
Fig. 2. Schematic representation of the main processes simultaneously at play during early mam-malian development. In general, models focus on a limited number of processes, determined by the biological question under investigation.
first differentiation process, compaction of cells due to an increase in adhesive forces triggers internal signalling, which in turn acts on the gene regulatory network. Inversely, as discussed in section 5, the state of the GRN for the second specification process will affect the rate of secretion of a growth factor. The secreted molecules then diffuse in the extracellular space and act as signalling molecules to the surrounding cells in the embryo.
em-the steady states. ODE models are also much used to describe cell mechanics, i.e. cell movement and deformation (Honda et al., 2004; Honda et al., 2008; Maître et al., 2016). Actually, because time is explicitly considered, systems of differential equations can describe all the processes depicted in Fig. 2 simultaneously.
ODE-based models generally involve a large number of pa-rameters. Parameter values correspond to quantities that can in principle be measured experimentally, such as synthesis or degradation rates, or Michaelian constants, but such quantitative data are rarely available. Moreover, the number of parameters increases fast with the number of processes described in the model, and notably with the number of genes considered in the GRN. The parameterisation of such models is thus a challenge. Nevertheless, minimal models, based on a limited number of variables and equations can be developed and analysed in detail. In such simplified models, only the processes that are thought to be crucial for the occurrence of a qualitative behaviour are de-scribed. For example, the “toggle switch” (Gardner et al., 2000), with or without auto-activation (Huang et al., 2007), is often used to represent the dynamics of cross-inhibiting and potentially self-activating genes to generate multi-stability. In this case, the use of realistic parameter values is not critical, as the aim is to show the emergence of possible qualitative behaviours. Moreover, in such minimal models, parameters in fact encompass many processes that are not explicitly modelled. For instance, the synthesis rate of proteins implicitly includes mRNA synthesis, splicing, maturation,
translation, and possibly post-translational modifications. Similarly, to model signalling cascades, one can, in a first approximation, bypass the successive activations of proteins (e.g. phosphorylations of the various MAP kinases), and simply assume that gene expres-sion is activated once a receptor is activated upon ligand binding. This allows to considerably decrease the number of variables and parameters, while retaining the essential elements involved in cell fate determination. However, all ODE models rely on the implicit assumption that the numbers of molecules are large and that all biochemical species are homogeneously distributed in the cell (or in the nucleus). They indeed describe the evolutions of average concentrations and neglect variations around these mean values that originate from possible local heterogeneities or random noise.
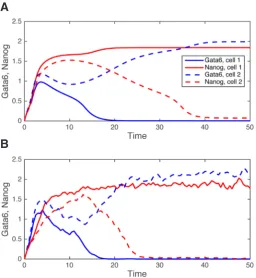
To take internal fluctuations into account, stochastic approaches must be used. The Gillespie’s algorithm is a well-established method that simulates the dynamics of a system characterized by a low number of molecules (Gillespie, 1977). This requires transforming an ODE-based model into a stochastic formalism. As depicted in Fig. 3 in the case of the transition of ICM cells into Epi or PrE cells (see section 5), the evolution of the variables of the model, here the levels of the characteristic transcription factors Nanog and Gata6, are not as regular because of the molecular noise that is significant when the number of molecules is reduced. For large numbers of molecules, these fluctuations become negligible leading to a time evolution that is more regular and is thus well approximated by a deterministic description (De Mot et al., 2016). Given the small number of genes and mRNA molecules, and because of the im-portance of fluctuations in cell fate specification, stochastic models are increasingly used in the field of development.
A last qualifier often used for models in the field of development is the term multiscale. While the spatial scale in which biochemi-cal reactions and gene regulations occur is below the micron, cell movement and liquid flow for example (corresponding to the forma-tion of the blastocoel) occur on length scales of the order of 0.1 mm. However, both processes influence each other and therefore cannot be described independently. Similarly, they are observed in different time scales that often differ by several orders of magnitude. Multiscale simulations use different meshes (i.e. spatial geometry and time resolution), with the difficulty of bridging these meshes in an accurate way. Often, next to the coupling of the system to different scales, the processes in each scale are modelled us-ing different methods (Krupinski et al., 2011; Swat et al., 2012; D’Alessandro et al., 2014; Tosenberger et al., 2017). As such the expression hybrid model, signifying the use of different methods coupled together, is frequently related to multiscale models. By using different scales in the simulation methods, multiscale mod-els provide a balance between the accuracy needed to describe small scale processes during an extended period of time and the computational feasibility of integrating genetic and biomechanical aspects of the whole embryo.
Mechanical aspects of early embryo development
In this section, we discuss different models of early embryogen-esis in the context of the physical properties of cells and cell popu-lations. There are two main physical aspects we need to consider: firstly, the description of the shape of the cell and its response to internal and external forces in terms of shape deformation, and secondly, cell-to-cell interactions that result in cell deformation and
Fig. 3. Deterministic (A) versus stochastic (B) simulation of the gene regulatory network (GRN) driving epiblast (Epi) versus primitive endoderm (PrE) cell specification.In both panels, Gata6 and Nanog are co-expressed at increasing levels at early times. After a while, one cell specifies the Epi (high Nanog) fate and the other cell the PrE (high Gata6) fate. See text, Bessonnard et al., (2014) and De Mot et al., (2016) for details.
movement (including potential forces coming from cells pushing each other and adhesion forces acting between cells). Not much is known about the exact physical interactions between cell mem-branes, and cell deformation and adhesion are difficult to measure. As a consequence, models often rest on approximations of these properties describing them in terms of mechanical forces acting on the cell. The forces are usually separated into: (1) potential or elastic force, which comes from the cell’s ability to resist deforma-tion, (2) adhesion force, which approximates adhesion between cells and tends to keep cells together, and (3) external force, which includes any force that acts on a cell and that does not originate form cell-to-cell contact (e.g. gravitation force).
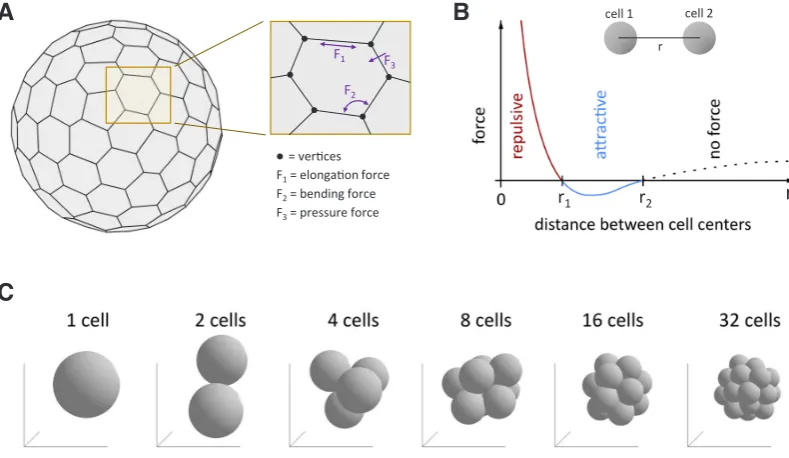
Another physical aspect of cell description concerns the cell shape. Cells are often modelled either as idealised volumes (spheres, ellipsoids), or as empty shells representing their mem-branes. In both approaches, there are different mathematical methods that can be used, each having their own strengths and weaknesses. In the first approach, each cell is described by a single point that characterizes the position of its centre of mass, and a small set of parameters corresponding to its volume, mass and orientation. In this way, the computational cost of simulating cell movement is significantly reduced, thus allowing for a more accurate modelling of other aspects of the system (e.g. intracel-lular and extracelintracel-lular biochemical regulations). However, what is sacrificed in this approach is the ability to describe the exact shape and deformation of the cell. In the second approach, the cell shape is traced via its membrane, which is usually described as an empty shell (i.e. surface) consisting of a large number of points, or vertices, forming a polyhedron (Fig. 4A). The accuracy of the description of the cell shape increases with the number of points used to describe the surface. All the forces acting on the cell (resistance to shape deformation and interactions between two cells) are then
calcu-lated at all points of the shell. As cell interactions and movements are calculated through interactions of individual vertices, and as these forces result in displacements of each of the vertices, the surface area and the volume of the cell could easily change. In order to keep them constant, additional forces need to be applied to vertices to preserve the area and the volume of the cell (Fedos-sov et al., 2010; Tosenberger et al., 2011; Bessonov et al., 2013). This method accurately describes cell shape and cell interactions, which can both be experimentally measured. However, the large number of points significantly increases the computational cost of calculating cell interactions, deformation and movement, often leaving less possibility to model other processes. Additionally, in such a 3D approach, it is generally hard to describe cell division. In 2008, Honda et al., used a previously devised three-dimen-sional vertex dynamics cell model (Honda et al., 2004; 2008) to study the emergence of asymmetry in mouse blastocyst. In the model, cells are described via their membranes, as polyhedrons. Between the neighbouring polyhedrons (i.e. cells), there are no gaps or overlaps, hence the neighbouring cells share parts of their membrane, i.e. vertices that correspond to the points of contact. Interactions between neighbouring vertices are defined by surround-ing cells and are expressed by a gradient of potential. The potential includes various terms describing cell surface area, cell volume and potential energy, all expressed in terms of vertex coordinates. The motion of the vertices is driven by the gradient of potential and is always damped as vertices do not have mass. Because polyhedrons corresponding to neighbouring cells share vertices, the method is not able to account for individual cell movement and rearrangement inside the embryo. Due to these limitations, the model does not capture blastocyst morphogenesis, but is able to analyse the optimal arrangement of cells once cavity is formed. Using the model, Honda et al., (2008) have confirmed the previously
Fig. 4. Some aspects of multiscale models.(A) Representation of the method used to model a cell as a deformable membrane. The simulation de-scribes the position of a large number of points, called vertices, located on the membrane and thus approximates the shape of the cell by a polyhedron.
(B) When cells are treated as non-deformable spheres, they are described by the position of their centres of mass. Cells interact through a repulsive force at short distance and an attractive force at intermediate distance. (C) When coupled to cell division, the interaction between cells schematized in (B) provides a realistic description of the developing embryo. See Tosenberger et al., 2017 for details about (B,C).
r1 r2
r
F1 F3
F2
= vertices F1 = elongation force
F2 = bending force
F3 = pressure force
cell 1 cell 2
r
B
proposed hypothesis (Alarcon and Marikawa, 2003; Kurotaki et al., 2007; Motosugi et al., 2005) that mechanical constraints imposed on the embryo are sufficient to orient the blastocyst axis and drive the localisation of the ICM at one of the sides of its long axis.
A further modelling step of the mechanical aspects of early em-bryogenesis was proposed by Krupinski et al., (2011; 2012) who devised a 3D multi-scale computational model of early embryonic development and provided a global approach of the various pro-cesses simultaneously at play during this process. Starting from the zygote, cells are modelled as incompressible ellipsoids that can move, deform, divide and change fate according to underlying genetic regulatory networks (emergence of TE and ICM cells in a first stage, and specification of Epi and PrE cells from the ICM in a second stage). Cell fate specification is formalized by differ-ential equations. Four types of mechanical intercellular forces are considered: potential, drag, adhesion and external force. These forces respectively correspond to elastic interactions between cells, adhesive drag (i.e. resistant) force of cells sliding against each other, attractive adhesion force and a force resulting from the global pressure exerted by the blastocoel (once created). The resulting elastic response of the cell to these mechanical intercellular forces is characterized by three orthogonal springs along the three axes of the corresponding ellipsoid. Moreover, cells are surrounded by an external layer that represents the zona pellucida. On the mechanical level, the model shows that perpendicular alignment of animal-vegetal and embryonic-abembryonic axes is a result of minimization of energy of the entire collection of cells, constrained within zona pellucida. Compared to the model developed by Honda et al., (2008), Krupinski’s model is moreover able to reproduce the Epi/PrE sorting, which occurs after the formation of the blastocyst cavity, based on the hypothesis of different adhesion forces between the different cell types: Epi cells adhere more between each other than PrE cells, and cross-adhesion is even weaker. However, some sort of directional force acting on PrE cells and emanating from the blastocoel, of yet undetermined biological nature, needs to be added in the model (see section 5.3 here below). The formation of the blastocoel is not simulated, but the authors considered that at this stage cells are constrained within a half-ellipsoidal space bounded by the trophectoderm.
In 2017, Tosenberger et al., applied another method to model Epi and PrE cell specification from ICM and the formation of the salt and pepper pattern. As in Krupinski et al., (2012), the authors used a spherical cell model, where each cell is described by the position of its centre of mass, its mass and a radius which defines its volume. For each pair of neighbouring cells, the model considers a repulsive force originating from cell deformation at very small inter-cellular distances, and an attractive force corresponding to cell adhesion at large inter-cellular distances (Fig. 4B). No drag forces are included in the model. The model is able to account for cellular adhesion, cell division and cell movement inside the ICM (Fig. 4C). As such, the multi-cellular model is computationally very efficient, and allows for a detailed description of the GRN and of extra-cellular signalling. For more details on the results, see sec-tion 5 on Epi/PrE specificasec-tion here below. While this multi-scale model was sufficient to describe ICM, Epi and PrE cell populations, the simplicity of the description of cell mechanics does not allow to account for any kind of change in cell shape, which would be necessary to extend the model to describe the TE cell population surrounding the ICM.
At the same time, another multidisciplinary study has advanced the understanding of the embryo compaction and of the behav-iour of cells following that stage. The work of Maître et al., (2017) aimed at understanding how apicobasal polarity, which is related to actomyosin contractility, contributes to the formation of the ICM. The authors developed a multicellular physical 3D model (based on Maître et al., 2015) where cells are modelled via their triangulated surfaces and preservation of their arbitrary volume. The cell surface is described by a set of small triangles, whose vertices correspond to the points covering the shell of the cell. Computation of surface tensions allows to describe surface deformation and cell-cell inter-actions in a mechanical rigorous way. Resorting to both modelling and biological experiments, the authors showed that cell internal-ization results from large differences in surface contractility. In the embryo, the differences in surface contractility can arise from the asymmetric divisions occurring at the 8- to 16-cell stage transition. Furthermore, the theoretical analysis suggests that cell size does not influence internalization and that loss of contractility drives cells towards the ICM-like fate. At this stage, embryo development thus appears as a robust self-organized process driven by contractility. From a physical point of view, this model is much more precise than previous models. It allowed for a rigorous validation based on experimental measurements. However, in such a model it would be difficult to describe cell divisions and due to a high computational cost, it is less convenient to study genetic regulation.
Formation of inner cell mass and trophectoderm lineages
As discussed in the introduction (Fig. 1), generation of outer and inner cells during pre-implantation development results from compaction, polarization and asymmetric divisions starting at the 8-cell stage. Inner and outer cells will specify into ICM and TE cells, respectively. TE cells are characterized by a high level of expres-sion of Cdx2, while ICM cells express Oct4 strongly. As maternal expressions of Oct4 and Cdx2 are not essential for early mouse development (Blij et al., 2012; Frum et al., 2013), the formation of ICM lineage corresponds to an auto-organized process that relies on a close interplay between cell motion, deformation, division and gene regulation. The core GRN (Fig. 5A) consists of mutual repression and auto-activation of the two transcription factors (Niwa et al., 2005). The link between cell polarity and position on one hand and the state of the GRN on the other hand –now known to be mediated by Hippo signalling (Sasaki et al., 2015; 2017)– has also been investigated by modelling. Following the position-based model (also called the inside-outside hypothesis), outer cells would receive an additional signal enhancing the expression of Cdx2. It is also known that during asymmetric division, the most external daughter cell receives more Cdx2 mRNA (Jedrusik et al., 2008); this unequal repartition of transcription factors could be reinforced by the GRN and thereby induce different cell fates. This assumption is known as the polarity-based model. These two mechanisms are not exclusive. Computational approaches have been carried out to help deciphering the respective roles of position and polarity in ICM versus TE specification.
is embedded in a more complex one also encompassing Sox2, Nanog and Gata6 allowing the authors to describe the embryonic stem cell circuit and to investigate strategies to reprogram a cell from a differentiated state to a stem cell state through directed perturbations (expression of specific genes).
To specifically address the TE/ICM specification, Krupinski et al., (2011) combined mechanics with gene regulation. The GRN is based on mutual repression of Cdx2 and Oct4. The authors introduced an empirical parameter (P) in order to investigate the respective influ-ences of polarity and position on cell fate specification. P positively acts on Cdx2 expression and acts as a main bifurcation parameter. For low values of P, only the ICM state (corresponding to a low level of Cdx2 and a high level of Oct4) is stable while for high values of P, only the TE state (corresponding to a high level of Cdx2 and a low level of Oct4) is stable. For intermediate values of P, both fates can coexist. In this case, the fate of a cell is thus determined both by the value of P and by the temporal evolution of the cell. To investigate the respective consequences of the position- and the polarity-based hypotheses, the authors envisaged two scenarios to fix the values of P. First, to test the hypothesis that the position of the cell would play a major role, P takes an arbitrary value that reflects the position of the cell. Outer and inner cells receive high
and low values of P, respectively, and no cell has a value of P in the bistability range. When this scenario is simulated together with cell division and movement, simulations reproduce the establishment of a layer of TE cells surrounding ICM cells. However, the model does not provide any hint concerning the molecular mechanism linking position and fate determination. In another set of simula-tions aimed at testing the hypothesis that cell polarity would play a major role, all cells are initially ascribed a value of P in the domain of bistability, and a state that corresponds to their positioning in the embryo. Moreover, it is assumed that the Cdx2 mRNA polarizes at the apical side of the outer blastomeres. During the simulated asymmetric cell divisions, the outer cell receives 90% of the Cdx2 mRNA content of the mother cell. Additionally, the probability of asymmetric division decreases with the concentration of Cdx2, such that high Cdx2 cells tend to remain in the outer layer of the embryo. As highlighted by the authors, the polarity-based model is not really successful because many badly positioned ICM cells arise in the simulations and because the model requires very fine tuning of the parameters characterizing the probability of asymmetric division to reproduce experimental observations, which makes this mechanism vulnerable with respect to noise. Moreover, from an experimental point of view, only a weak polarization of Cdx2 has
Fig. 5. Schematic representation of the gene regulatory network (GRN) and signalling pathways driving the trophectoderm/ inner cell mass (TE/ICM) (A) and the epiblast/primitive endoderm (Epi/PrE) (C) specification steps. In both cases, the GRN exhibits multistability for appropri-ate signalling intensities, as shown in the corresponding bifurcation diagrams. The TE/ICM GRN exhibits bistability, whereas the Epi/PrE GRN exhibits tristability. In panels (B,D), bold lines indicate stable steady states and thin lines, unstable ones.
B
C
D
been reported (Skamagki et al., 2013), which is far from the 90% assumed in the simulations. Finally, Cdx2 repartition does not seem to play a predominant role in determining cell fate (Ralston, 2008; Wu et al., 2010). Nevertheless, Krupinski et al., (2011) highlighted the need for formalizing biological assumptions in a rigorous way.
The question of how cells are directed to the appropriate fate was later addressed by Holmes et al., (2017) who considered the same ODE description of the core GRN for TE/ICM specification. However, instead of introducing an arbitrary parameter for inside or outside cells as in Krupinski et al., (2011), the GRN is in this model modulated by parameter S, reflecting in a more refined way the position dependent asymmetry. During the simulations, S is evaluated by computing the fraction of cell surface in contact with the zona pellicuda. The rate of Cdx2 expression increases with S, which acts as a bifurcation parameter in the same way as parameter P in Krupinski’s model. Thus, as it is the case in that model, the postulated positional mechanism naturally initiates the pattern of the early embryo. However, in some cases, errors arise. Cell motions and divisions indeed intermingle the TE/ICM cell types and corrections are not possible because, once a cell has reached a given steady state, significant changes in S are neces-sary to change its fate due to hysteresis. Holmes et al., (2017) then considered stochastic equations using the Langevin’s formalism: noise terms were included in the evolution equations of Cdx2 and Oct4 expression. Due to random fluctuations, fate switching is made easier and mis-positioned cells can re-adopt the appropri-ate fappropri-ate after some time. An interesting computational prediction of this study is that the best model performance is obtained when considering asymmetries in noise sources. Gene expression quantification experiments indeed confirmed that in the embryo, after the 16-cell stage, fluctuations in the levels of expression are larger for Cdx2 than for Oct4 (Holmes et al., 2017). Moreover, the model shows that, as noise plays a constructive role in promoting some kind of plasticity to the GRN, it is important that evolution towards one or the other fate occurs as a gradual process to allow for some re-adjustment in the dynamics of cell fate specification.
Although based on a very different formalism, it is interesting to mention that in the agent-based model of Nissen et al., (2017), TE vs ICM specification is described by a single rule linking cell adhe-sion and polarity: cells with fewer than 5 neighbours are assigned the TE fate and become polar. Adhesion is then considered to be maximal between two polar cells oriented in the same direction, allowing the establishment of an external layer of TE cells.
In the above-mentioned approaches, positional information is introduced artificially, by considering an empirical parameter (P or S) or an arbitrary rule. Experiments have now uncovered the major role played by the Hippo signalling in determining the TE or ICM cell fate (Sasaki et al., 2015; 2017). In the absence of signalling, the transcriptional regulator Yap can enter the nucleus and acti-vates the transcription of Cdx2 (Fig. 5A). When Hippo signalling is active, the Lats1/2 kinases get phosphorylated, which allows Yap phosphorylation. Phosphorylated Yap is maintained in the cytosol where it is degraded. Thus, Cdx2 is less expressed, which allows for the expression of Oct4. Lats1/2 activity is related to cell polarity and cell position through the Amot protein. These findings allowed the development of a molecular model taking into account the GRN and Hippo signalling (De Caluwé et al., 2019). In the model, the expression of Ecadherin (Ecadh) and the concentrations of Par-aPKC are dynamically varied to describe various cell trajectories,
in a spatial and developmental sense. Compaction corresponds to an increase in Ecadh at adherens junctions, while polarization corresponds to an increase in Par-aPKC. Phosphorylated Amot (i.e. the ECadh bound form that activates Lats phosphorylation) now serves as the effective bifurcation parameter (Fig. 5B), the value of which can be modulated by changes in ECadh and/or Par-aPKC. The model reproduces experimental observations about cell fate acquisition at the 16-cell stage and emphasizes that positional and polarity hypotheses coexist, as both cues converge at the level of Hippo signalling. Interestingly, simulations also suggest that bista-bility allows integration of signalling and cell history to determine cell fate, while avoiding the occurrence of cell fate switches in the fluctuating environment of cells in the early embryo. Indeed, for values of parameters leading to a step-like regulation of cell fate instead of bistability as a function of Hippo signalling, noise in the evolution of the levels of cell adhesion and cell polarity would result in numerous cell fate switches and thereby decrease the invariableness of embryo development. Comparing these results with the findings of Holmes et al., (2017), one can conclude that in the signalling-controlled specification of cells into TE or ICM, noise has a constructive role as it increases plasticity, while its possible deleterious effects are significantly reduced thanks to the presence of bistability in the GRN.
Formation of epiblast and primitive endoderm lineages
Epiblast and primitive endoderm (Epi/PrE) specificationIn the second specification step during which ICM cells dif-ferentiate, Nanog and Gata6 are the characteristic transcription factors of the Epi and PrE state, respectively. As for the previous specification step, the two factors cross-inhibit and self-amplify. Moreover, Fgf secretion is under the control of Nanog and Gata6, and Fgf maintains the expression of Gata6 (Fig. 5C). In mice, from the 8-cell stage corresponding to ~E2.25 to the ~20-cell stage
levels of Nanog and Oct4-Sox2.
In the context of embryonic development, the Fgf-modulated Nanog/Gata6 GRN was modelled by Bessonnard et al., (2014). The GRN model is based on a toggle switch between Nanog and Gata6, with auto-activation. The model also incorporates the Erk signalling pathway, which stimulates Gata6 production and inhibits that of Nanog. The expression of Fgf receptors is stimulated by Gata6 (Fig. 5C). Because of the incorporation of Erk signalling, the system of ODEs can exhibit tristability for intermediate ranges of external Fgf4, with each stable state corresponding to a different cell fate – ICM, Epi and PrE (Fig. 5D). The full model also describes the dynamics of Fgf4, with its rate of secretion by the cell being proportional to the level of Nanog. It accounts for the initial evolu-tion of the cells towards the ICM state, and for the subsequent self-organized process of Epi/PrE specification.
To account for the spontaneous emergence of the various cell fates in the embryo, one has to consider a population of cells interacting through Fgf4. In a first approach, 25 non-dividing cells were considered. Each cell was described by the ODE system representing its own GRN and placed on a 2D square mesh where it has 4 neighbours. The cells can sense the Fgf4 produced by themselves and by their 4 neighbouring cells. Simulations showed that the autonomous variations of Fgf4 inside the embryo allow for a robust Epi or PrE specification, as well as for the formation of the salt and pepper pattern. Cells first evolve towards the ICM state, which is stable at the level of Fgf4 prevailing at the 8-cell stage embryo. From this stage on, the feedbacks of Nanog and Gata6 on Fgf4 secretion allow for the self-autonomous modulation of this growth factor in the embryo leading to Epi/PrE specification, depending on the local environment of each cell. The model was able to recapitulate most of the cell behaviours observed during different experimental conditions and in mutants. It also uncovered novel features of ICM cell fate specification such as the role of the initial induction of a subset of cells into Epi in the establishment of the salt and pepper pattern, or the precocious Epi specification in Gata6+/- embryos. Importantly, the model assumes that small
differences in Erk signalling (modelled in the form of random noise on external Fgf4) play a key role both in the specification process itself and in the establishment of the salt and pepper pattern. These small differences could be due for example to a reduced diffusivity in the extracellular space, created by the high level of compac-tion in the embryo, or to an unequal reparticompac-tion of Fgf receptors. The importance of noise in Fgf signalling remains to be validated experimentally.
The possibility that other sources of noise could be responsible for the initiation of specification was investigated in a subsequent study (De Mot et al., 2016). The ODE description of the internal GRN and signalling of the 25 cells was converted into a stochastic framework and simulated with the Gillespie’s algorithm (Gillespie, 1977). This algorithm allows to describe the fluctuations in the number of molecules that are known to arise when small volumes (as those of nuclei) are considered. In that case, the evolution of the concentrations are noisy (Fig. 3B), with the level of noise de-creasing when the number of molecules, i.e. the volume, increases. Simulations predict that internal fluctuations are indeed able to initiate ICM cell specification. However, when only this source of noise is considered, a significant number of simulated cells evolve towards the Epi or PrE fate without passing through the ICM state, which is not observed experimentally. Another unrealistic behaviour
is that switches between the Epi and the PrE state occur in the course of the simulations. This suggests that the molecular noise is not the major driver of Epi/PrE cell specification.
As another continuation of Bessonnard et al.’s work describing the Epi/PrE specification as a self-autonomous dynamical process relying on tristability, the same GRN model was simulated in a 3D environment (Tosenberger et al., 2017). The authors developed a multiscale model of cells that adhere to each other, divide, and move. The model reproduces the dynamics of ICM cells, specification of Epi and PrE lineage and the salt and pepper pattern formation. The ICM is modelled as a part of the embryo, starting from the 16-cell embryo stage and omitting TE cells and blastocoel cavity from the model. Starting from the initial 3 to 5 ICM cells (present at the 16-cell stage of the embryo, E2.5), cells divide, creating 6-10 ICM cells. At that stage additional naïve cells are added up to the total of 12 cells, to simulate cells that enter in the ICM from the outer (TE) layer by asymmetric divisions and to reflect the number of ICM cells in the 32-cell embryo (E3.0), which is consistently around 12. The ICM cells then undergo another wave of cell division at E3.5, creating a total of 24 cells, which by E4.0 finish the process of specification and form the salt and pepper pattern. The model successfully reproduced the results of the 2D model (Bessonnard et al., 2014; De Mot et al., 2016) and is in good agreement with experimental data. It also allowed to test the GRN and its robust-ness in a more dynamical environment including cell division, cell movement and a realistic number of neighbouring cells. The simulations have shown that besides heterogeneities in local Fgf4 concentration, another possible origin of the symmetry breaking in the early embryo could be the fact that cell divisions induce cell relocation within the ICM, due to the constrained environment. By displacing, cells change their surrounding (i.e. neighbouring cells) and hence receive different amounts of signal (Fgf4), making it easier for cells to break the symmetry in the embryo and specify to either Epi or PrE lineage. Another possible source of heterogeneity is the unequal repartition of internal cell concentrations (GRN factors excluding Fgf4) in daughter cells at cell divisions. The dynamics of cell fate specification and the resulting proportions of cell types were similar, leading to the conclusion that any one of three pos-sible origins (or all of them together) could be sufficient to induce cell specification. The authors also studied the relation of the Fgf4 secretion to the GRN. They have shown that, compared to the activation of Fgf4 induction by Nanog (Bessonnard et al., 2014; De Mot et al., 2016), its inhibition by Gata6 is necessary to explain the results of maternal Fgf4 knockout embryos (Kang et al., 2013).
biological situations that are modelled. In the embryo, inner cells first evolve towards the ICM, before specifying into PrE and Epi cells. Thus, all three states are attractive and must thus correspond to stable steady states. When ES cells specify, only two states are observed (Nanog+/Gata6- or Gata6+/Nanog-). This situation can
be accounted for by the toggle switch, where the Nanog+/Gata6+
intermediary state is unstable. In this situation, this ICM-like state only delineates the basins of attraction of the Epi and PrE states. This example illustrates how models are situation-specific and that great care should be taken before generalizing their simula-tion results, exactly as in the case of experimental observasimula-tions.
In the agent-based model of Nissen et al., (2017) mentioned in the previous section for the TE vs ICM specification, Epi vs PrE specification is governed by the nature of the neighbouring cells. If xi,1 represents the number of ICM and Epi cells around cell i and
xi, 2 the number of PrE cells around cell 2, the probability of cell i
to become PrE is given by xi,1/(xi,1+xi,2). This corresponds to a rule
of specification exclusively based on the concentration of Fgf4 in the direct environment of the cell.
Salt and Pepper pattern
The mixed pattern of Epi and PrE cells observed at the E3.75-E4.0 stage is traditionally referred to as a salt and pepper pattern. The exact meaning of this expression to characterize the spatial arrangement of cells is however ambiguous. It could refer to a random distribution of Epi and PrE cells, or to a spatial arrange-ment in which Epi cells are preferentially surrounded by PrE cells and vice-versa (like in a chess-board). This question was recently investigated by Fischer et al., (2017). These authors first performed a quantitative 3D analysis of cell neighbourhood in ~E4.0 mouse
embryos. The real 3D spatial distribution of cells was then used to create a network where vertices represent cells and edges connect them to neighbouring cells (identified by a proximity criterion). On the basis of this network, the authors have tested three different patterns to decide the individual cell fate choice: a random expres-sion pattern, a period two pattern (the state of one cell determines that of all its surrounding cells) and a nearest neighbour pattern (the state of one cell determines that of its nearest neighbour). For each pattern, the neighbourhoods of each cell fate were compared to the experimental data, revealing that the observations differ significantly from any of the simulated patterns. Although this may reveal some unknown regulatory mechanism as suggested by the authors, it should be emphasized that it is quite delicate to rely on the pure intuition to interpret such complex mechanisms of patterning. In the 3D model based on the Fgf-modulated Nanog-Gata6 GRN (Tosenberger et al., 2017), by counting the number of neighbours of each type in the simulations, it was revealed that the spatial pattern of Epi and PrE cells does not correspond to a random pattern, nor does it correspond to a chess-board.
Cell sorting (and epithelium formation)
In the previously mentioned work by Krupinski et al., (2012), the 3D embryo model is also used to investigate the sorting of Epi (Nanog expressing) and PrE (Gata6 expressing) cells that occurs after their specification. The process of Epi and PrE cell specification is not modelled, rather the two cell populations are initially randomly distributed in the ICM. The authors tested two hypotheses: differential adhesion, and active cell movement directed by signalling originating from the blastocoel. In the first
one the strength of adhesion is differently defined for the two cell populations. The idea of cell sorting due to differential adhesion in heterogenous cell populations was already previously studied in Graner and Glazier (1992), Foty and Steinberg (2004), Eyiyurekli et al., (2007), and Palsson (2008). In the work by Krupinski et al., (2012), they investigated this hypothesis and defined the adhesion between Nanog expressing cells as the strongest one, followed by the adhesion between Nanog and Gata6 expressing cells, while the adhesion between Gata6 expressing cells is defined to be the weakest among all three. The results show that differential adhesion is sufficient to sort the two populations, but the PrE cell layer does not necessarily form at the correct place (i.e. the blastocoel side). To test the second hypothesis, a directional force acting towards the blastocoel is applied on PrE cells. Although PrE cells in this case migrate towards the blastocoel, they fail to form the enclosing layer. However, when combined together, the two hypotheses enable for a rather stable and robust formation of the PrE cell layer separating Epi cells from the blastocoel. What remains to be understood is the molecular mechanism responsible for the differential adhesion between the three types of cells (Epi, PrE, ICM). Besides, the directional force acting on the PrE cells is questionable as so far there is no indication that such force ex-ists in the embryo. However, it serves well as a proxy for the real yet unknown mechanism by which PrE cells migrate toward the blastocoel, and enables the verification of the hypothesis of dif-ferential adhesion. Similarly, in the agent-based model of Nissen et al., (2017), sorting is achieved by assigning a lower attraction factor between two PrE cells or between a PrE and any other type of cell. For more hypotheses on the possible mechanisms involved in Epi and PrE cell sorting see (Chazaud and Yamanaka, 2016).
Concluding remarks
interpret the data and to make testable predictions.
Computational models have proven to be useful to back-up the experimental observations on early mammalian development. The widespread concept of multistability and its physiological implications cannot be easily assessed without its formalization into mathematical equations. Thus, models predict that the two first specification steps correspond to the evolution towards one among several stable steady states, controlled by signalling. While the ICM vs TE specification occurs as a binary choice between two stable steady states (Holmes et al., 2017) governed by Hippo signalling, the subsequent step of Epi vs PrE specification may be explained in terms of an evolution towards one of the steady states of a tristable network (Bessonnard et al., 2014). In the latter case, cells leave the stable ICM state in response to extracellular signalling by Fgf4, and thus evolve towards the Epi or PrE fate, which correspond to the stable steady states for low and high levels of Erk signalling, respectively. Models also emphasize that in both cases, noise plays a constructive role by allowing some flexibility in the TE/ICM choice, and by inducing some initial heterogeneity able to break the symmetry between identical ICM cells in the subsequent specification step.
Interestingly, models also predict that spatial patterning and GRN are intimately related. The spatially organized TE/ICM pattern is under the control of Hippo signalling, which is itself regulated by cell position and polarity. In contrast, the apparently random salt and pepper pattern of Epi and PrE cells results from Erk signalling, which is itself regulated by the level of extracellular Fgf4 that diffuses among the cells of the embryo. Besides the GRN, cellular mechan-ics are so elaborated that it is difficult to estimate intra-embryonic forces without building a physical model of blastomeres configura-tion. In this respect, modelling has brought significant insight into the mechanism of orientation of the blastocyst axis (Honda et al., 2018) or the relation between cell contractility and internalisation during asymmetric divisions (Maître et al., 2015). Regarding the sorting of Epi and PrE cells, modelling predicts that the existence of different adhesion forces between cells expressing different levels of Nanog and Gata6 is sufficient to explain the separation between the two types of cells (Krupinski et al., 2012; Nissen et al., 2017). However, an additional global directional force –the nature of which remains to be established experimentally– must be as-sumed to simulate the formation of the PrE cell layer separating Epi cells from the blastocoel (Krupinski et al., 2012).
Further progress in the understanding of early embryogenesis will undoubtedly rely on combined experimental and modelling approaches. For example, while cell fate specification has at-tracted much attention, how cell fates are determined still remains poorly understood. Indeed, in the existing GRN models, a cell can switch fate upon changes in signalling or externally induced modifications of the levels of expression of transcription factors. In contrast, in the embryo, cell plasticity is only observed during a given time window (Grabarek et al., 2012). From a modelling perspective, this implies considering the temporal dependence of the GRN, which is a challenging question both for experimental biologists and for modellers. Moreover, some progress has to be done concerning the accurate modelling of the relation between cell division, compaction and the dynamics of adherens junctions. A realistic description of the diffusion of extracellular signals, such as Fgf4, also calls for more elaborated simulation techniques as the high level of compaction in the developing embryo is expected
to interfere with the free diffusion of molecules in the extracellular medium. Once validated, models could also be used to analyse the molecular origins of developmental defects.
Acknowledgments
This work was supported by the “Fonds National de la Recherche Scientifique” (FNRS, Belgium) [Convention no T.0015.16 (26021674)]. AT benefits from a FNRS postdoctoral support. CC is funded by ANR PrEpiSpec and the FRM. GD is Research Director at the Belgian FNRS.
References
ABOU-JAOUDÉ W, TRAYNARD P, MONTEIRO PT, SAEZ-RODRIGUEZ J, HELIKAR T, THIEFFRY D, CHAOUIYA C (2016). Logical Modeling and Dynamical Analysis of Cellular Networks. Front Genet 7: 94.
ALARCÓN VB, MARIKAWA Y (2008). Spatial alignment of the mouse blastocyst axis across the first cleavage plane is caused by mechanical constraint rather than developmental bias among blastomeres. Mol Reprod Dev 75: 1143-1153. ARTUS J, CHAZAUD C (2014). A close look at the mammalian blastocyst: epiblast
and primitive endoderm formation. Cell Mol Life Sci 71: 3327-3338.
BEDZHOV I, GRAHAM S, LEUNG CY, ZERNICKA-GOETZ M (2014). Developmental plasticity, cell fate specification and morphogenesis in the early mouse embryo.
Philos Trans R Soc Lond B Biol Sci. 369: 1657.
BESSONOV N, BABUSHKINA E, GOLOVASHCHENKO SF, TOSENBERGER A, ATAULLAKHANOV F, PANTELEEV M, TOKAREV A, VOLPERT V (2014). Numerical Modelling of Cell Distribution in Blood Flow. Math Model Nat Phenom 9: 69-84. BESSONNARD S, DE MOT L, GONZE D, BARRIOL M, DENNIS C, GOLDBETER
A, DUPONT G, CHAZAUD C (2014). Gata6, Nanog and Erk signaling control cell fate in the inner cell mass through a tristable regulatory network.
Develop-ment 141: 3637-3648.
BLIJ S, FRUM T, AKYOL A, FEARON E, RALSTON A (2012). Maternal Cdx2 is dispensable for mouse development. Development 139: 3969-3972.
BOROVIAK T, STIRPARO G, DIETMANN S, HERNANDO-HERRAEZ I, MOHAM-MED H, REIK W, SMITH A, SASAKI E, NICHOLS J, BERTONE P (2018) Single cell transcriptome analysis of human, marmoset and mouse embryos reveals common and divergent features of preimplantation development. Development 145: pii: dev167833.
BRODLAND GW (2015). How computational models can help unlock biological systems. Semin Cell Dev Biol 47-48: 62-73.
CHAZAUD C, YAMANAKA Y (2016). Lineage specification in the mouse preimplanta-tion embryo. Development 143: 1063-1074.
CHICKARMANE V, PETERSON C (2008). A Computational Model for Understand-ing Stem Cell, Trophectoderm and Endoderm Lineage Determination. PLoS
One 3: e3478.
CHICKARMANE V, OLARIU V, PETERSON C (2012). Probing the role of stochastic-ity in a model of the embryonic stem cell – heterogeneous gene expression and reprogramming efficiency. BMC Syst Biol 6.
D’ALESSANDRO L.A., HOEHME S., HENNEY A., DRASDO D., KLINGMÜLLER U. (2014) Unraveling liver complexity from molecular to organ level: Challenges and perspectives. Progr. Biophys. Mol. Biol. 117: 78-86.
DE CALUWÉ J, TOSENBERGER A, GONZE D, DUPONT G. Signalling-modulated gene regulatory networks in early mammalian development. J. Theor. Biol. 463: 56-66. DE MOT L, GONZE D, BESSONNARD S, CHAZAUD C, GOLDBETER A, DUPONT G (2016). Cell Fate Specification Based on Tristability in the Inner Cell Mass of Mouse Blastocysts. Biophys J 110: 710-722.
EYIYUREKLI M, LELKES PI, BREEN DE (2007). A computational system for inves-tigating chemotaxis-based cell aggregation. In: Advances in Artificial Life. Berlin/ Heidelberg: Springer. pp 1034–1049.
FEDOSOV DA, CASWELL B, KARNIADAKIS GE (2010) Systematic coarse-graining of spectrin-level red blood cell models. Comput Methods Appl Mech Eng 199: 29-32. FERRELL JE JR (2012). Bistability, bifurcations, and Waddington’s epigenetic
land-scape. Curr Biol 22: R458-R466.
in the inner mass cells of the mouse blastocyst. Preprint in bioRxiv doi: https:// doi.org/10.1101/159301.
FOTY RA, STEINBERG MS (2004). Cadherin-mediated cell-cell adhesion and tissue segregation in relation to malignancy. Int J Dev Biol 48: 397–400.
FRUM T, HALBISEN M, WANG C, AMIRI H, ROBSON P, RALSTON A (2013) Oct4 cell autonomously promotes primitive endoderm development in the mouse blastocyst. Dev Cell 25: 610-622
FRUM T, RALSTON A (2015). Cell signaling and transcription factors regulating cell fate during formation of the mouse blastocyst. Trends Genet 31: 402-410. GARDNER TS, CANTOR CR, COLLINS JJ (2000). Construction of a genetic toggle
switch in Escherichia coli. Nature 403: 339-342.
GILLESPIE DT (1977). Exact Stochastic Simulation of Coupled Chemical Reactions.
J Phys Chem 81: 2340–2361.
GRANER F, GLAZIER JA (1992). Simulation of biological cell sorting using a two-dimensional extended Potts model. Phys Rev Lett 69: 2013–2016.
HOLMES WR, REYES DE MOCHEL NS, WANG Q, DU H, PENG T, CHIANG M, CINQUIN O, CHO K, NIE Q (2017). Gene Expression Noise Enhances Robust Organization of the Early Mammalian Blastocyst. PLoS Comput Biol 13: e1005320. HONDA H, TANEMURA M, NAGAI T (2004). A three-dimensional vertex dynamics
cell model of space-filling polyhedra simulating cell behavior in a cell aggregate.
J Theor Biol 226: 439-453.
HONDA H, MOTOSUGI N, NAGAI T, TANEMURA M, HIIRAGI T (2008). Computer simulation of emerging asymmetry in the mouse blastocyst. Development 135: 1407-1414.
HUANG S, GUO Y, MAY G, ENVER T (2007). Bifurcation dynamics in lineage-commitment in bipotent progenitor cells. Dev Biol 305: 695-713.
JEDRUSIK A, PARFITT D, GUO G, SKAMAGKI M, GRABAREK J, JOHNSON M, ROBSON P, ZERNICKA-GOETZ M (2008) Role of Cdx2 and cell polarity in cell allocation and specification of trophectoderm and inner cell mass in the mouse embryo. Genes Dev 22: 2692-2706.
KANG M, PILISZEK A, ARTUS J, HADJANTONAKIS AK (2013). FGF4 is required for lineage restriction and salt-and-pepper distribution of primitive endoderm factors but not their initial expression in the mouse. Development. 140: 267-279. KRUPINSKI P, CHICKARMANE V, PETERSON C (2011). Simulating the Mammalian Blastocyst - Molecular and Mechanical Interactions Pattern the Embryo. PLoS
Comput Biol 7: e1001128.
KRUPINSKI P, CHICKARMANE V, PETERSON C (2012). Computational multiscale modeling of embryo development. Curr Opin Genet Dev 22: 613-618. KUROTAKI Y, HATTA K, NAKAO K, NABESHIMA Y, FUJIMORI T (2007). Blastocyst
axis is specified independently of early cell lineage but aligns with the ZP shape.
Science 316: 719-723.
LANNER F (2014). Lineage specification in the early mouse embryo. Exp Cell Res 321: 32-39.
MAÎTRE JL, NIWAYAMA R, TURLIER H, NÉDÉLEC F, HIIRAGI T (2015). Pulsatile cell-autonomous contractility drives compaction in the mouse embryo. Nat Cell
Biol 17: 849–855.
MAÎTRE JL, TURLIER H, ILLUKKUMBURA R, EISMANN B, NIWAYAMA R, NÉDÉ-LEC F, HIIRAGI T (2016). Asymmetric division of contractile domains couples cell positioning and fate specification. Nature 536: 344-348.
MOJTAHEDI M, SKUPIN A, ZHOU J, CASTAÑO IG, LEONG-QUONG RY, CHANG H, TRACHANA K, GIULIANI A, HUANG S (2016). Cell Fate Decision as High-Dimensional Critical State Transition. PLoS Biol 14: e2000640.
MOTOSUGI N, BAUER T, POLANSKI Z, SOLTER D, HIIRAGI T (2005). Polarity of the mouse embryo is established at blastocyst and is not prepatterned. Genes
Dev 19: 1081-1092.
NAKUMARA T, OKAMOTO I, SASAKI K, YABUTA Y, IWATANI C, TSUCHIYA H, SEITA Y, NAKAMURA S, YAMAMOTO T, SAITOU M (2016) A developmental coordinate of pluripotency among mice, monkeys and humans. Nature 537: 57-62. NISSEN SB, PERERA M, GONZALEZ JM, MORGANI SM, JENSEN MH, SNEPPEN
K, BRICKMAN JM, TRUSINA A (2017). Four simple rules that are sufficient to generate the mammalian blastocyst. PLoS Biol 15: e2000737.
NEWMAN T (2005) Modelling multicellular systems using subcellular elements. Math.
Biosci. Eng. 2: 611-622.
NIWA H, TOYOOKA Y, SHIMOSATO D, STRUMPF D, TAKAHASHI K, YAGI R, ROS-SANT J (2005). Interaction between Oct3/4 and Cdx2 determines trophectoderm differentiation. Cell 123: 917-929.
PALSSON E (2008). A 3-d model used to explore how cell adhesion and stiffness affect cell sorting and movement in multicellular systems. J Theor Biol 254: 1–13. PETROPOULOS S, EDSGARD D, REINIUS B, DENG Q, PANULA S, CODELUPPI S, PLAZA REYES A, LINNARSSON S, SANDBERG R, LANNER F (2016) Singel-cell RNA-seq reveals lineage and X chromosome dynamics in human preimplantation embryos. Cell 165: 1012-1026.
RALSTON A, ROSSANT J (2008). Cdx2 acts downstream of cell polarization to cell-autonomously promote trophectoderm fate in the early mouse embryo. Dev
Biol 313: 614-629.
RICHARD A, BOULLU L, HERBACH U, BONNAFOUX A, MORIN V, VALLIN E, GUIL-LEMIN A, PAPILI GAO N, GUNAWAN R, COSETTE J, ARNAUD O, KUPIEC JJ, ESPINASSE T, GONIN-GIRAUD S, GANDRILLON O (2016). Single-Cell-Based Analysis Highlights a Surge in Cell-to-Cell Molecular Variability Preceding Ir-reversible Commitment in a Differentiation Process. PLoS Biol 14: e1002585. RIVERA-PÉREZ JA, HADJANTONAKIS AK (2014). The Dynamics of Morphogenesis
in the Early Mouse Embryo. Cold Spring Harb Perspect Biol 7: a015867. ROSSANT J. (2016) Making the mouse blastocyst: past, present and future. Curr
Top Dev Biol 117: 275-288.
SASAKI H (2015). Position- and polarity-dependent Hippo signaling regulates cell fates in preimplantantion mouse embryos. Sem Cell Dev Biol 47-48: 80-87. SASAKI H (2017). Roles and regulations of Hippo signaling during preimplantation
mouse development. Dev Growth Differ 59: 12-20.
SCHRÖTER C, RUÉ P, MACKENZIE JP, MARTINEZ ARIAS A. (2015). FGF/MAPK signaling sets the switching threshold of a bistable circuit controlling cell fate decisions in embryonic stem cells. Development 142: 4205-4216.
SKAMAGKI M, WICHER K, JEDRUSIK A, GANGULY S, ZERNICKA-GOETZ M (2013) Asymmetric localization of Cdx2 mRNA during the first cell-fate decision in early mouse development. Cell Rep. 3: 442-457.
SONEJI S, HUANG S, LOOSE M, DONALDSON I, PATIENT R, GÖTTGENS B, ENVER T, MAY G (2007) Inference, validation and dynamic modeling of transcrip-tion networks in multipotent hematopoietic cells. Ann. NY. Acad Sci. 106: 30-40. SWAT M, THOMAS G, BELMONTE J, SHIRINIFARD A, HMELJAK D, GLAZIER
J (2012) Multi-scale modeling of tissues using CompuCell3D. Meth. Cell Biol. 110: 325-366.
THOMAS R, KAUFMAN M (2001). Multistationarity, the basis of cell differentiation and memory. I. Structural conditions of multistationarity and other nontrivial behavior. Chaos 11: 170-179.
TOSENBERGER A, SALNIKOV V, BESSONOV N, BABUSHKINA E, VOLPERT V (2011). Particle Dynamics Methods of Blood Flow Simulations. Math Model Nat
Phenom 6: 320-332.
TOSENBERGER A, GONZE D, BESSONNARD S, COHEN-TANNOUDJI M, CHAZAUD C, DUPONT G (2017). A multiscale model of early cell lineage specification includ-ing cell division. NPJ Syst Biol Appl 3.
VASIEVA O, RASOLONJANAHARY M, VASIEV B (2013) Mathematical modelling in developmental biology. Reproduction 145: R175-R184.
WHITE M, ZENKER J, BISSIERE S, PLACHTA N (2018). Instructions for assembling the early mammalian embryo. Dev Cell 45: 667-679.
WU G, GENTILE L, FUCHIKAMI T, SUTTER J, PSATHAKI K, ESTEVES TC, ARAÚZO-BRAVO MJ, ORTMEIER C, VERBERK G, ABE K, SCHÖLER HR. (2010) Initiation of trophectoderm lineage specification in mouse embryos is independent of Cdx2.
Development 137: 4159-4169.
ZHOU J, HUANG S (2011) Understanding gene circuits at cell-fate branch points for rational cell reprogramming. Trends Genet. 27: 55-62.
GRABAREK J, ZYZYNSKA K, SAIZ N, PILISZEK A, FRANKENBERG S, NICHOLS J, HADJANTONAKIS A-K, PLUSA B. (2012) Differential plasticity of epiblast and primitive endoderm precursors within the ICM of the early mouse embryo.
Early mammalian embryo: my love. An interview with Andrzej K. Tarkowski
Marek Maleszewski and Andrzej K. Tarkowski Int. J. Dev. Biol. (2008) 52: 163-169
https://doi.org/10.1387/ijdb.072377mm
Size regulation does not cause the composition of mouse chimaeras to become unbalanced
P C Tang and J D West
Int. J. Dev. Biol. (2001) 45: 583-590
http://www.intjdevbiol.com/web/paper/11417902
Epigenetic reprogramming of the genome--from the germ line to the embryo and back again
K L Arney, S Erhardt, R A Drewell and M A Surani Int. J. Dev. Biol. (2001) 45: 533-540
http://www.intjdevbiol.com/web/paper/11417896
A history of mammalian embryological research
H Alexandre
Int. J. Dev. Biol. (2001) 45: 457-467
http://www.intjdevbiol.com/web/paper/11417885
Postimplantation mouse development: whole embryo culture and micro-manipulation
P P Tam
Int. J. Dev. Biol. (1998) 42: 895-902
http://www.intjdevbiol.com/web/paper/9853819
Reflections on the culture of the preimplantation embryo
J D Biggers
Int. J. Dev. Biol. (1998) 42: 879-884
http://www.intjdevbiol.com/web/paper/9853817
Egg culture: the foundation
R E Hammer
Int. J. Dev. Biol. (1998) 42: 833-839