APPLICATION OF CENTRAL COMPOSITE DESIGN FOR OPTIMIZATION OF EFFERVESCENT
FLOATING TABLETS USING HYDROPHILIC POLYMERS
SNEHAMAYEE MOHAPATRA
1, SUNIT KUMAR SAHOO
2, RAJAT KUMAR KAR
3*
The aim of this study was to optimize effervescent floating tablets of cefixime trihydrate as model drug by optimization of polymers concentration using central composite design. Mean dissolution time (MDT), time required to release 50% of drug (t50%), drug release at 2 hrs (R2 hrs) and dissolution
efficiency in 2 hrs (DE2 hrs) were taken as target responses, whereas the quantity of different polymers such as carbopol 934P (viscoelastic agent),
sodium carboxymethylcellulose (Sod.CMC) (swelling agent) were considered as independent variables. A second-order polynomial equation was determined by the multiple regression analysis of the experimental data. The best fitting model was selected based on the comparisons of the coefficient of determination (r2), adjusted the coefficient of determination (adj. r2). In addition, analysis of Variance was used to evaluate the statistical
significance of the quadratic polynomial model. The optimum values for the critical components were obtained as 13.151% carbopol 934P and 4.08% of Sod.CMC with predicted value of 4.926 hrs MDT, 5.257 hrs t50%, 27.6316% R2hrs and 16.5951% DE2hrs from desirability and overlay plot. Further,
the reliability of the model was checked by validating the observed responses from optimized formula. The drug release from characteristics of all formulations followed Higuchi model with a non-Fickian diffusion mechanism. Further, the data of Fourier-transform infrared study showed there was no interaction of drug and excipients used for the preparation of floating tablets.
Keywords: Central composite design, Cefixime trihydrate, Mean dissolution time, Fickian diffusion, Dissolution efficiency.
INTRODUCTION
Hydrodynamically balanced systems (HBS) are the important tools to retain the drug in the gastric region for several hours and assist in improving controlled delivery of orally administered drugs that have an absorption window in a definite region of the gastrointestinal tract (GIT) [1]. Optimum bioavailability is obtained from this system by continuous release of drug before it reaches the absorption window.
Several approaches has been reported for gastric retention of the dosage form like, mucoadhesive [2], floating, sedimentation [3], expansion and modified shape system [4], magnetic systems, super porous hydrogels [5]. Out of these gastric floating drug delivery system is one of the emerging trend for enhancing the bioavailability of drugs which have of a narrow absorption window in the upper part of the GIT [6].
Present investigation emphasized on the optimization of HBS of cefixime trihydrate (CT) as model drug with changing the polymers concentration. CT with pKa value of 2.5, a weak acid, which will remain unionized at acidic pH thus increases absorption in the stomach region. The absolute bioavailability of all newer oral cephalosporin is below 50-60%, which suggests an absorption mechanism through the mucosa with limited capacity [7]. The biological half-life is 3.0±0.4 hrs. Formulation of floating tablet containing CT as a drug candidate, which would remain in stomach or upper part of GIT for a prolonged period of time, therefore, the maximum drug release is maintained at desired site.
The purpose of this study was to systematically investigate the impact of several formulation variables on drug release and buoyancy properties of gastric floating tablet using central composite design (CCD). The responses such as mean dissolution time (MDT), time required releasing 50% of drug (t50%), drug release at 2 hrs (R2hrs) and dissolution
efficiency in 2 hrs (DE2hrs) depend on the product. The ranges of these
formulation variables were chosen based on the results obtained in
information to get optimized formulation with the possible interactions of the selected independent variables on the dependent variables.
METHODS
CT was generously gifted by Lincon Pharmaceutical, India. Carbopol 934P, sodium bicarbonate and sodium carboxymethylcellulose (Sod. CMC) were provided by Cipla Ltd., India. Lactose and magnesium stearate were supplied by Loba Chem, India.
Design of experiment
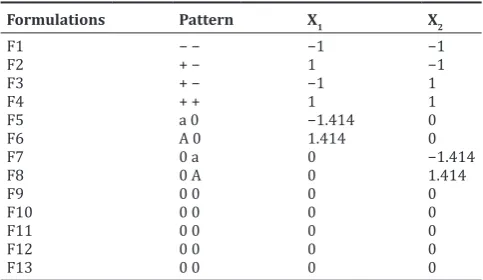
CCD was used for optimization of the formulations. In the present
investigation a two-factor (X1, X2), two-level (−1, +1) design was
developed by inclusion of a central point (Table 1). Further for a
two-factor design, the domain becomes five central point (α=0) a circle centered on (0,0) and passing through the four factorial points (−,−), (−,+), (+,−) and (+,+), and four axial points (a,0), (A,0) and (0,a) and
(0,A) leading to total 13 number of experiments was employed for the optimization of the two chosen variables (Table 2).
Second degree polynomials, equation 1, which includes all interaction terms, were used to calculate the predicted response.
Y =β0+ β β β
i=1 n
i i
i=1 n
ii i2
i,j=1 n
ij i j
X+ X + X X
∑ ∑
∑
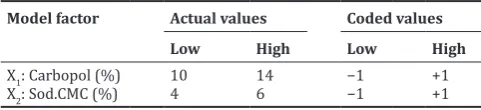
, (1)Table 1: Selected factor levels for the experimental design used in the formulation of floating tablets
Model factor Actual values Coded values
Low High Low High
X1: Carbopol (%) 10 14 −1 +1
X2: Sod.CMC (%) 4 6 −1 +1
Sod.CMC: Sodium carboxymethylcellulose
ABSTRACT
1Faculty of Pharmacy, School of Pharmaceutical Sciences, Siksha ‘O’ Anusandhan University, Bhubaneswar, Odisha, India. 2Department of Pharmaceutical Sciences, Utkal University, Bhubaneswar, Odisha, India. 3Department of Pharmaceutics, Dadhichi
College Pharmacy, Cuttack, Odisha, India. Email: [email protected] Received: 01 July 2014, Revised and Accepted: 09 December 2014
Where Y represents the response variable, β0 is the interception
coefficient, βi coefficient of the linear effect, βjj the coefficient of
quadratic effect and βij coefficient of interaction effect. X1 and X2 stand
for the main effect; X1 X2 are the interaction terms, and show how
response changes when two factors are simultaneously changed. X12,
X22 are quadratic terms of the independent variables to evaluate the
non-linearity.
The two independent formulation variables evaluated were:
X1: Carbopol (%); X2: Sod.CMC (%)
The response variables evaluated were:
Y1: MDT; Y2: Time required for 50% of drug release (t50%); Y3: Drug R2hrs;
Y4: Dissolution efficacy at 2 hrs (DE2hrs).
Drug-excipient compatibility
The infrared spectra of pure drug (CA), binary mixture of drug and each excipient (1:1) were recorded between 400/cm and 4000/cm by Fourier-transform infrared (FT-IR) spectrophotometer (VT-662, Jasco) using KBr pellet technique.
Tablet preparation
The tablet excipients were chosen after comprehensive drug excipient interaction studies. All the tablets were prepared by direct compression method. Formulations were prepared by varying drug to polymer ratio and keeping other ingredients such as sodium bicarbonate (15%) and lactose in required quantities to make the final weight of 400 mg/tablet. Briefly, preparation of tablets involved, passing all the ingredients except magnesium stearate through sieve #40 and mixing the blend in geometric mixing. Magnesium stearate was used for lubrication after passing through sieve #60. The lubricated powder mixture was compressed on a 10 station rotary tablet machine (Rimek, Minipress-I, Ahmadabad) using a 10 mm standard flat-face punch.
Evaluation of tablets
The prepared tablets were evaluated for parameters such as hardness, friability, weight variation, drug content etc. in accordance with the official method described in Indian pharmacopeia, 1996 [8]. Further other parameters such as in vitro drug release, in vitro floating lag time and the total buoyancy time, were also evaluated.
In vitro buoyancy study
The in vitro buoyancy of the gastroretentive floating tablets was determined in triplicate as the floating lag time and total floating time in accordance with the method described by Ozdemir et al., 2000 [9]. The tablet was placed in a dissolution flask with 400 ml of simulated gastric fluid maintained at 37±0.5°C. Subsequently, the time taken by
tablet to move from the bottom to the top of the flask, in minutes, was measured. Duration of buoyancy was observed simultaneously when the dissolution studies were carried out. The time taken by the tablet to rise to the surface of the dissolution media and time taken for it to sink was noted, the difference of which gives the duration of buoyancy.
In vitro drug release
In vitro drug release studies for all the formulations were carried out using the tablet dissolution test apparatus (USP TDT 06PL, Electrolab). The dissolution medium used was simulated gastric fluid pH 1.2 (without enzymes) maintained at 37±0.5°C with rotation speed of 50 rpm. Aliquots were withdrawn at 1 hr intervals for 12 hrs, filtered, suitably diluted and analyzed by spectrophotometer (V-670, Jasco) at 278 nm for cumulative drug release. The dissolution studies were conducted in triplicates and the mean values were plotted against time.
Drug release kinetics
To analyze the mechanism of drug release and release rate kinetics from the dosage form, the data obtained were fitted into zero order, first order, and Higuchi’s model using Microsoft Office Excel 2007. Moreover, mechanism of drug release from the intact tablets was determined from the Korsmeyer–Peppas equation, equation 2.
Mt/M∞=Ktn (2)
The exponent “n” indicates the mechanism of drug release calculated through the slope of the straight line. Where Mt/M∞ are the fractional
solute released, t is the released time; K is the kinetic constant of drug polymer system and “n” is an exponent that characterizes the
mechanism of drug release. If the exponent n=0.45, then the drug
release follows the Fickian diffusion and if 0.45<n<0.85 then it is said to be non-Fickian or anomalous release [10].
Further several model-independent parameters such as MDT and DE were also used as responses for optimization of the product. The MDT values were calculated in accordance with the equation 3, described by Costa and Sousa Lobo, 2001 [11].
MDT
Where jis the sample number, nis the number of dissolution sample times,tˆj is the time at midpoint between tjand tj−1 (easily calculated
with the expression, (tj+tj−1)/2) and ∆Mjis the additional amount of
drug released between tjand tj−1.
The DE of a pharmaceutical dosage form is defined as the area under the dissolution curve up to certain time t, expressed as % of the area of the rectangle described by 100% dissolution in the same time [12]. It can be calculated by the following equation:
D.E.= ×
The statistical analysis of the experimental batch was performed by multiple regression analysis using JMP version 11 (SAS) software. The coefficient of determination (r2) and adjusted coefficient of
determination (adj. r2) were compared for best fitting of the model.
The effect of formulation variables on the responses were statically evaluated by applying two-way analysis of variance (ANOVA) at Table 2: Presentation of real values of two levels for the CCD
Formulations Pattern X1 X2
F1 − − −1 −1
(The column called pattern identifies the coding of the factors. It shows all the
coding with “+” for high, “−” for low factor, “a” and “A” for low and high axial
0.05 levels. The optimum levels of the selected variables were obtained by solving the regression equation and analyzing the desirability and overlay plot.
RESULTS AND DISCUSSION Drug-excipient compatibility
The IR spectra of CT showed the characteristic absorption peaks at 3563.81/cm for O-H stretching, 3293.75/cm for N-H stretching,
1770/cm for C=O stretching, 1670.05/cm for C=C alkenes and 1541/cm
for N-O (nitro compounds) etc. The IR spectra of physical mixture also showed the above mentioned bands of CT of respective functional groups. From the data, it was concluded that there was no interaction with the excipients used in the formulation. The FT-IR spectra of CT, binary mixture (1:1) of CT with each excipient are shown in Fig. 1.
Physical properties of the compressed floating tablet
The physical evaluation of the tablets revealed hardness values between 5 and 8.5 kg/cm2 and low friability values (below 0.9%) across
all formulations indicated that the tablets had sufficient mechanical strength. Further uniform thickness and weight of all the tablets were observed because of low % relative standard deviation values. In all the formulations, the drug content was found to be uniform among the different batches of tablets, and ranged from 97.88±1.92 to 101.55±2.01% which is the acceptable pharmacopeia limits.
In vitro buoyancy measurement
The floating lag time for formulations containing carbopol and Sod.CMC were found to be 5-10 minutes, with total floating time more than 10 hrs (Table 3). Carbopol has the significant role in floating characteristic due to its high water swallability. Further it was revealed that as the concentration of polymer increased, the floating lag time decreased due to the more imbibitions of water on the surface of the tablet and the total floating time increased due to swelling of the tablet which keeps it intact for a longer period of time [13].
In vitro drug release studies
A rigorous study of dissolution profile for all the formulations gave an insight into the effect of polymeric fillers on release profile of the formulations. From the release profiles, it was observed that the variation in grade of polymer and its concentration from F1 to F13 had a variable effect on drug release shown in the Fig. 2. From these data it was illustrated that, concentration of carbopol has the significant (p<0.05) role in drug release characteristics. At 10% carbopol level (F1) the drug release was found to be more than 100%. However in F2 formulation, containing 14% of the above polymer the drug release was decreased significantly (p<0.0.5) to 83%. This might be due to the closing of the microspores and a reduction in the regions of low micro-viscosity in the swollen tablet. Moreover increase in the molecular volume of the hydrated polymer that reduces the free volume due to the presence of the microspores. This effect may manifest itself as a shift in the drug release mechanism. This is in accordance with the results obtained by Durrani et al., 1992 [14] and several other authors who have studied the impact of concentration on dissolution kinetics [15].
Further it was found that, Sod.CMC has the significant role in drug release characteristics which was depicted in formulation F1 and F3. This could be attributed by increasing the gelling characteristics of the above polymer caused more viscous gel and formed an entangled network reduce the pores of the tablet.
Similar fashion of release characteristics (increasing/decreasing) was observed in rest of the formulations (F4-F13), which are in accordance with the concentration of both the polymers.
Drug release kinetics
The mechanism of release for the above formulations was determined by finding the R2 value for each kinetic model like, zero-order, first-order,
Higuchi etc. corresponding to the release data of each formulation, given in Table 4. For all most all the formulations the R2 value of Higuchi’s
model is very near to one than the R2 values of other kinetic models.
Thus, it can be said that the drug release follows Higuchi’s release mechanism. Further the ‘n’ values of Korsmeyer–Peppas model for the best formulations were in the range of 0.55-0.65. Therefore, the most probable mechanism of release was non-Fickian diffusion or anomalous diffusion. However, the above parameter is very close approximation to 0.49 reflecting diffusion predominant characteristics of drug release.
Fig. 1: Fourier-transform infrared spectra of drug and excipients. I. Pure drug: (a) Cefixime trihydrate (CT) pure drug. II. Binary mixtures of CT with various excipients: (b) carbopol, (c) sodium
carboxymethylcellulose, (d) sodium bi carbonate, (e) lactose, (f) magnesium stearate
Fig. 2: Dissolution profile of different floating tablets
Table 3: Summary of experimental responses of the formulations in CCD
F1 4.561 4.15 31.01 18.3 9 >11
F2 5.225 4.5 27.889 15.793 8 >11
F3 5.05 5.8 24.55 14.358 5 11
F4 4.999 6.09 22.836 12.994 5 10
F5 4.57 4.25 30.414 17.732 10 >11
F6 5.03 6.16 22.25 12.5634 5 10
F7 4.82 4.79 29.67 17.763 7 11
F8 4.96 5.05 28.069 12.5634 6 11
F9 4.88 4.93 28.88 16.648 6 >11
F10 4.82 4.89 29.26 17.23 5 >11
F11 4.81 4.86 29.573 17.74 5 11
F12 4.67 4.7 31.072 19.13 6 11
F13 4.678 4.6 31.823 20.209 5 >11
F14 4.982 4.982 4.982 4.982 6 >11
The response dependent variables such as, t50%, R2hrs were found by
fitting of the release data to the Krosmeyer–Peppas equation, Table 3. However, other responses such as MDT and DE2hrs were also calculated
from the release data using Microsoft Excel. These responses were subjected to multiple regression analysis using SAS package. The best fitting model was determined by comparing several statistical parameters including the multiple correlation coefficient (R2), the
adjusted multiple correlation coefficient (adj. R2) and corresponding
p values. The fitted equations relating the responses MDT, t50%, R2hrs, and
DE2hrs to the transformed factor are shown in equation 5-8 respectively.
Y1 =4.7716 + 0.1141 X1 + 0.1013 X2 − 0.1787 X1 X2 + 0.0426 X12 + 0.0876 X22
(5)
Y2 =4.796 + 0.7426 X1 + 0.1259 X2 − 0.015 X1 X2 + 0.2226 X12 + 0.0801 X22
(6)
Y3 =30.1216 − 2.8823 X1 − 0.8873 X2 + 0.3517 X1 X2 –2.152X12 − 0.8834 X22
(7)
Y4 =18.1914 − 1.7571 X1 − 1.4039 X2 + 0.2875 X1 X2 − 1.4699 X12 − 1.4622 X22
(8)
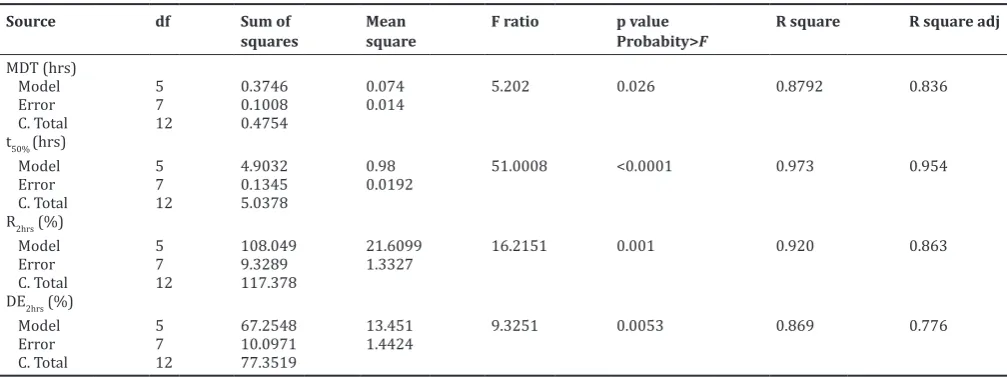
The high values of correlation coefficients (R2) for MDT,t
50%, R2hrs, and DE2hrs
were found to be 0.8792, 0.973, 0.92 and 0.869 respectively (Table 5), which was approaching to one indicating the good model characteristics.
Moreover, the low determination coefficient value for MDT and DE2hrs
indicated that more than 10% of total variations (12.08, 13.1) were not explained by the model, however in case of t50%, R2hrs, it was <10% (0.027,
0.08). Further the values of the adjusted correlation coefficients (adj. R2) were also very high in supporting the high significance of the model
(i.e. good agreement between the dependent and independent variables). Moreover the model term for all the responses was found to be highly significant (p<0.05) with high F value found from ANOVA data (Table 5) indicating the adequate fitting of the surface quadratic model. The polynomial equations can be used to draw conclusions after considering the magnitude of coefficient and the mathematical sign it carries (i.e. positive or negative). The equation for MDT (equation 5) suggests that the factor X1 has more significant effect on MDT, followed by factor
X2. Therefore, a high level of factor X1 should be selected for controlling
the drug release rate. This might be due to increasing the tortuous path of the intact matrices. The high value of X1X2 coefficients also suggests that
the interaction between X1 and X2 has a significant effect on MDT. From
equation (6), it can be concluded that factor X1 has a more important role
in prolonging the t50%. The magnitude of coefficients indicates that the
factor X2 has little influence on the controlling the release characteristics.
For the responses R2hrs and DE2hrs it was found that, both the polymer
influnced the above characteristic. The negative sign indicated that, as the concetration of polymer increased R2hrs and DE2hrs decreased (equations 7
and 8). Further magnitude of coefficients indicates that the factor X1 has
a more favorable effect on the dependent variables than factor X2. From
the results of multiple linear regression analysis, it can be concluded that
Table 4: Parameters of kinetic of drug release of the formulations in CCD
Formulations Zero order First order Higuchi Peppas
K0 (hrs−1) R2 K
1 (hrs−1) R2 K hrs (hrs−1/2) R2 n
F1 8.128 0.978 0.2648 0.868 29.82 0.973 0.653
F2 6.344 0.975 0.1358 0.966 24.53 0.977 0.668
F3 8.057 0.983 0.244 0.893 30.87 0.967 0.719
F4 6.219 0.979 0.126 0.981 24.29 0.978 0.703
F5 7.995 0.982 0.257 0.877 29.81 0.976 0.658
F6 6.350 0.981 0.128 0.982 24.46 0.984 0.719
F7 6.685 0.967 0.168 0.943 26.05 0.978 0.596
F8 6.701 0.972 0.1658 0.937 25.97 0.982 0.622
F9 6.664 0.969 0.163 0.943 25.93 0.979 0.607
F10 6.716 0.970 0.168 0.943 26.07 0.979 0.599
F11 6.664 0.966 0.165 0.940 25.91 0.982 0.591
F12 6.504 0.960 0.1589 0.950 25.41 0.981 0.556
F13 6.450 0.960 0.1589 0.948 25.18 0.973 0.534
F14 6.554 0.987 0.156 0.944 26.01 0.989 0.601
CCD: Central composite design
Table 5: Summary of ANOVA for response surface of the GFT formulations
Source df Sum of
squares
Mean square
F ratio p value
Probabity>F
R square R square adj
MDT (hrs)
Model 5 0.3746 0.074 5.202 0.026 0.8792 0.836
Error 7 0.1008 0.014
C. Total 12 0.4754
t50% (hrs)
Model 5 4.9032 0.98 51.0008 <0.0001 0.973 0.954
Error 7 0.1345 0.0192
C. Total 12 5.0378
R2hrs (%)
Model 5 108.049 21.6099 16.2151 0.001 0.920 0.863
Error 7 9.3289 1.3327
C. Total 12 117.378
DE2hrs (%)
Model 5 67.2548 13.451 9.3251 0.0053 0.869 0.776
Error 7 10.0971 1.4424
C. Total 12 77.3519
Fig. 5: Prediction profiler of optimization of gastric floating tablets of cefixime trihydrate using independent variables
(desirability plot)
Fig. 6: Contour profile plot overlaying mean dissolution time (hrs), t50% (hrs), release at 2 hrs (%), and dissolution efficacy at
2 hrs (%) the drug release pattern may be changed by appropriate selection of the
X1 and X2 levels. The fitted responses for the above regression model were
illustrated in Figs. 3 and 4. Hence response surface plots are more helpful in understanding both the main and interaction effects of the two factors.
Selection of optimized batch
A numerical optimization technique based on the desirability approach was used to generate the optimum settings for the most effective formulation. The recommended concentrations of the independent variables were calculated by the JMP software with desirability 0.9658 (Fig. 5). Based on the criteria of release range, the overlay plot is presented in Fig. 6, which showed an acceptable region to meet the requirement of these responses. The optimal coded values were found
to be 0.575, −0.919 for factor X1 and X2, which produced the responses
4.926 (hrs), 5.252 (hrs), 27.631 (%), and 16.595 (%) respectively for MDT, t50%, R2hrs and DE2hrs. These coded values were converted into the
scales of the original carbopol and Sod.CMC concentration using the formula below found on page 471 of the JMP Statistics and Graphics Guide, Version 3.1:
Actual = low + 0.5 × (coded + 1) × (high-low) (9)
From the above equation carbopol and Sod.CMC were found to be 13.151% and 4.08% respectively. The final composition (F14) comprised 50% CT with 15% sodium bicarbonate, 2% magnesium stearate with the above quantity of polymers and lactose quantity sufficient to form 400 mg/tablet.
The predicted values obtained are in good agreement with experimental values confirming the practicability and validity of the model (Table 6). The curve fitting data for optimized formulation followed the Higuchi model as showing highest R2 (0.989) value. Furthermore, it is concluded
that the mechanism of drug release from the hydro dynamically balanced system follows the non-Fickian transport type.
CONCLUSION
Modified drug release attained in the current study indicates that the matrix tablets of CT, prepared using various polymers, can successfully
Fig. 3: Response surface plot showing the effect of (X1) and (X2) on
the mean dissolution time (hrs) (Y1) and t50% (hrs) (Y2)
Fig. 4: Response surface plot showing the effect of (X1) and (X2) on
drug release at 2 hrs (Y3) and dissolution efficacy at 2 hrs (Y4)
Table 6: Comparison of predicted and observed responses for the statistically optimized formulation F14
Formulations Response Observed Predicted
F14 MDT (hrs) 4.982 4.926
t50% (hrs) 5.172 5.257
R2hrs (%) 27.5316 27.631
DE2hrs (%) 16.514 16.595
MDT: Mean dissolution time, DE: Dissolution efficacy
High degree of prognosis obtained using response surface methodology (RSM) indicates that a CCD is quite efficient in optimizing drug delivery systems. The RSM was performed to optimize two polymer components to yield MDT, the time required to release 50% of drug (t50%), drug R2hrs
and dissolution efficacy at 2 hrs (DE2hrs). A highly significant quadratic
polynomial obtained by the CCD was very useful for determining the optimal concentrations of constituents that have significant effects on dependent variables production. The optimal supplementary components consisted of Carbopol and Sod.CMC was found to be 13.151% and 4.08%, respectively. Under the optimal condition, the observed value of the MDT, t50%, R2hrs, DE2hrs are 4.982 hrs, 5.172 hrs,
27.5316% and 16.514%, respectively.
ACKNOWLEDGMENT
Authors are thankful to Lincon Pharmaceutical (Ahmadabad) for providing CT, Cipla limited (Goa, India) for providing carbopol 934P, sodium bicarbonate and Sod.CMC.
REFERENCES
1. Hirtz J. The absorption of drugs in man: A review of current concepts and methods of investigation. Br J Clin Pharmacol 1985;19 Suppl 2:77S‑83. 2. Arora S, Ali J, Ahuja A, Khar RK, Baboota S. Floating drug delivery
systems: A review. AAPS Pharm SciTech 2005 19;6(3):E372‑90. 3. Ponchel G, Irache J. Specific and non‑specific bioadhesive particulate
systems for oral delivery to the gastrointestinal tract. Adv Drug Deliv Rev 1998;34(2‑3):191‑219.
4. Davis SS, Stockwell AF, Taylor MJ, Hardy JG, Whalley DR,
Wilson CG, et al. The effect of density on the gastric emptying of single‑ and multiple‑unit dosage forms. Pharm Res 1986;3(4):208‑13. 5. Moës AJ. Gastroretentive dosage forms. Crit Rev Ther Drug Carrier
Syst 1993;10(2):143‑95.
6. Fell JT, Whitehead L, Collet JH. Prolonged gastric retention using floating dosage forms. Pharm Technol 2000;24(3):82‑90.
7. Anthony CM, Osselton MD, Widdep B. Clark Analysis of Drugs and Poisons. Vol. 2. No. 3. London, UK: Pharmaceutical Press of Great Britain; 2004. p. 763‑4. 8. Indian Pharmacopoeia. New Delhi: Ministry of Health and Family
Welfare, Government of India, Controller of Publications; 1996. p. 736. 9. Ozdemir N, Ordu S, Ozkan Y. Studies of floating dosage forms
of furosemide: In vitro and in vivo evaluations of bilayer tablet formulations. Drug Dev Ind Pharm 2000;26(8):857‑66.
10. Shah KU, Khan GM. Regulating drug release behavior and kinetics from matrix tablets based on fine particle‑sized ethyl cellulose ether derivatives: An in vitro and in vivo evaluation. ScientificWorldJournal 2012;2012:842348.
11. Costa P, Sousa Lobo JM. Modeling and comparison of dissolution profiles. Eur J Pharm Sci 2001;13(2):123‑33.
12. Khan KA. The concept of dissolution efficiency. J Pharm Pharmacol 1975;27(1):48‑9.
13. Srikanthn MV, Rao NS, Sunil SA, Ram BJ, Kolapalli VR. Statistical design and evaluation of a propranolol HCl gastric floating tablet. Acta Pharm Sin B 2012;2(1):260‑9.
14. Durrani MJ, Todd R, Andrew A. Proceedings of Controlled Release
Bioactive Materials. 19th International Symposium; 1992. p. 19.411.