A new constraint for chondrule formation: condition for the rim formation of
barred-olivine textures
Hitoshi Miura1, Etsuro Yokoyama2, Ken Nagashima3, Katsuo Tsukamoto1, and Atul Srivastava1
1Department of Earth and Planetary Materials Science, Graduate School of Science, Tohoku University, Aoba 6-3, Aramaki, Aoba-ku, Sendai 980-8578, Japan
2Computer Centre, Gakushuin University, Mejiro 1-5-1, Toshima-ku, Tokyo 171-8588, Japan 3Division of Electrical, Electronic and Information Engineering, Graduate School of Enginnering,
Osaka Univerisity, Suita 565-0871, Japan
(Received October 18, 2010; Revised June 3, 2011; Accepted June 3, 2011; Online published February 2, 2012)
A barred-olivine (BO) chondrule usually has an olivine rim that covers the chondrule surface. Numerous experiments have been carried out to reproduce the BO texture. However, the rim structure could be reproduced only in a few studies reported in the literature. The difficulty in reproducing the rim structure lies in the fact that its formation condition has not been constrained experimentally or theoretically. In the present paper, we have carried out numerical simulations of crystal growth of a highly-supercooled melt droplet of pure forsteritic composition (Mg2SiO4), and succeeded in reproducing the double structure, i.e. the rim and the dendrite. The droplet cools from the surface, the temperature of which should be cooler than the center of the droplet. Since a crystal grows faster along the cooler surface than across the hotter center, the rim was found to be formed when the temperature difference between the center of the droplet and its surface is large enough. From our results, both from numerical simulations and analytical consideration, we found that the double structure of rim and the dendrite could be formed only when the cooling rate is within a narrow range, which depends upon the degree of supercooling. Our results, for the first time, could explain why the formation of rim of BO texture was hardly reproduced in the previous experiments reported in the literature to date.
Key words:Chondrule solidification texture, melt growth, supercooling, hypercooling, phase-field simulation.
1.
Introduction
Chondrules are millimeter-sized, spherical-shaped grains containing olivine, pyroxene, metal, sulfide, and glass with igneous textures. They are considered to have been formed from molten droplets about 4.6 billion years ago in the so-lar nebula (Amelin et al., 2002); it is believed that they melted and cooled again to solidify in a short period of time (Sorby, 1877; Nelson et al., 1972; Tsuchiyama et al., 1980; Lofgren and Russell, 1986; Jones and Lofgren, 1993; Osada and Tsuchiyama, 2001; Tsuchiyama et al., 2004). Since chondrules possess about 80 vol.% of chon-dritic meteorites in the most abundant cases (Joneset al., 2000), they must carry information about the early history of our solar system. Chondrules have various textures com-monly described as porphyritic, barred, and radial textures; all of these textures appear for the same chondrule bulk composition (Luxet al., 1981; Lofgren and Russell, 1986). Many authors have carried out dynamic crystallization ex-periments to constrain the formation condition of each tex-ture (Hewinset al., 2005 and references therein), however, the formation mechanism is not yet fully understood.
Barred-olivine (BO) chondrules are characterized by par-allel set(s) of olivine bars in a thin section (Weisberg, 1987).
Copyright cThe Society of Geomagnetism and Earth, Planetary and Space Sci-ences (SGEPSS); The Seismological Society of Japan; The Volcanological Society of Japan; The Geodetic Society of Japan; The Japanese Society for Planetary Sci-ences; TERRAPUB.
doi:10.5047/eps.2011.06.004
It has been considered that olivine bar crystals are actu-ally platy in three-dimensions (Tsuchiyama et al., 2000; Noguchi, 2002). A BO chondrule usually has an olivine rim that covers the chondrule surface. This olivine rim has the same crystallographic orientation as inner olivine platelets. The olivine rim has not been reproduced in early dynamic crystallization experiments except in a limited number of runs (Lofgren and Lanier, 1990; Radomsky and Hewins, 1990). Tsukamotoet al.(1999, 2001) succeeded in repro-ducing the rim structure from a forsterite melt droplet in a container-less crystallization experiment using an aero-acoustic levitation technique. They found from their in-situ observation that the droplet cooled very rapidly at a rate of
Rcool ≈ 100–1000 K s−1, and then crystallized at a large supercooling ofT ≈ 600 K within a very short period of time (less than 1 s). However, they reproduced the rim structure only in a few cases, so the formation condition was not constrained from their experiments. On the other hand, Tsuchiyamaet al.(2004) also succeeded in reproducing the rim structure by evaporation in vacuum. The cooling rate was Rcool =1000 K hr−1, which is much slower than that of the container-less experiments by about three orders of magnitude. They did not observe the solidification process of the sample in-situ, so detailed information such as the timing of nucleation, the solidification timescale, and crys-tal growth pattern were not available. They considered that the rim was formed by the rapid crystal growth along the droplet surface, which should become cooler than the
terior because of the latent heat of evaporation. However, their hypothesis has not been verified yet.
To clarify the formation condition of the rim, the crystal-lization process inside the chondrule melt droplet should be investigated. We carried out numerical simulations of crys-tallization of a highly-supercooled melt droplet with a pure forsteritic (Mg2SiO4) composition (Miuraet al., 2010). We considered the situation that a tiny crystal seeded at the droplet surface triggers crystallization of the droplet. We found that the rapid crystal growth along the droplet sur-face occurs when the cooling rate is very large. However, we did not investigate over a wide range of supercooling of the droplet in the previous paper.
The aim of this paper is to clarify the formation condi-tion of the rim structure. We carry out numerical simula-tions for a wide range of supercooling and cooling rate by using the phase-field method, which is one of the most ef-fective numerical methods to simulate crystal growth in a supercooled liquid. As a first step, we consider the situa-tion of container-less crystallizasitua-tion experiments using lev-itation methods (Tsukamotoet al., 1999, 2001; Nagashima
et al., 2006, 2008; Srivastavaet al., 2010) because in these experiments the thermal profile of the droplet and the crys-tal growth pattern were observed in-situ, so we can verify the results of our numerical simulations. For comparison, we consider a droplet of pure forsteritic (Mg2SiO4) compo-sition, which was adopted in these experiments.
Glass formation, which is expected to occur when a melt droplet cools very rapidly, is not taken into consideration in this paper. Tangemanet al.(2001) reported the first synthe-sis of a forsterite (Mg2SiO4) composition glass using con-tainerless conditions. Nagashimaet al.(2008) summarized the condition for glass formation in a Mg2SiO4-MgSiO3 system for various cooling rates (see their figure 4). Under levitated conditions, a pure forsterite melt becomes a glass when it cools at Rcool ≈ 300 K s−1 or faster. In contrast, under non-levitated conditions, an extremely large cooling rate of Rcool ≈106–107 K s−1is required for glass forma-tion because of the heterogeneous nucleaforma-tion on the contact area (e.g., sample holder). This suggests that glass forma-tion from a pure forsteritic melt is very difficult once nucle-ation occurs.
We describe the basic equation of the phase-field method in Section 2, where the basic concept of the phase-field method is summarized in Appendix A. In Section 3, we show the results of the calculation, in which various crystal growth patterns appear inside the droplet. In Section 4, we discuss the conditions for rapid crystal growth along the droplet surface and propose a new constraint for chondrule formation, especially, for barred-olivine chondrules. We present some conclusions in Section 5.
2.
Method
2.1 Basic equations
We employ the phase-field method for the crystallization of a pure material from its melt (model I in Wanget al., 1993). In their model, the solid and liquid phases were distinguished by φ = 0 and φ = 1, respectively. We adopt the same basic equations as those used in our previous paper, in which the cooling term at the droplet surface was
taken into consideration (Miura et al., 2010). The time evolutions of phaseφand temperatureT are given by
W respectively, where μ is the kinetic coefficient (see Eq. (A.5)),TM is the equilibrium melting point, ≡σ/L is the capillary length,σ is the interfacial free energy be-tween crystal and liquid, L is the latent heat of crystal-lization per unit volume, W is the thickness of the solid-liquid interface,cis the volumetric heat capacity per unit volume, andκ is the thermal conductivity. Functions p(φ)
andg(φ)are given by p(φ) = φ3(10−15φ+6φ2)and
g(φ) = φ2(1−φ)2, respectively, and the prime indicates the derivative byφ. Equation (2) can be obtained by in-tegrating a time-dependent thermal diffusion equation over a small volume element V having a boundary A and then applying Gauss’s theorem (Miuraet al., 2010). Asis an in-tersection of the boundary A and the droplet surface if such a surface exists.nis the outward pointing unit normal of the boundaryda. The second term of Eq. (2) represents the en-ergy loss at the droplet surface caused by thermal radiation, thermal conduction with ambient nebula gas, and latent heat of evaporation, whereqsis the net heat flux.
Although one could introduce anisotropies inμ and σ to express an anisotropic interface and to simulate facet for-mation (McFaddenet al., 1993; Uehara and Sekerka, 2003), for simplicity we do not take anisotropy into account.
The governing equation of phaseφ, Eq. (1), was derived from an entropy function to satisfy the entropy production being positive in any small volume element (Wanget al., 1993). The details of the derivation will be found in the reference. We briefly describe the physical meaning of Eq. (1) in Appendix A.
2.2 Numerical scheme
Chondrules are dimensional spherules, so a three-dimensional calculation is desirable. However, this requires an unrealistically large number of computational nodes for a chondrule-sized object (∼109μm3). To reduce the com-putational cost, we consider a two-dimensional disk in the
x y-plane (circle but not a sphere), assume uniformity in the
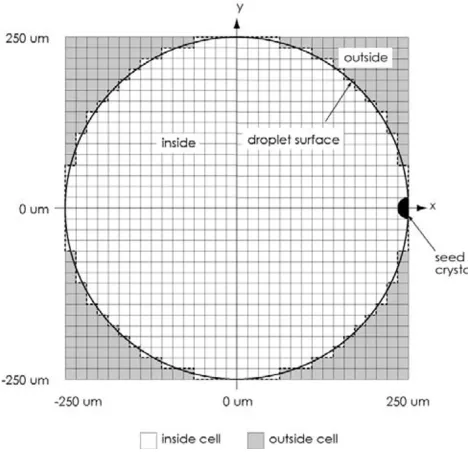
z-direction and drop the derivative by z. Figure 1 shows a schematic picture of the square mesh used for computation. We adopt a computational domain of−250≤x≤250μm and−250≤ y≤250μm to consider a droplet of 250μm in radius, and discretized by a 1000×1000 square mesh (mesh sizes forx- and y-directions are x = y = 0.5 μm). Other numerical procedures are the same as Miuraet al.(2010).
We carried out a convergence test with smaller mesh sizes ofx = y = 0.25μm, and found that the calculation
result was not modified except for minor changes in the shapes of dendrite tips.
Fig. 1. Two-dimensional square mesh for computation. The thick solid curve is theactualsurface of droplet. The computational cells inside (white) and outside (gray) theactualsurface are defined by whether po-sitions of their centers locate the inside or outside, respectively. The
computationalsurface (thick dashed lines) is the mesh boundaries be-tween inside cells and outside cells. The crystal growth is triggered by a seed crystal at the droplet surface.
of the calculation, we substituteφ=0 only at the seeding point without any change in temperature (see Fig. 2(a), for example). The radius of the seed crystal is assumed to be 10μm.
2.3 Initial temperature profile
In this paper, we suppose that a completely-molten melt droplet cools rapidly from the surface. Due to the surface cooling, the droplet surface is cooler than the center. The temperature profile inside the droplet is given by an ana-lytic solution of the thermal diffusion equation assuming a uniform cooling (∂T/∂t does not depend onr) and a con-stant value ofqs(Miuraet al., 2010). The analytic solution is given by
T0(r)=Ts,0+δTc−s,0
1−
r rd
2
, (3)
whereTs,0is the temperature at the droplet surface,rdis the droplet radius, and
δTc−s,0=
qsrd 2κL
(4)
is the temperature difference between the center and surface of the droplet with the thermal conductivity of the liquid phase equal toκL. The subscript “0” meanst =0, namely, at the time when the seeding occurs.
2.4 Physical properties of forsterite sample
In this study, we consider the sample of pure forsteritic composition. The physical properties we adopted are as follows;c=5.7×10⁷erg cm−3K−1,L =2.4×10¹⁰erg cm−3,T
M =2163 K (Nagashimaet al., 2006, 2008),κC= 5.0×10⁵erg cm−1 K−1s−1 (Pertermann and Hofmeister,
2006),κL =2.0×10⁵erg cm−1K−1 s−1(Moriya, 1963),
σ = 620 erg cm−2 (Tanaka et al., 2008), μ = 0.4 cm s−1K−1 (Tsukamotoet al., 1999, 2001; Nagashimaet al., 2006), and W = 0.25 μm (Murray et al., 1995), where
κC is the thermal conductivity of the crystal phase. These parameters are the same as those adopted in Miuraet al.
(2010).
2.5 Input parameters
2.5.1 Heat flux at droplet surface qs Let us
esti-mate the heat fluxqsat the droplet surface from container-less crystallization experiments (Tsukamoto et al., 1999; Nagashimaet al., 2006, 2008). Samples were melted dur-ing levitation usdur-ing a CO2laser and then quenched by turn-ing off the laser (Tsukamotoet al., 1999). In this case, the droplet cools at a maximum rate due to the thermal radia-tion and the heat conducradia-tion by the gas-jet (Nagashimaet al., 2008). The cooling rate can be controlled to be slower by adjusting the output power of the laser (Nagashimaet al., 2006).
The net heat flux at the droplet surface determines the cooling rate of the dropletRcool. The heat fluxqsis calcu-lated by (Miuraet al., 2010)
qs=crdRcool/3. (5)
In Table 1, we summarize the cooling rateRcooland the heat fluxqsexpected in container-less experiments. In this table, we usec of a pure forsteritic melt (see Section 2.4). The typical heat flux is found to be qs ≈ 108–109 erg cm−2 s−1. Based on Table 1, we adopt the following values;
qs=5×10⁸, 1×10⁹, 2×10⁹, 5×10⁹, 1×10¹⁰erg cm−2s−1. The smallest value is the same order of magnitude to that estimated from the container-less experiments. The reason why we consider largerqsvalues is to see how the growth pattern changes at such an extremely large cooling rate.
2.5.2 Supercooling at droplet surface T s,0 The
molten droplet becomes largely supercooled by a few hun-dred K or more in the container-less environment (Nelsonet al., 1972; Tsukamotoet al., 1999; Nagashimaet al., 2006, 2008; Tanakaet al., 2008). Tsukamotoet al.(1999) carried out container-less crystallization experiments by using an aero-acoustic levitator and observed a forsterite melt droplet being supercooled by T ≈ 600 K at a cooling rate of
Rcool≈400 K s−1. Nagashimaet al.(2006) adopted a gas-jet levitator and observed a forsterite melt droplet being su-percooled byT ≈1000 K at a cooling rate ofRcool≈100 K s−1. Tanakaet al.(2008) modeled the homogeneous nu-cleation and sequential crystal growth inside a supercooled melt droplet based on classical nucleation theory and found that a forsterite melt droplet should be supercooled by about 1000 K even if it cools at a much smaller cooling rate, e.g.,
Rcool=10−2K s−1.
Table 1. Cooling rateRcoolof molten droplet in container-less crystallization experiments using levitation methods. We readRcoolfrom each cooling curve obtained at each experiment just before the droplet crystallized. We calculate the heat fluxqsand the initial temperature difference between the center and surface of the dropletδTc−s,0by using Eqs. (5) and (4), respectively. Refs: [1] Tsukamotoet al.(2001), [2] Nagashimaet al.(2006), [3]
Nagashimaet al.(2008).
Sample Radius Cooling rate Heat flux Temp. diff. Levitation Ref.
composition rd[μm] Rcool[K s−1] qs[erg cm−2s−1] δTc
−s,0[K] method
forsterite ≈1000 ≈350 ≈6.7×10⁸ ≈170 aero-acoustic [1]
forsterite ≈1000 ≈50 ≈1.0×10⁸ ≈25 gas-jet [2]
forsterite ≈1000 ≈70 ≈1.3×10⁸ ≈10 gas-jet [3]
Mg1.8SiO3.8 ≈1000 ≈30–40 ≈(0.6–0.8)×108 ≈5 gas-jet [3]
Here, we introduce a hypercooling limitThyp defined by (Glicksman and Schaefer, 1967; Herlach, 1994);
Thyp=L/c. (6)
The crystallization process from a highly supercooled melt changes drastically when the supercooling exceedsThyp. WhenT < Thyp, crystallization takes place by a two-step process. Once nucleation has initiated solidification, the subsequent growth of the solid phase leads to the re-lease of the latent heat of crystallization. In the case of rapid crystal growth, a steep rise in temperature will oc-cur, termed recalescence, which takes place under near-adiabatic conditions. After recalescence, some fraction of the liquid phase still remains. The remaining liquid will so-lidify under near-equilibrium conditions as the latent heat is removed. The latter step was termed a “filling-in” process (Chalmers, 1964). On the other hand, whenT > Thyp, the supercooled melt solidifies exclusively during recales-cence, so there is no remaining liquid because the droplet temperature during recalescence does not exceed the melt-ing point. The hypercoolmelt-ing limit of a pure forsterite melt isThyp=425 K (Nagashimaet al., 2006).
3.
Result
3.1 Dendritic growth
Figure 2 shows a result of phase-field simulation for
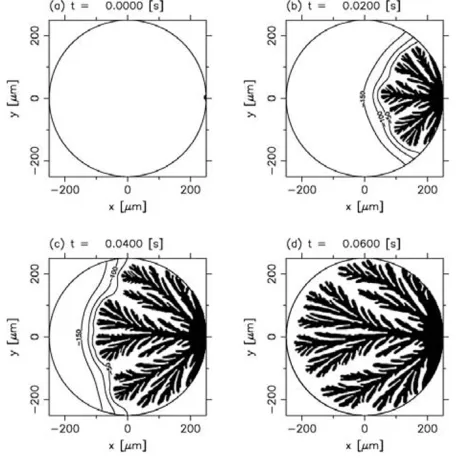
Ts,0=200 K (Ts,0=1963 K) andqs=5×10⁸erg cm−2 s−1. This is a gray contour map of the phase value ranging fromφ = 0 (solid phase, black) toφ = 1 (liquid phase, white). The transition layer between the solid and liquid is too thin to distinguish in this map, meaning that the solid-liquid interface is very sharp. At the beginning, there is a tiny seed crystal on the right hand side at the droplet surface (panel (a)). At 0.02 s after seeding, a dendritic crystal grows from the seed crystal (panel (b)). The temperature distribu-tion is shown by isothermal lines in terms ofT−TM. Crystal growth is accompanied by release of the latent heat of crys-tallization, so the temperature around the dendritic crystal increases up to almost the melting point. On the other hand, the supercooling far from the dendritic crystal is still large, resulting in a steep temperature gradient ahead of the grow-ing dendrite tips. The dendritic crystal is spreadgrow-ing into the entire region inside the droplet (panel (c)). Around 0.06 s after seeding, the rapid dendritic crystal growth comes to a stop because the temperature inside the droplet increases to the melting point (panel (d)). It is found that a liquid phase still remains at the gap between dendrite tips. Finally, the remaining liquid solidifies completely as the latent heat of
Fig. 2. Result of phase-field simulation for Ts,0 = 200 K and qs =5×10⁸erg cm−2s−1. A circle of 250μm in radius is the ex-ternal shape of droplet and the target of the calculation is only inside the circle. Black and white regions represent crystal and liquid phases, respectively. The temperature distribution is shown by contours with labels indicatingT−TM, namely, negative and positive labels mean supercooled and above melting point, respectively. The interval of the isotherms is 50 K. The initial condition (a), andt =0.02 s (b), 0.04 s (c), and 0.06 s (d) after seeding.
crystallization is removed by the surface cooling. It took 0.42 s to solidify completely. The luminosity of the droplet increases rapidly from panel (a) to (d), and then decreases gradually (Miuraet al., 2010).
3.2 Dendritic growth with rim structure
Figure 3 shows a result forTs,0 =300 K (Ts,0 =1863 K) andqs =2×10⁹erg cm−2s−1. At the beginning, one can see concentric isothermal lines ofT0−TM = −250 K and−200 K (panel (a)), meaning that there is a large tem-perature difference between the center and surface of the droplet. The temperature difference calculated by Eq. (4) is
crys-Fig. 3. Result of phase-field simulation for Ts,0 = 300 K and qs =2×10⁹erg cm−2s−1. The initial condition (a), andt =0.008 s (b), 0.016 s (c), and 0.024 s (d) after seeding. Others are the same as Fig. 2.
tal is growing rapidly along the droplet surface (panel (d)). The crystal along the droplet surface is one of the branches of the dendritic crystal, and it seems to be surrounding the droplet like the rim of a BO chondrule.
3.3 Rim growth
Figure 4 shows a result forTs,0 =400 K (Ts,0 =1763 K) andqs = 1×10¹⁰ erg cm−2 s−1. One can see dense concentric isotherms at the beginning (panel (a)). The tem-perature difference between the center and surface is calcu-lated to beδTc−s,0 =625 K from Eq. (4). The inner most isotherm is T0 −TM = 200 K, indicating a temperature above the melting point. The crystal growth pattern is com-pletely different from Figs. 2 and 3. No dendritic crystal grows inside the droplet (panel (b)). The crystal grows only along the droplet surface where the temperature is below the melting point. At 0.016 s after seeding, almost of all of the droplet surface is covered with the crystal (panel (c)). There is liquid remaining inside the crystal rim (panel (d)). The remaining liquid gradually solidifies from the outside to the inside as the latent heat of crystallization is removed through the shell crystal.
3.4 Parallel dendritic growth
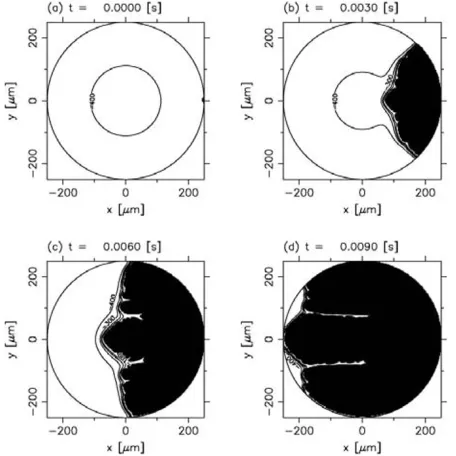
Figure 5 shows a result forTs,0 =500 K (Ts,0 =1663 K) andqs=2×10⁹erg cm−2s−1. The temperature differ-ence between the center and surface of the droplet is calcu-lated asδTc−s,0 = 125 K, so the temperature at the center (T0−TM= −375 K) is 375 K below the melting point. Note that the temperature distribution can be divided into two re-gions; a hypercooled region along the surface, and normally supercooled at the central region, where “normally” means that the supercooling does not exceed the hypercooling limit
Thyp(see Eq. (6)). The seed crystal grows isotropically at first (panel (b)). However, when the crystal-liquid interface
Fig. 4. Result of phase-field simulation for Ts,0 = 400 K and qs = 1×10¹⁰erg cm−2 s−1. The interval of the isotherms is 100 K. The initial condition (a), andt=0.008 s (b), 0.016 s (c), and 0.024 s (d) after seeding. Others are the same as Fig. 2.
Fig. 5. Result of phase-field simulation for Ts,0 = 500 K and qs = 2×10⁹erg cm−2s−1. The interval of the isotherms is 100 K.
The initial condition (a), andt =0.003 s (b), 0.006 s (c), and 0.009 s (d) after seeding. Others are the same as Fig. 2.
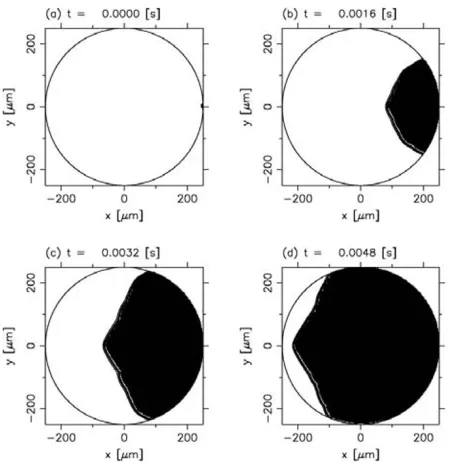
Fig. 6. Result of phase-field simulation for Ts,0 = 600 K and qs =5×10⁸erg cm−2 s−1. The interval of the isotherms is 100 K. No labels indicatingT−TMis displayed for the purpose of visualiza-tion. The initial condition (a), andt =0.0016 s (b), 0.0032 s (c), and 0.0048 s (d) after seeding. Others are the same as Fig. 2.
3.5 Isotropic growth
Figure 6 shows a result forTs,0 =600 K (Ts,0=1563 K) andqs=5×10⁸erg cm−2s−1. The temperature differ-ence between the center and surface of the droplet is only
δTc−s,0 ≈30 K. The temperature at the center (T0−TM = −570 K) is 570 K below the melting point, so the entire droplet is hypercooled. From panels (b)–(d), one can see that the crystal grows isotropically from the seed crystal. There is no remaining liquid after the crystal growth front has passed because the liquid can solidify completely with-out removal of the latent heat of crystallization. The shape of the crystal-liquid interface is quasi-planar, which denotes macroscopic planarity of the interface, but on the micro-scopic scale of the heat-flow the interface does not necessar-ily behave as a plane front (Glicksman and Schaefer, 1967).
4.
Discussion
4.1 Constraint on cooling rate for rim formation Here, we derive the constraint on the cooling rate for rim formation based on the discussion of Miuraet al.(2010).
Let us consider crystal growth from a seed crystal at one side of the droplet surface to the opposite side. There are two possible routes for crystal growth; along the droplet surface and across the center. For the former case, the dis-tance of the growth route is the longest, however, the growth velocity is the fastest because the surface should be cooler than the center due to surface cooling. Here, we assume that the growth velocity of the crystal isV(T0)∝T0β, where
T0is the supercooling inside the droplet when the seeding occurs. The index isβ ≈2.5–3.5 according to the dendrite growth theory (Langer and M¨uller-Krumbhaar, 1978; Xu, 1998). Hereinafter, we adoptβ =3 as a typical value. The growth timescale along the droplet surfaceτsis given by
di-viding the arc distanceπrdby the growth velocityV(Ts,0) as
τs=
πrd
V(Ts,0)
, (7)
where we consider a constant supercooling of Ts,0, namely, a constant growth velocity along the droplet sur-face. On the other hand, the growth velocity across the droplet center is not constant because of the temperature gradient inside the droplet (see Eq. (3)). The growth timescale across the centerτcis given by the following in-tegral form;
τc=2
rd
0
dr V(T0(r))
= 2rd
V(Ts,0)
I(β, α), (8)
where
α≡ δTc−s,0
Ts,0
, I(β, α)≡ 1
0
dr˜
[α(r˜2−1)+1]β, (9)
ris the distance from the droplet center, andr˜=r/rd. The condition for rapid crystal growth along the droplet surface is given byτs< τc, which is rewritten as
I(β, α) > π
2. (10)
By integratingI(β, α)numerically, we obtain (Miuraet al., 2010)
α >∼0.2, forβ=3. (11) The cooling rate is rewritten asRcool = 6ακLTs,0/crd2 by using Eqs. (4), (5), and (9). Substituting Eq. (11) into the expression for the cooling rate, we obtain the formation condition of the rim as
Rcool>∼2000
Ts,0 300 K
rd 250μm
−2
K s−1. (12)
It should be noted that the condition given by Eq. (11) or (12) is applicable only whenτs < τcool, whereτcool is the cooling timescale of the droplet (Miuraet al., 2010). If not, the droplet temperature drops considerably during solidification, so Eq. (3) cannot be used in this analysis. We can apply the condition given by Eq. (11) or (12) to our results because the typical growth timescale ofτs<0.1 s is shorter than the cooling timescale ofτcool>0.1 s.
4.2 Condition to produce each growth pattern
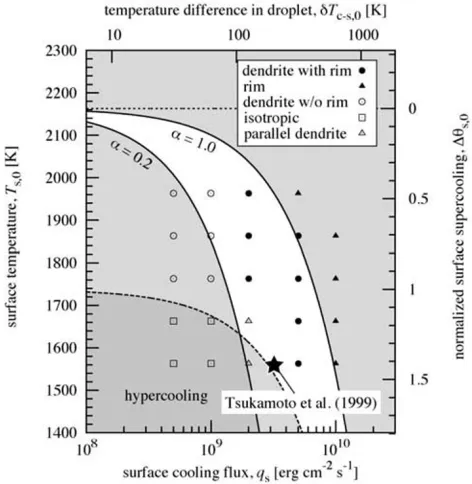
Figure 7 shows the calculation conditions and the resul-tant crystal growth patterns on aqs-Ts,0 diagram. The top border isδTc−s,0calculated by Eq. (4). The right border is the normalized supercooling at the droplet surface defined by (Glicksman and Schaefer, 1967)
θs,0=
TM−Ts,0
Thyp
. (13)
Fig. 7. Calculation conditions and the resultant crystal growth patterns onqs-Ts,0diagram. δTc−s,0is the temperature difference between the
surface and center of the droplet. θs = (TM−Ts,0)/Thyp is the
normalized supercooling at the droplet surface, whereThyp is the hypercooling limit. The solid curves correspond to the conditions of
α = 0.2 andα = 1, respectively, whereα = δTc−s,0/Ts,0 is the
normalized temperature difference. The dashed curve is the criterion below which the entire droplet is hypercooled.
center exceeds the melting point (see Eq. (11)). The rim was found to be formed at conditions to the upper right of theα = 0.2 curve. From comparison with the results of phase-field simulations, we conclude that the condition given by Eq. (11) or (12) are plausible as the criterion for rim formation.
The dashed curve is the parameter space below which the entire droplet is hypercooled. It is found that isotropic growth (see Section 3.5) occurred at conditions below the dashed curve.
A large star symbol indicates the condition of the container-less crystallization experiment by Tsukamotoet al. (1999), in which the rim surrounding parallel sets of olivine bars was successfully reproduced from a pure forsteritic composition melt droplet. In their experiment, the droplet crystallized at a supercooling of Ts,0 ≈ 600 K, which gives the normalized surface undercooling of
θs,0 ≈1.4. The temperature difference inside the droplet was estimated as δTc−s,0 ≈ 170 K (see Table 1), which givesα≈ 0.4. Since this experimental condition satisfied the condition for rim formation, their sample having the rim structure is a reasonable result.
We consider the experimental condition of Tsuchiyama
et al. (2004). In their experiment, the cooling rate of the droplet wasRcool=1000 K hr−1if we assume that it is the same as the cooling rate of the furnace. The temperature difference between the center and surface of the droplet can be estimated asδTc−s,0 ≈ 0.02 K for a sample radius of
rd = 500μm and with typical thermodynamic properties of silicates (c=3×10⁷erg K−1cm−3andκ
L =2×10⁵
erg cm−1 s−1 K−1, Murase and McBirney, 1973). From the condition of Eq. (11), the molten sample in their ex-periment must have crystallized at very low supercooling asTs,0 <0.1 K to form the rim. The nucleation at such very small supercooling might be due to the contact of the droplet to the carbon capsule. However, the exact value of the nucleation supercooling was not measured, so we cannot test our new constraint with their experiment. In-situ temperature measurement during droplet solidification is required to clarify the condition of rim formation. 4.3 Implication for chondrule solidification textures
The numerical model that we adopted in this study was used to simulate the crystal growth process in a supercooled melt droplet of a single composition, namely, the composi-tion of the crystal phase is the same as that of the parent liq-uid phase. However, real chondrules are multi-component, namely, the composition of the crystal phase is not neces-sarily the same as the bulk composition of the parent liquid (e.g., Jones, 1990). Therefore, not only the temperature dis-tribution inside the droplet, but also the partitioning and dif-fusion of elements near the crystal-liquid interface (Watson, 1996, 2004) should be taken into consideration. To eluci-date the formation mechanism of chondrule solidification textures, it is required to model the crystallization process of a multi-component melt droplet at a largely undercooled state (e.g., Bi and Sekerka, 1998, 2002).
Before the multi-component modeling begins, we make some predictions for chondrule solidification textures based on our single-component phase-field calculations. In our model, the droplet after complete solidification is just a sin-gle crystal spherule, probably with no solidification texture remaining inside. However, if the droplet contains small amounts of incompatible elements in olivine, such as Ca and Al, these elements tend to partition into the remaining liquid phase during crystal growth (Libourel, 1999; Pack and Palme, 2003). The inhomogeneity in elemental com-position should relate to the solidification texture. There-fore, the distribution of the remaining liquid phase inside the droplet has some implications for the formation mecha-nism of chondrule solidification textures.
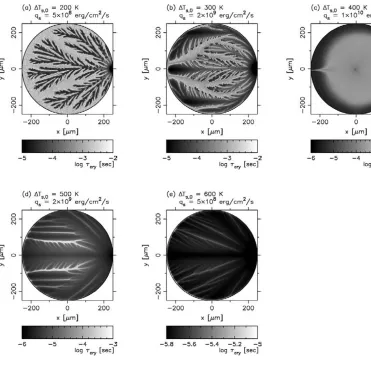
To visualize the distribution of the remaining liquid phase, we introduce a crystallization timescaleτcryinto our phase-field calculation. The timescaleτcryshows how long the liquid takes to solidify at a certain position, and it is calculated by
τ(i,j)
cry =t (i,j)
0.1 −t (i,j)
0.9 , (14)
wheret0(i.1,j)andt0(.i,9j)are the times whenφi,j =0.1 and 0.9,
respectively, at the grid point (i,j). t0(i.,9j)means the time when the liquid at the grid point(i,j)begins to crystallize, and t0(i.,1j) means the time when the grid point is almost completely solidified. The remaining liquid phase should have largeτcrybecause it solidified very slowly.
Fig. 8. Distribution of crystallization timescaleτcryin a completely solidified droplet. Panels (a)–(e) correspond to Figs. 2-6, respectively. Note that the range of gray scale are different in each panel.
are some light gray lines that were not clearly identified in Figs. 5 and 6, respectively. These lines correspond to positions of some dents at the quasi-planar crystal-liquid interface. As shown in Figs. 5 and 6, the interface is not a complete plane but has some small undulations. During the advance of the interface, the released latent heat of crystallization poured into the dents by thermal diffusion even at the hypercooled state. The temperature at the dents becomes slightly higher than the ambient region, making the growth speed slower. Therefore, the track of the dent position remains on the map as the region where the liquid solidified more slowly.
The gray-scale map ofτcry just visualized the difference of crystal growth timescale during solidification. The re-lationship to the chondrule solidification textures was not clear. However, we consider that the chondrule solidifi-cation textures reflect the crystal growth pattern inside the droplet. Our phase-field simulations are the first step to un-derstand the formation mechanism of chondrule solidifica-tion textures.
5.
Conclusion
The chondrule solidification texture reflects the crystal growth pattern inside the melt droplet at the time of
forma-tion in the early solar nebula. We numerically investigated the following two thermal effects on the crystal growth pat-tern; (i) the cooling at the droplet surface and (ii) the re-lease of latent heat of crystallization. Surface cooling makes the droplet surface cooler than the center. Since the crystal growth rate is faster along the cooler surface than across the hotter center, the rim was formed when the cooling rate is large enough. The release of the latent heat of crystalliza-tion caused a rapid temperature increase near the growing rim, resulting in a very steep temperature gradient at the interface between the rim and the remaining liquid (melt) phase. This “reversed” temperature gradient led to den-drite formation due to the morphological instability. We found that the double structure of rim and dendrite could be formed only when the cooling rate is within a narrow range. An understanding of these thermal effects on chon-drule melt solidification is the first step to elucidate the for-mation mechanism of chondrule solidification textures.
Earth and Planetary Dynamics”. This research was partially sup-ported by the Ministry of Education, Science, Sports and Culture, Grant-in-Aid for Scientific Research (A), 22244066, 2010–2013.
Appendix A. Phase-Field Method (PFM)
The classical approach to the modeling of first order phase transformations involves tracking the free boundary that separates the growing phase (e.g., crystal) from the par-ent phase (e.g., supercooled liquid). PFM provides an al-ternative approach, according to which a new variable, the phase fieldφ, is introduced to keep track of the phase, tak-ing on constant values indicative of each of the bulk phases and making a transition between these values over a thin transition layer that plays the role of the classically sharp interface. One of the advantages of PFM is not to require explicit tracking of the free boundary. This makes the nu-merical model simpler than the classical approach.
In the PFM developed by Wanget al.(1993), the crys-tallization process can be simulated by solving the coupled equations for the phase field and temperature field given by Eqs. (1) and (2), respectively. The latter is easily recog-nized as the time-dependent thermal diffusion equation tak-ing into account the release of latent heat of crystallization, as explained in the text.
The physical meaning of Eq. (1) except for the diffusion term is that the phase valueφ(x,t)changes to minimize the Helmholtz free energy density f(T(x,t), φ(x,t)) as time goes on, whereT is the temperature. The Helmholtz free energy density is given by (Wanget al., 1993)
f(T, φ)
L =
T TM
3√2 2W g(φ)−
T −TM
T p(φ)
. (A.1)
Figure A.1 shows f(T, φ) as a function ofφ. The solid, dashed and dotted curves are for T = TM (equilibrium),
T < TM (solidification), andT > TM (melting), respec-tively. WhenT = TM, f(T, φ)has two minima atφ = 0 (solid) andφ =1 (liquid). This stands for solid-liquid co-existence. WhenT <TM, the minimum atφ =0 is lower than the (local) minimum atφ=1. The difference in free energy between these two minima gives a driving force for solidification. On the contrary, whenT > TM, the mini-mum atφ=1 is lower than the (local) minimum atφ=0, leading to melting of the solid phase.
The diffusion term of Eq. (1) makes the crystal-liquid interface smooth. This term represents the effect that the undulated interface in equilibrium with the parent liquid becomes flat. This effect is termed as the Gibbs-Thomson effect, namely, the equilibrium temperature at the curved interface is given by
TN=TM(1−/ρ), (A.2)
where ρ is a local radius of curvature at a point of the interface (positiveρ when convex toward the liquid). The term TM/ρ is the melting point depression due to the surface tension.
In PFM, the solid-liquid interface has finite thickness. The thicknesswis obtained from a steady-state solution of Eq. (1) atT = TM (Wang et al., 1993). By dropping the time-derivative term and substitutingT =TM, Eq. (1) can
Fig. A.1. The helmholtz free energy density f(T, φ)adopted in PFM of Wanget al.(1993).
Fig. A.2. One-dimensional solution of Eq. (A.3) under equilibrium con-dition,T=TM.
be rewritten as
∂2φ
∂x2 = 1 4W2g
(φ). (A.3)
The solution with boundary conditions φ → 0 as x →
−∞, andφ→1 asx→ +∞is found to be
φ(x)= 1
2
tanh
x
2√2W
+1 , (A.4)
where we have chosen a constant of integration to locate the interface atx=0. Figure A.2 shows this solution with respect tox. If we consider the solid-liquid interface being at 0.1≤φ≤0.9 (see Section 4.3), the width is found to be
w≈6W.
Wanget al.(1993) formulated the phase-field equation to solve the crystal growth velocityV consistently with well-known Wilson-Frenkel low in the limit ofW → 0. The Wilson-Frenkel low (Wilson, 1900; Frenkel, 1932) means that the growth velocityV is proportional to the local su-percooling, so we obtain
V =μ (TN−T) , (A.5)
sufficiently fine computational mesh (Murrayet al., 1995; Wang and Sekerka, 1996).
References
Amelin, T., A. N. Krot, I. D. Hutcheon, and A. A. Ulyanov, Lead iso-topic ages of chondrules and calcium-aluminum-rich inclusions, Sci-ence,297, 1678–1683, 2002.
Bi, Z. and R. F. Sekerka, Phase-field model of solidification of a binary alloy,Physica A,261, 95–106, 1998.
Bi, Z. and R. F. Sekerka, Phase field modeling of shallow cells during directional solidification of a binary alloy,J. Crys. Growth,237–239, 138–143, 2002.
Chalmers, B.,Principles of Solidification, 319 pp, John Wiley & Sons, Inc., USA, 1964.
Frenkel, J., Note on a relation between the speed of crystallization and viscosity,Phisik. Zeit. Sowjetunion,1, 498–510, 1932.
Glicksman, M. E. and R. J. Schaefer, Investigation of solid/liquid interface temperatures via isenthalpic solidification,J. Crys. Growth,1, 297–310, 1967.
Herlach, D. M., Non-equilibrium solidification of undercooled metallic metls,Materials Science and Engineering: R: Reports,12(4–5), 177– 272, 1994.
Hewins, R. H., H. C. Connolly, Jr., G. E. Lofgren, and G. Libourel, Experi-mental Constraints on Chondrule formation, pages 286–316, Chondrites and the Protoplanetary Disk, San Francisco: Astronomical Society of the Pacific, 2005.
Jones, R. H., Petrology and mineralogy of Type II, FeO-rich chondrules in Semerkona (LL3.0): Origin by closed-system fractional crystallization, with evidence for supercooling,Geochim. Cosmochim. Acta,54, 1785– 1802, 1990.
Jones, R. H. and G. E. Lofgren, A comparison of feo-rich, porphyritic olivine chondrules in unequilibrated chondrites and experimental ana-logues,Meteoritics,28, 213–221, 1993.
Jones, R. H., T. Lee, H. C. Connolly Jr., S. G. Love, and H. Shang, Forma-tion of chondrules and CAIs: Theory vs. observaForma-tion, inProtostars and Planets IV, pages 927–962, Univ. of Arizona Press, Tucson, 2000. Langer, J. S. and H. M¨uller-Krumbhaar, Theory of dendritic growth—
I. Elements of a stability analysis,Acta Metallurgica,26, 1681–1687, 1978.
Libourel, G., Systematics of calcium partitioning between olivine and silicate melt: implications for melt structure and calcium content of magmatic olivines,Contrib. Mineral. Petrol.,136, 63–80, 1999. Lofgren, G. and A. B. Lanier, Dynamic crystallization study of barred
olivine chondrules,Geochim. Cosmochim. Acta,54, 3537–3551, 1990. Lofgren, G. and W. J. Russell, Dynamic crystallization of chondrule melts
of porphyritic and radial pyroxene composition,Geochim. Cosmochim. Acta,50, 1715–1726, 1986.
Lux, G., K. Keil, and G. J. Taylor, Chondrules in h3 chondrites: textures, compositions and origins,Geochim. Cosmochim. Acta,45(5), 675–685, 1981.
McFadden, G. B., A. A. Wheeler, R. J. Braun, S. R. Coriell, and R. F. Sekerka, Phase-field models for anisotropic interfaces,Phys. Rev. E,48, 2016–2024, 1993.
Miura, H., E. Yokoyama, K. Nagashima, K. Tsukamoto, and A. Srivas-tava, Phase-field simulation for crystallization of a highly supercooled forsterite-chondrule melt droplet,J. Appl. Phys.,108, 114912, 2010. Moriya, T.,Glass Kougaku Handbook, 171 pp., Asakura Shoten, Tokyo,
Japan, 1963 (in Japanese).
Murase, T. and A. R. McBirney, Properties of some common igneous rocks and their melts at high temperatures,Geol. Soc. Am. Bull.,84, 3563– 3592, 1973.
Murray, B. T., A. A. Wheeler, and M. E. Glicksman, Simulations of experi-mentally observed dendritic growth behavior using a phase-field model,
J. Crys. Growth,154, 386–400, 1995.
Nagashima, K., K. Tsukamoto, H. Satoh, H. Kobatake, and P. Dold, Re-production of chondrules from levitated, hypercooled melts,J. Crys. Growth,293, 193–197, 2006.
Nagashima, K., Y. Moriuchi, K. Tsukamoto, K. K. Tanaka, and H. Ko-batake, Critical cooling rates for glass formation in levitated mg2sio4-mgsio3 chondrule melts,J. Min. Petr. Sci.,103, 204–208, 2008.
Nelson, L. S., M. Blander, S. R. Skaggs, and K. Keil, Use of a co2 laser to prepare chondrule-like spherules from supercooled molten oxide and silicate droplets,Earth Planet. Sci. Lett.,14, 338–344, 1972.
Noguchi, T., Estimation of three-dimensional internal structures of some barred olivine chondrules in Allende (CV3) chondrite,Antarctic Mete-orite Res.,15, 59–77, 2002.
Osada, Y. and A. Tsuchiyama, Experimental reproduction of rims in barred olivine chondrules by evaporation,Lunar Planet. Sci.,32, 1334–1335, 2001.
Pack, A. and H. Palme, Partitioning of Ca and Al between forsterite and silicate melt in dynamic systems with implications for the origin of Ca, Al-rich forsterites in primitive meteorites,Meteorit. Planet. Sci.,38, 1263–1281, 2003.
Pertermann, M. and A. M. Hofmeister, Thermal diffusivity of olivine-group minerals at high temperature, Am. Mineral., 91, 1747–1760, 2006.
Radomsky, P. M. and R. H. Hewins, Formation conditions of pyroxene-olivine and magnesian pyroxene-olivine chondrules,Geochim. Cosmochim. Acta, 54, 3475–3490, 1990.
Sorby, H. C., On the structure and origin of meteorites,Nature,15, 495– 498, 1877.
Srivastava, A., Y. Inatomi, K. Tsukamoto, T. Maki, and H. Miura, In situ visualization of crystallization inside high temperature silicate melts,J. Appl. Phys.,107, 114907, 2010.
Tanaka, K. K., T. Yamamoto, K. Nagashima, and K. Tsukamoto, A new method of evaluation of melt/crystal interfacial energy and activation energy of diffusion,J. Crys. Growth,310, 1281–1286, 2008.
Tangeman, J. A., B. L. Phillips, A. Navrotsky, J. K. Richard, A. D. Hixson, and T. S. Key, Vitreous forsterite (Mg2SiO4): Synthesis, structure, and
thermochemistry,Geophys. Res. Lett.,28, 2517–2520, 2001.
Tsuchiyama, A., H. Nagahara, and I. Kushiro, Experimental reproduction of textures of chondrules,Earth Planet. Sci. Lett.,48, 155–165, 1980. Tsuchiyama, A., K. Uesugi, and T. Nakano, A study of three-dimensional
structures of rocks and minerals using a high-resolution X-ray CT method—Primitive materials in the solar system and chondrules—.J. Geogr.,109, 845–858, 2000 (in Japanese).
Tsuchiyama, A., Y. Osada, T. Nakano, and K. Uesugi, Experimental repro-duction of classic barred olivine chondrules: Open-system behavior of chondrule formation,Geochim. Cosmochim. Acta.,68, 653–672, 2004. Tsukamoto, K., H. Satoh, Y. Takamura, and K. Kuribayashi, A new
ap-proach for the formation of olivine-chondrules by aeroacoustic levita-tion,Antarct. Meteorites,24, 179–181, 1999.
Tsukamoto, K., H. Kobatake, K. Nagashima, H. Satoh, and H. Yurimoto, Crystallization of Cosmic Materials in Microgravity,Lunar Planet. Sci., 32, 1846–1847, 2001.
Uehara, T. and R. F. Sekerka, Phase field simulations of faceted growth for strong anisotropy of kinetic coefficient,J. Crys. Growth,254, 251–261, 2003.
Wang, S. L., R. F. Sekerka, A. A. Wheeler, B. T. Murray, S. R. Coriell, R. J. Braun, and G. B. McFadden, Thermodynamicallyconsistent phase-field models for solidification,Physica D,69, 189–200, 1993.
Wang, S.-L. and R. F. Sekerka, Algorithms for phase field computation of the dendritic operating state at large supercoolings,J. Comput. Phys., 127, 110–117, 1996.
Watson, E. B., Surface enrichment and trace-element uptake during crystal growth,Geochim. Cosmochim. Acta,60, 5013–5020, 1996.
Watson, E. B., A conceptual model for near-surface kinetic controls on the trace-element and stable isotope composition of abiogenic calcite crystals,Geochim. Cosmochim. Acta,68, 1473–1488, 2004.
Weisberg, M. K., Barred olivine chondrules in ordinary chondrites, J. Geophys. Res.,92, E663–E678, 1987.
Wilson, H. A., On the velocity of solidification and viscosity of super-cooled liquids,Philos. Mag.,50, 238–250, 1900.
Xu, J. J.,Interfacial Wave Theory of Pattern Formation, 174 pp., Springer-Verlag, Berlin, Germany, 1998.