The absorption-peak map of Mare Serenitatis obtained by a hyper-spectral
telescope
Hideaki Okuno, Yuta Yamanoi, and Kazuto Saiki
Department of Earth and Space Science, Graduate School of Science, Osaka University, Osaka 560-0043, Japan
(Received February 2, 2007; Revised October 5, 2007; Accepted November 22, 2007; Online published April 9, 2008)
The Mg-number [Mg#=atomic Mg/(Mg+Fe)] serves as an important petrologic discriminator when analyzing and understanding lunar rocks. Variations in the Mg# shift the wavelength of the absorption spectra of ferrous iron, which peak at around 1000 nm. Based on the image cubes of the Moon obtained by the Advanced Lunar Imaging Spectrometer (ALIS), we detected the shift in the absorption spectra of ferrous iron and built up an absorption-peak map of Mare Serenitatis. The wavelength of the absorption peak shows an 11-nm shift in Mare Serenitatis. Since the degree of space weathering can be considered to be almost the same as that within the same lava unit and Ca content cannot change without changing Mg# during magma differentiation, these shifts of the peak absorption spectra suggest that there is Mg# variation in at least the same lava unit.
Key words:Moon, hyper-spectral telescope, Mg-number.
1.
Introduction
Results from the 1994 Clementine mission (e.g., Nozette
et al., 1994) and the 1998 Lunar Prospector mission (e.g., Blinder, 1998) have led to significant new views of the structure and distribution of materials in the crust and upper mantle of the Moon. In particular, Luceyet al.(1995, 1998, 2000), who developed a method for mapping iron and tita-nium abundance using Clementine ultraviolet-visible light (UV-VIS) data, greatly advanced the field of lunar science. The next step for understanding the origin and thermal evo-lution of the Moon is to construct a Mg-number [Mg# = atomic Mg/(Mg+Fe)] map of the pyroxene found on the lunar surface. For example, using Mg# and the Fe-Mg par-tition coefficient between melt and mafic minerals reported by Stolper (1977), it is possible to estimate the degree of partial melting of source rocks before lava eruption. Vari-ations in the Mg# of the pyroxene shifts the wavelength of the absorption spectra of ferrous iron, which peak at around 1000 nm and 2000 nm (e.g., Hazenet al., 1978). Conse-quently, if Mg# variations do actually exist in the materials comprising the lunar surface, it should be possible to de-tect the shift in the absorption peak. However, such shifting could not be detected by remote sensing because the latter is limited to a very small spectral range. Pieters and En-glert (1993) reported that they had observed small variations between spectra for different mare craters at visible wave-lengths as well as near the 1000 nm absorption peak using an Earth-based telescope and the center of absorption spec-tra ranges 980–1000 nm in the lunar mare. However, these authors did not describe the shifts caused by Mg# variations in the lunar mare.
Copyright cThe Society of Geomagnetism and Earth, Planetary and Space Sci-ences (SGEPSS); The Seismological Society of Japan; The Volcanological Society of Japan; The Geodetic Society of Japan; The Japanese Society for Planetary Sci-ences; TERRAPUB.
In this paper, we report our observations of the Moon using a hyper-spectral telescope named ALIS (Advanced Lunar Imaging Spectrometer) and our successful attempts to detect the absorption-peak shift of lunar mare basalts. We discuss the accuracy and the interpretation of the absorption-peak map that was obtained and estimate Mg# distribution from the map.
2.
Method
The spectral data of the lunar surface were obtained by ALIS (Saikiet al., 2004). ALIS is a hyper-spectral imaging telescope developed by one of the authors (KS) in collabo-ration with JFE Techno-Research Co. (Japan). The specifi-cations of ALIS are shown in Table 1. ALIS is a cassegrain telescope equipped with two spectrometers—a VIS and a near-infrared (NIR) spectrometer—and a monitoring cam-era. Each spectrometer consists of an imaging sensor and a Prism-Grating-Prism (PGP) unit (ImSpector; manufactured by Specim Corp.). Incoming light passes through the open-ing in the primary mirror of the Cassegrain telescope to fo-cus on a slit plane of the PGP unit. The PGP unit produces a “1-line spatial information”דspectral information” im-age on the charged-coupled device (CCD) plane as one shot. The coverage of wavelength is 380–1100 nm (VIS) and 1000–1700 nm (NIR). Line images are assembled by scan-ning an image on the slit of the spectrometer by rotating a deflecting mirror. The mirror is also used to switch between the VIS-system, NIR-system, and the monitor camera. The monitor camera is used for adjusting the focus and frames. Spatial resolution of ALIS-VIS is 6.188/pixel and that of ALIS-NIR is 6.435/pixel. The NIR data were not used be-cause the quality was not enough for this study due to the high level of dark noise. The typical scanning speed of the ALIS-VIS camera is about 3.2 s per 1 line, and the expo-sure time of each line is 50 ms. One lunar image cube is composed of 512 scanning lines, which can be obtained in
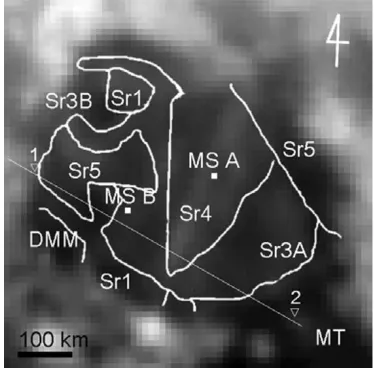
Fig. 1. 700 nm reflectance image of Mare Serenitatis. Geological bound-aries are based on Kodama and Yamaguchi (2003). Points MS A and MS B indicate the location where two sample spectra were obtained. The line defined by two points, from the Plinius crater (Lat: 15.4◦N, Long: 23.7◦E) to the Santos-Dumont crater (Lat: 27.7◦N, Long: 4.8◦E), indicates the sampling line for making Fig. 8.
about 28 min. The scanning direction is vertical for the im-ages used this study.
The location of the observation was Science City, lo-cated at the peak of Mt. Haleakala, Maui, Hawaii, USA. The observation dates were from 15 to 26 August 2005 and from 12 to 18 December 2005. The observations were carried out by the ALIS-users’ group, which includes the authors. ALIS and its peripheral devices were trans-ported from Japan. An observation dome, which had been constructed by Okano Laboratories at Tohoku University, Japan, and the observation support facilities were provided by the Mees Solar Observatory at the University of Hawaii. Mare Serenitatis was selected as a survey area because it is located almost at the center of lunar near-side and the range of observation geometry is not so wide among the mare. Mare Serenitatis is located at 27◦N, 19◦E and is 740 km in diameter. A large part of the basin is filled with mare basalt. Most of the mare samples returned by Apollo 17 showed a Ti-rich composition, with their radioac-tive ages ranging from 3.56 to 3.79 Ga (e.g., Schaeffer and Schaeffer, 1977; Tera et al., 1974). The stratigraphy of Mare Serenitatis has been well studied by many researchers (e.g., Carr, 1966; Howardet al., 1973). Based on previous results, the mare basalt in the center of the basin tends to be
ever, Wilhelms and McCauley (1971) and Boyce (1976) re-ported that several patches of mare basalt around the edge of the basin were younger than the central basalts. Pieters (1978) classified Serenitatis deposits into five groups based on four parameters: UV/VIS ratio, albedo, and 1000 nm and 2000 nm band strength. To enable more detailed descrip-tions, Kodama and Yamaguchi (2003) reclassified the Mare Serenitatis deposits into seven groups—Sr1, Sr2, Sr3A, Sr3B, Sr4, Sr5, and DMM (Fig. 1)—using such parame-ters as 750 nm albedo, UV/VIS ratio, 1000 nm absorption signature, and FeO and TiO2contents, which were based on
a spectral analysis derived from Clementine UV-VIS multi-spectral data. The Sr2 unit is not shown in Fig. 1 because the shape of the Sr2 area is narrow and complicated. The areas of mISP, hDWA, and HDWA of Pieters’ classification were subdivided into two areas (Sr4 and Sr3A) three areas (Sr1, Sr2, and Sr5), and two areas (Sr1 and Sr2), respec-tively, in Kodamas’ classification.
3.
Image Processing
Fig. 2. Example spectra showing process flow. (a) Raw spectra of two small areas MS A and MS B of Mare Serenitatis. (b) Corrected spectra after dark and flat correction (step 1 in the text). (c) Smoothed spectra after wavelength smoothing (step 2). (d) Spectra normalized by one highland standard spectrum (step 3). (e) Smoothed spectra after wavelength smoothing (step 4). Dashed line indicates a baseline for MS A. (f) Resultant spectra after baseline correction (step 5). Triangles indicate minimum positions of each spectrum. The peak positions of MS A and MS B are 978 nm and 967 nm, respectively.
Fig. 3. The location of the standard highland. The point is defined at the center of Abulfeda crater and Menelaus crater.
point for the normalization is selected from the highland spectra because these have a small absorption peaks of fer-rous iron (e.g., Luceyet al., 1995). To pick up the same standard point from different lunar images, we defined the point at the center of two conspicuous craters, Abulfeda and Menelaus (Fig. 3). Although normalized reflectance spectra cannot provide accurate information on the peak positions of the absorption band, the peak positions can be compared
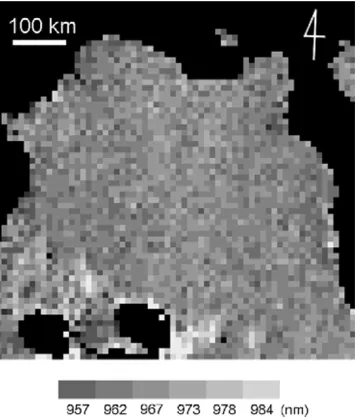
re-Fig. 4. The absorption peak map of Mare Serenitatis before spatial smoothing.
flectance spectra as a common tangent around 750 nm and 1500 nm and the spectra were divided by their own base-line. However, the same correction cannot be carried out for our data because visible system of ALIS covers only spec-tra from 380 to 1100 nm and our specspec-tra are not reflectance but those normalized by highland spectra. Therefore, we defined a virtual baseline which starts at 693 nm and ends at 1059 nm and tried to reduce the influence of space weath-ering as much as possible by subtracting the baseline from each spectrum (Fig. 2(f)). Comparing the resultant spec-tra, we are able to detect the slight shifts in the absorption spectra (Fig. 2(f)). Minimum positions of spectrum MS A and MS B are 978 nm and 967 nm, respectively. These pro-cesses were applied to all pixels on the lunar images, and maps of the wavelength of the absorption peak were then made (Fig. 4). (6) To reduce the effect of random error and obtain a distinct spatial pattern of the positions of the ab-sorption peaks, we performed 3×3-pixel spatial smoothing (Fig. 5).
4.
Results
The peak-position distributions of Mare Serenitatis are shown in Fig. 5, which ranges from 957 to 984 nm. Fig-ure 5(a) and (c) are obtained from data on 15 December, (b) from data on 14 December, (d) and (e) from data on 18 August, and (f) from data on 16 August. These six lunar observations were selected for further analysis because the weather was fine and the Moon was nearly full Moon on those nights. Our method of detecting the absorption-peak was not applied to highland areas because all spectra are normalized by one of the highland spectra, each of which has a weak absorption of ferrous iron. The absorption peak of highland pyroxene would not be detected with sufficient accuracy, therefore highland areas around Mare Serenitatis are colored in black (Fig. 5) and these areas are not dis-cussed here. Although these six maps are slightly different from each other because of the effect of random error, the
Fig. 5. The absorption peak maps of Mare Serenitatis. Images (a) and (c) are obtained on 15 December, (b) on 14 December, (d) and (e) on 18 August, and (f) on 16 August. For highland areas around Mare Serenitatis, the peaks are not defined and the areas are painted with black.
change in the optical depth of the atmosphere during the scan, remaining noise, among other factors, it is possible to observe similar spatial patterns when the six sets of data are compared. In order to discuss the characteristics of local area, we named these as given in Fig. 6. The peak posi-tions of areas 1, 2, 3, and 4 are shorter than those of their surroundings. The peak positions of area 5 are longer than those of their surroundings and the shape of the areas are unstable. A primary cause of this ambiguous shape is most likely the reduction of the depth of the absorption band due to the ray materials from the Tycho crater.
Fig. 6. The absorption peak map of Mare Serenitatis with indicators showing notable areas. The base image was obtained on 14 December.
Fig. 7. Plot of peak wavelength versus value of slope of baseline at each pixel before spatial smoothing. The correlation coefficient between the value of slope of baseline and the peak position is−0.20, indicating no correlation. The base data was obtained on 14 December.
crater (Lat: 15.4◦N, Long: 23.7◦E)–Santos Dumont crater (Lat: 27.7◦N, Long: 4.8◦E). The line is shown in Fig. 1. One sigma for six maps is also shown in Fig. 8.
5.
Discussion
In terms of this research, it is necessary to know whether or not the detected absorption-peak shifts indicate geologi-cal properties. Although random noise (±approx. 5 counts before smoothing) is much smaller than the signal level (1500∼2000 counts) of the lunar mare, the detection of peak position is still difficult because a change of only five counts of the pixel value might change the position of ab-sorption peak of the ferroan iron. A statistical treatment is therefore required. We were able to extract the geolog-ical features of Mare Serenitatis from the smoothing pro-cesses and the comparison of the six absorption-peak maps (Fig. 5). Because these six absorption-peak maps of Mare Serenitatis (Fig. 5) were obtained under different condi-tions, such as the optical depth of the atmosphere and as-signed CCD pixels, the area with common characteristics
Fig. 8. Peak position profile derived from the line defined by two points, from the Plinius crater (Lat: 15.4◦N, Long: 23.7◦E) (left) to the San-tos-Dumont crater (Lat: 27.7◦N, Long: 4.8◦E) (right). The line is shown in Fig. 1. The peak positions correspond to highland areas are ruled out. Peak positions are the average of all peak positions of six images (Fig. 5(a–f)). Error bar indicates one sigma of six images.
(areas 1∼4 and perhaps 5 in Fig. 6) among these maps would indicate geological properties, not observation er-rors. Considering that one sigma of the peak positions of six images (Fig. 8) is 0–4 nm and that the spectral resolu-tion of ALIS is about 5 nm, most of the peak posiresolu-tion would not change over a 5-nm scale on Fig. 5. The area where the standard deviation of peak position is wide may be the area where the peak position locates at the boundary of the spec-tral scale.
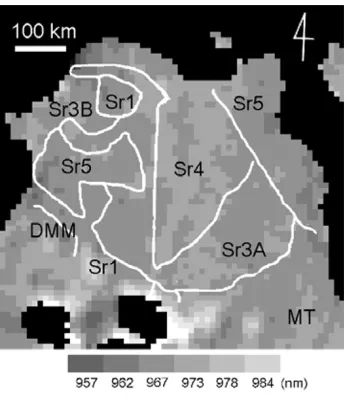
Fig. 9. The absorption-peak image with geological boundaries based on Kodama and Yamaguchi (2003). The base image was obtained on 14 December.
grain size, among other, are also able to shift the position of the absorption peak. However, we expect that Mg# varia-tion has been detected—at least in the same lava—because there is no correlation between the space weathering and the position of the peak (Fig. 7) and there would be correlation between Ca content and Mg# in the same magma differ-entiation trend. To check whether the peak shift is caused by the change in chemical composition of the clinopyrox-ene of the mare basalt, the Mg# map of Mare Serenitatis derived from Lunar Prospector Gamma Ray Spectrometer (LPGRS) (Prettyman et al., 2002) (Fig. 10(a)) was com-pared with our absorption peak map of Mare Serenitatis. Our map was resampled (Fig. 10(b)) to the similar spatial resolution to that of Mg# map of LPGRS. The iron abun-dance map (Lawrenceet al., 2002) of the same area as that of the Mg# map and the 700 nm ALIS reflectance image of the same area as our absorption peak map are also shown in Fig. 10(c) and (d), respectively. The increase in Mg# shifts the absorption peak to a shorter wavelength (e.g. Hazenet al., 1978). A comparison of Fig. 10(a) and (b) suggests that similar spatial patterns exist. The absorption peak shifts from lower to a higher wavelength (approximately corre-sponding to a decrease in Mg#) in the area from the Mare Tranquillitatis to the center of Mare Serenitatis. However, the spatial resolution is too low to confirm the similarity between the Mg# map of LPGRS and our peak-shift map.
On the other hand, there is a possibility that the lavas of areas 2 and 4 in Fig. 6 have a high Mg#. The Sr5 lava unit, including areas 2 and 4, is the youngest within this mare according to Kodama and Yamaguchi (2003). Since the TiO2 concentration is almost constant throughout the Sr5
unit, all of the lava of this geological unit should have come from a common parent layer. Nevertheless, a peak shift is detected. If this peak shift suggests Mg# variations, the variations lead two interpretations. One is that the variation is caused by the difference in the degree of partial melting of the parent rock. The lavas of high Mg# areas, such as areas 2 and 4 in Fig. 6, may be at a higher degree of partial
Fig. 10. (a) Mg# map of Mare Serenitatis derived from the Luna Prospec-tor Gamma Ray Spectrometer (LPGRS) (Prettymanet al., 2002), (b) the absorption peak map of Mare Serenitatis obtained in this survey, (c) FeO abundance map of the same area as (a) derived from LPGRS (Lawrence
et al., 2002), (d) the 700 nm reflectance image of the same area as (b) derived from ALIS. The data for (b) and (d) was obtained on 14 Decem-ber. The absorption peak map (b) was resampled to the similar spatial resolution to that of Mg# map of LPGRS.
melt in the latter stage. It could be interpreted that these are located near a vent. Another interpretation is that the variation is caused by the difference in the degree of magma differentiation after eruption. For a long flow, Mg# would be expected to decrease along the flow line concomitant with the crystallization of the pyroxene and olivine with a higher Mg# and their removal from the melt. In this case also, the high Mg# area indicates the presence of a vent. Staid and Pieters (2001) reported another spectral variation along flows within the Imbrium basin; these researchers suggested variations in ilmenite content along previously mapped lava flows. However, such a trend could not be found in TiO2map of areas 2 and 4 of the Mare Serenitatis.
This may indicate variations in the fractionation pattern of mare basalt.
6.
Conclusion
Acknowledgments. We would like to express our thanks to Dr. Mike Maberry and Mr. Daniel O’Gara of the University of Hawaii and the ALIS users group for their kind assistance at Haleakala site. We also wish to thank Drs. Shoichi Okano and Hiroaki Mis-awa of Tohoku University who allowed us to use their astronom-ical dome at the site and gave us helpful advice. We are grate-ful to Dr. Mark Robinson and an anonymous reviewer for help-ful and constructive suggestions. ALIS was developed through Phase-IA research of “Ground-based Research Announcement for Space Utilization” (PI: K. Saiki) promoted by Japan Space Forum. Ground-based observations were supported by the Japanese Min-istry of Education, Science, Sports, and Culture, Grant-in-Aid for Young Scientists (PI: K. Saiki).
References
Basaltic Volcanism Study Project (BVSP),Basaltic Volcanism on the ter-restrial planets, 1286 pp, Pergamon Press Inc., New York, USA, 1981. Blinder, A., Lunar Prospector: Overview,Science,281, 1475–1476, 1998. Boyce, M. J., Ages of flow units in the lunar nearside maria based on Lunar Orbiter IV photographs,Proc. Lunar Planet. Sci. Conf.,7, 2717–2728, 1976.
Carr, M. H., Geologic map of the Mare Serenitatis region of the moon,
Geological survey, Map I-489, 1966.
Hazen, R. M., P. M. Bell, and H. K. Mao, Effects of compositional varia-tion on absorpvaria-tion spectra of lunar pyroxenes,Proc. Lunar Planet. Sci. Conf.,9, 2914–2934, 1978.
Howard, K. A., M. H. Carr, and W. R. Muehlberger, Basalt stratigraphy of southern Mare Serenitatis, Apollo 17 preliminary science report, Washington D.C., U.S. Government Printing Office, NASA SP-330, 29-1–29-12, 1973.
Kodama, S. and Y. Yamaguchi, Lunar mare volcanism in the eastern near-side region derived from Clementine UV/VIS data,Meteor. Planet. Sci., 38, 1461–1484, 2003.
Lawrence, D. J., W. C. Feldman, R. C. Elphic, R. C. Little, T. H. Pret-tyman, S. Maurice, P. G. Lucey, and A. B. Binder, Iron abundances on the lunar surface as measured by the Lunar Prospector Gamma-Ray and Neutron Spectrometers, J. Geophys. Res., 107(E12), 5130, doi:10.1029/2001JE001530, 2002.
Lucey, P. G., G. J. Taylor, and E. Maralet, Abundance and distribution of iron on the Moon,Science,268, 1150–1153, 1995.
Lucey, P. G., D. T. Blewett, and B. R. Hawke, Mapping FeO and TiO2
content of the lunar surface with multi-spectral imagery,J. Geophys. Res.,103, 3679–3699, 1998.
Lucey, P. G., D. T. Blewett, and B. L. Jolliff, Lunar iron and titanium abun-dance algorithms based on final processing of Clementine ultraviolet-visible images,J. Geophys. Res.,105, 20297–20305, 2000.
Nozette, S., P. Rustan, L. P. Pleasance, D. M. Horan, P. Regeon, E. M. Shoemaker, P. D. Spudis, C. H. Acton, D. N. Baker, J. E. Blamont, B. J. Buratti, M. P. Corson, M. E. Davies, T. C. Duxbury, E. M. Eliason, B. M. Jakosky, and J. F. Kordas, The Clementine mission to the Moon: Scientific overview,Science,266, 1835–1839, 1994.
Pieters, C. M., Mare basalt types on the front side of the Moon: A summary of spectral reflectance data,Lunar Planet. Sci. Conf.,9, 2825–2849, 1978.
Pieters, C. M. and A. J. Englert,Remote Geochemical Analysis: Elemen-tal and Mineralogical Composition, Cambridge, 594pp, The Press Syn-dicate of the University of Cambridge, Cambridge CB2 2RU, United Kingdom, 1993.
Prettyman, T. H., W. C. Feldman, D. J. Lawrence, G. W. McKinney, A. B. Binder, R. C. Elphic, O. M. Gasnault, S. Maurice, and K. R. Moore, Library least squares analysis of Lunar Prospector gamma-ray spectra,
33rd Lunar Planet. Sci. Conf., Abstract #2012, 2002.
Saiki, K., R. Nakamura, F. Ichikawa, H. Akiyama, and H. Takeda, De-velopment of a telescope imaging spectrometer for the moon,Lunar Planet. Sci. Conf.,XXXV #148, 2004.
Sasaki, S., K. Nakamura, Y. Hamabe, E. Kurahashi, and T. Hiroi, Produc-tion of iron nanoparticles by laser irradiaProduc-tion in a simulaProduc-tion of lunar-like space weathering,Nature,410, 555–557, 2001.
Scheaffer, G. A. and O. A. Scheaffer,39Ar-40Ar ages of lunar rocks,Lunar Planet. Sci. Conf.,8, 2253–2300, 1977.
Staid, M. I. and C. M. Pieters, Mineralogy of the last lunar basalts: Results from Clementine,J. Geophys. Res,106(E11), 27,887–27,900, 2001. Stolper, E., Experimental petrology of eucritic meteorites,Geochem.
Cos-mochim.,41, 587–611, 1977.
Tera, F., D. A. Papanastassiou, and G. J. Wasseburg, Isotopic evidence for a terminal lunar cataclysm,Earth Planet. Sci. Lett.,22, 1–21, 1974. Wilhelms, D. E. and F. M. McCauley, Geologic map of the nearside of the
Moon,U. S. Geological Survey, Map I-703, Washington D.C., 1971.