R E S E A R C H
Open Access
ToA-based multi-target localization and
respiration detection using UWB radars
ChangKyeong Kim
1and Joon-Yong Lee
2*Abstract
This paper proposes a method of detecting the number of persons in an area, along with their locations and breath patterns, using ultra-wideband (UWB) radars. A time-of-arrival type of location estimation was performed in this study not only using techniques introduced in the existing study results of detecting biomedical signals using a UWB radar but also by applying an initial screening method for redundancy reduction and a maximum likelihood
observation-target association technique. This paper also introduces radar measurements conducted under a variety of scenarios and presents the results of applying the proposed algorithm to the measured data. The test results showed that the number of targets was accurately estimated with an average positioning accuracy of 12.7 cm.
Keywords: Ultra-wideband radar; Multi-target localization; Respiration detection
Introduction
Recently, significant attention has been paid to the non-invasive detection technology of human movement or biomedical signals for the purpose of patient monitoring and search and rescue. An ultra-wideband (UWB) radar is advantageous in terms of being able to sense slow and tiny movement of a human body, as compared to existing Doppler radars [1-3]; therefore, it is regarded as a suit-able solution for these application areas. There have been many studies on the technique of detecting not only the human breath but also the heartbeat using a UWB radar [4-9]. It has been found through experimental results that the breath or the heartbeat can be detected not only when there is no obstacle between the radar and the human but even under a situation where the path between the two is blocked by walls [10-15]. Some study results have presented not only single-target detection but also dual-target detection [15-17]. In addition, literature regarding the estimation of the target location as well as distance to a target can be found [15,18].
To this end, generally, techniques of time-frequency analysis, correlation detection, and static clutter removal have been widely used. Along with them, additional signal processing techniques have been introduced to improve
*Correspondence: [email protected]
2School of Computer Science and Electrical Engineering, Handong University, 791-708 Pohang, South Korea
Full list of author information is available at the end of the article
the performance of estimation. In order to remove non-stationary clutter, which is a cause of false alarms, Baboli et al. [19] used a wavelet transform, whereas Zaikov [18] applied a filtering technique. Lazaro et al. [20] and Sharafi et al. [21] showed that biomedical signals can be detected even for a moving target by introducing techniques for movement compensation. The breathing signal generates harmonic components owing to its periodicity [22], which cause false alarms. Lazaro et al. [20] utilized a trap filter to remove them.
This study aims to detect a breathing pattern of one or more persons who breathe at a fixed position and their locations in a two-dimensional space. First, radar scans were obtained in various scenarios in an indoor environment. Most of the radar measurements previ-ously reported in the literature were obtained in sce-narios where the front of a person was directed to an antenna. In this study, however, data measured with the side or back of a person directed towards the antenna were also obtained. Although the signals obtained in such scenarios were significantly weak, they could be used suc-cessfully for the estimation process. Then, the general detection techniques mentioned above were applied to detect changes in a signal due to a target’s movement. At this step, measurements at each radar may include false alarms that could be caused by target movement regard-less of breathing, harmonics, and indirectly reflected
signals [17]. Next, an initial screening is conducted to reduce the number of false alarms by analyzing the frequency characteristics of the detected signals. Then, observation-target association is carried out, for which we used a classical maximum likelihood (ML) approach [23]. This approach requires a large number of com-putations, so a more computationally efficient method must be employed considering practicability. However, this study attempted to show the feasibility and useful-ness of the technique, using the distance information and breath frequency information of the target simultaneously in the data association step, using the optimal ML tech-nique. Finally, the number of targets is determined, and the estimates of target locations and breath frequencies according to the determined number is obtained as a final result.
Radar measurements
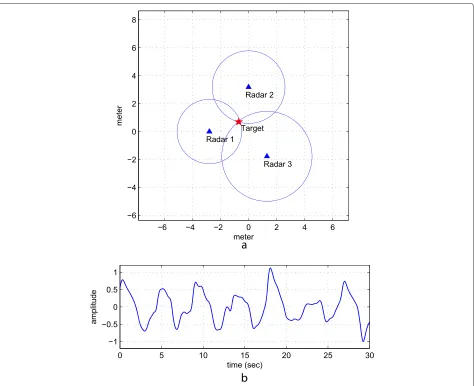
UWB radar measurements were carried out using the Pulson P400 monostatic radar module manufactured by Time Domain, Inc. (Huntsville, AL, USA) in an indoor environment. In order to prevent false alarms, we tried to remove the sources of non-stationary clutter, such as persons walking into an area near the radar, swaying cur-tains, and running fans, as much as possible. Each radar has two omnidirectional dipole antennas attached so as to transmit and receive UWB pulses. The three radars were arranged in known locations and fixed on a foam pad to be placed at a height of about 0.7 m, which is near the average height of the chest of a sitting adult. In addition, one to three people were positioned around the radars so that the breathing pattern and location of each person would be estimated. The location of each person was also determined in advance to evaluate the accuracy of the estimation. The relative location of each radar and person was measured using a laser distance measuring device for performance evaluation. The reso-lution of the used laser distometer was 0.1 mm. Ten sets of measurements were taken: five sets with one target, four sets with two targets, and one set with three targets. Figure 1 shows a photograph of the experimental environ-ment depicting measureenviron-ment set numbers 1, 7, and 10 for a single person, two persons, and three persons, respec-tively. As shown in the figure, the relative orientation between a person and an antenna can be different depend-ing on the location of the person. In some cases, a per-son’s chest was directed towards the antenna, whereas in other cases, the side or back may be directed towards the antenna.
The template waveforms of the radar signals can be approximated by [24]
s(τ)=Aexp−aτ2sin(bτ), (1)
Figure 1Photograph of the experimental environment.The experimental setup of measurement set numbers 1 (top), 7 (middle), and 10 (bottom) are shown.
wherea=5.55×10¹⁸,b=26.15×10⁹, andAis a constant. The signal received at theith radar can be expressed as
r(i)(τ;t)=
K−1
k=0 a(ki)(t)s
τ −β(i)
k (t)
+n(τ),i=1, 2, 3,
(2)
where the superscript(i)indicates the index for the radar,
β(i)
k (t)exhibit the scale and time delay of multipath signal
components received at the ith radar, respectively. Sig-nals(τ)is the template signal defined in (1) and n(τ)is the noise. The multipath signal components of a received signal include not only the signal components reflected from the human body but also the signal components reflected from other background objects. Each radar uses its unique pseudo-random code, and thus, the signal transmitted from each radar is assumed to have no inter-ference with the signals received at other radars. When measuring received signals, each radar adopts an average for the transmission of 4,096 pulses, thereby increas-ing the signal-to-noise ratio of the received signal, and samples were taken every 0.2 s.
Multi-target localization
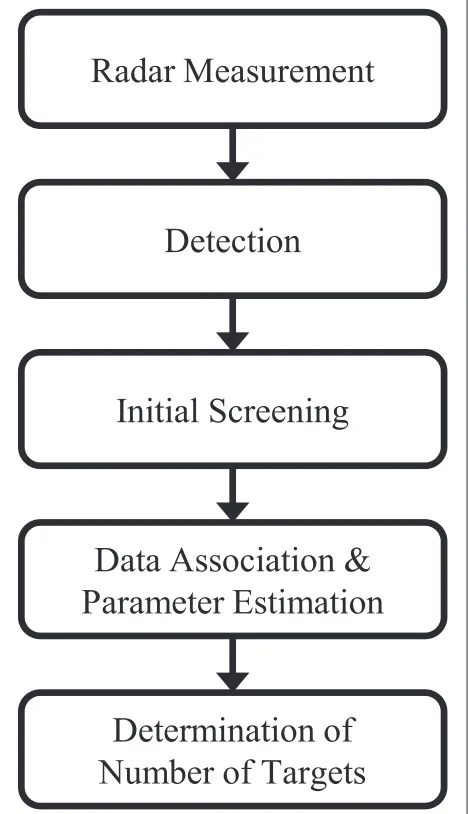
The overall flow of the multi-target detection algorithm proposed in this paper is shown in Figure 2. First, dis-tance information between each reference radar and the potential target and the target’s breath frequency infor-mation are detected from the radar scans obtained by the method introduced in the previous section. The data detected at this step may include false alarms, which are generated by the indirect reflection and harmonic com-ponents of a breathing pattern. To reduce the number of false alarms, an initial screening process is conducted via frequency analysis of the detected signals. Through this process, it is possible to remove all or part of the false alarms. Using the measurements left after conduct-ing this process, data association is carried out. This is a process to determine which target’s movement generated which measurements obtained at each radar. To this end, the ML method, which searches all the possible combi-nations exhaustively, is employed, and the estimation of locations of targets and breath frequencies is also per-formed in this process. Finally, the number of targets is determined by examining the cost function.
Detection
When the person to be detected takes a breath, a por-tion of body parts such as the chest and/or abdomen also moves according to a breathing pattern. This can change the structure of a multipath channel between the transmitting and receiving antennas of the radar, and as a result, the receiving signal also changes. Here, a gen-eral motion filtering technique [20,25,26] was applied to remove the static background signal and to observe the signal movement. However, the received signal at a spe-cific time, rather than the average of all measurement signals, was used as a reference signal. Without a loss of generality, the signal att = 0 is selected as the reference signal as follows:
r(refi)(τ)=r(i)(τ; 0). (3)
Figure 2Block diagram of the estimation process. Observation-target association is carried out along with position estimation.
In addition, the difference signal at a random momentt can be defined as
x(i)(τ;t)=r(i)(τ;t)−rref(i)(τ). (4)
When a measurement was performed while the chest of a person was directed towards the antenna, strong differ-ence signals were observed. On the other hand, when the back or side was directed towards the antenna, very weak signals were obtained. Now, if matched filtering is per-formed for the timing detection of multipath signal com-ponents, the following correlation function is obtained:
R(xsi)(τ;t)=
∞
−∞x
In addition, by taking the Fourier transform of tains components that are not related to breathing, for example, head movement other than periodical move-ment of the chest or abdomen due to breathing. These signal components cause a hindrance in detecting a breathing pattern. Thus, a bandpass filter, which corre-sponds to a general human breath frequency band, was used to filter out these movements [11,26,27]:
Sxs(i),BP(τ;λ)=Sxs(i)(τ;λ)G(λ). (7)
Subscript ‘BP’ indicates that the spectral density has been bandpass filtered andG(λ)is the transfer function of the filter. Our analysis used a Butterworth filter in the fre-quency band of 0.1 to 1.2 Hz. The filtered correlation function can be expressed by
R(xsi),BP(τ;t)=
Figure 3 shows the measured results of measurement set number 1 when a single person was breathing. The figure on the left shows a plot ofR(xsi),BP(r;t)measured at theith reference radar, where parameterris the value that con-vertsτinto distance. The figure on the right shows a plot ofS(xsi),BP(r;λ)corresponding to the figure on the left. In
the plot ofRxs(3,BP) (r;t), a periodic signal is observed at 3.2 m, which is the distance between the radar and the per-son. Additionally, a similar movement is detected at 5.1, 6.2, and 6.6 m, which was caused by the multiple reflec-tions that include the target and other objects on their reflection paths [17]. This phenomenon is also conspicu-ously observed in the frequency domain (see the plot of
Sxs(3),BP(r;λ)).
The distance to a potential target and breath frequency are determined by the following two steps. First, the val-ues of distancer, where the energy of signalRxs(i),BP(r;t)is concentrated, are determined. This can be accomplished
by finding values of r where
∞
−∞
S(xsi),BP(r;λ)2dλ has local peaks in the region where it exceeds the specific threshold [26]. Then, denoting the value of the distance obtained here byrj, find the values of frequencyλwhere
old. The points indicated by the circle in the figures on the right column represent the distance and frequency information detected using the method described in the above. Among the several points detected, only one con-tains the information on the actual target distance and breath frequency, whereas the other points are all erro-neously detected. Figure 4 illustrates this phenomenon. In the figure, path number 1 is the direct path reflected by a human body, path number 2 receives static background signals, and path number 3 contains multiple reflections from a human body and background objects together. When the reference signal is subtracted from the received signal, the indirectly reflected signal received via path number 3 cannot be removed, whereas the static back-ground signal can be removed. Because of this, a system might falsely detect another target other than the actual target.
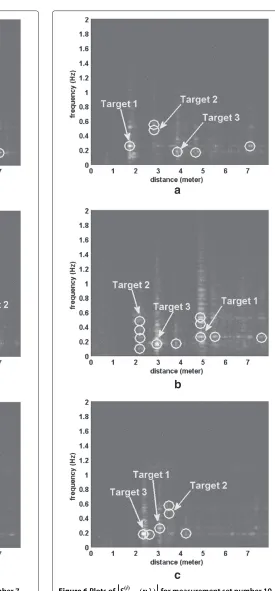
Figure 5 shows the measured results of measurement set number 7, when two persons were breathing. In the plot ofS(xs1,BP) (r;λ), it is noted that the two people are located at almost the same range from radar 1, while they breathe at different frequencies. In this case, the two people can be distinguished only by their breath frequencies and not by their ranges. At this distance, other frequency compo-nents are also detected along with the two targets’ breath frequencies, which is indeed the detection of the har-monic components due to the regular movements of the human body as a result of breathing. The measured results of measurement set number 10, where three persons were breathing, also show false alarms due to the harmonics as well as indirect reflections. In this study, additional filter-ing was not applied to remove the harmonic components at a detection step, which was performed in the study of [20]. Instead, it was possible to remove the false alarms due to the harmonic components at the data association step. If two persons breathe with almost the same fre-quency at different distances from the radar, two targets can be distinguished using the distance information. How-ever, if two persons breathe with similar frequencies at a similar distance from the radar, it would be very difficult to distinguish them.
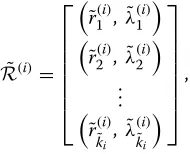
The values detected through the above process at theith radar can form a matrix
a
b
c
Figure 3Plots ofRxs(i),BP(r;t)(left) andS(xsi),BP(r;λ)(right) for measurement set number 1.The circles indicated by the arrows in the plots on the right-hand column represent the distance and breath frequency of the actual target, whereas the remainder indicate false alarms.(a)Results of the measurements at radar 1.(b)Results of the measurements at radar 2.(c)Results of the measurements at radar 3.
where each row vector in the matrix indicates a detected point and it is assumed to satisfyr(1i)≤r2(i)≤ · · · ≤r(ki)
i, ∀i.
The number of observation vectors is denoted byki.
Initial screening
As already mentioned, matrix R(i) defined in (10) can contain signal components received by indirect as well as direct reflections from the human body. In order to
Figure 4Different reflection scenarios.Path number 3 indicates an indirect reflection.
vectors detected from the movement of the same person and r(ji) < r(li), then we can assume that λ(ji) λ(li). Furthermore, because these two points are where
Sxs(i),BP(r;λ)has local peaks, it can be assumed that both S(xsi),BPτj;λjandS(xsi),BP(τl;λl)have the same phase or phase difference of as large asπ. Therefore, we can assume that two vectors that satisfy the following conditions are due to the movement of the same person and thereby remove
whereθλandθpare thresholds, respectively. When more than two observations that satisfy the above conditions exist, a vector detected at the closest distance is chosen, and the others are removed by an assumption that they were detected because of indirect reflections. Now, a new matrixR˜(i)is obtained by the result,
wherek˜iis the number of remaining observations left due
to indirect reflections. Even if this initial screening process
has been conducted, false alarms due to indirect reflec-tions can still remain. In addition to this, as shown in Figures 5 and 6, there can exist vectors generated because of the harmonic components of the signal, and the ini-tial screening process cannot eliminate false alarms due to these vectors. For example, in the measurement set num-ber 1,k3= 4 andk3˜ =2 are obtained whenθp= π
25and
θλ=0.004. It is noted thatk˜3is still greater than the actual number of targets. The false alarms left after the initial screening can be eliminated further in the post-processing presented in the next sections.
Data association and parameter estimation
Now, an observation-target association process is con-ducted, in which observations included in matrices
˜ R(i)3
i=1 are partitioned into the combination of the number of targets. First, a combination that maximizes the likelihood of the observed measurements is searched for, assuming that the number of targets is known as n, and the joint distribution of the measurement errors of the parameters to be estimated is also known. This process is conducted with regard to all possiblenvalues, and during this process, not only the optimal combination but also the optimal values of the location of a target and breath frequency are also found.
If the number of potential targets isn,nsatisfies
1≤n≤N= min
a
c
b
Figure 5Plots ofSxs(i),BP(r;λ)for measurement set number 7. The circles indicated by the arrows represent the distance and breath frequency of the actual targets, whereas the remainder indicate false alarms.(a)Results of the measurements at radar 1.(b)Results of the measurements at radar 2.(c)Results of the measurements at radar 3.
b
c
a
If the location of the jth target isϕj, 1 ≤ j ≤ n, and the two-dimensional spatial point in which theith radar is located isα(i), the distance between thejth target andith
radar, namelyd(ji), can be defined as
d(ji)=α(i)−ϕj. (13)
Here, we try to estimate the locations of n targets,
ϕj n
j=1, using observation matrices ˜
i=1, the following combinations can be considered. Firstly, there is the number of cases in whichnvectors are selected fromk˜iobservations obtained
from theith radar. If we let this number beQi, then
and the number of cases that selectnobservations from
eachR˜(i)s becomes 3
i=1
Qi. Now, we can make(n!)2
dif-ferent configurations, which is the number of cases that makesngroups comprising three vectors by selecting one vector from each R˜(i). Therefore, when the number of potential targets is assumed to be n, the possible total number of combinations,Mn, becomes
Mn=(n!)2·
Here, among the totalMn possible combinations, one
particular combination can be represented as the follow-ing assignment matrix:
where theith row is the permutation ofnvectors selected from the matrixR˜(i), while the first row is arranged such thata(1,1n),m ≤ a2,(1n),m ≤ · · · ≤ an(1,n),m, that is, each row in
matrixCn,mconsists of observations with regard ton
tar-gets obtained in a single radar, while each column consists of three vectors, each vector is obtained in three radars, and these three vectors are assumed to be generated from the same target. Observations that are not included in matrixCn,mare assumed to be false alarms. Indexmis the
index that indicates one ofMnpossible combinations and
satisfies 1≤m≤Mn. Therefore, the total possible
num-ber of the matrixCn,mbecomes N
n=1
Mn, which means the
number of ambiguities. The error between the estimated and measured distances,δj(,in),m, can be defined as
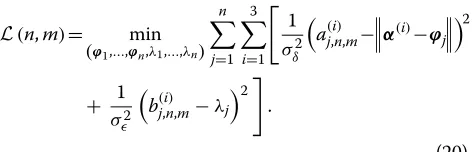
Now, the optimal data association index,μn, is searched for according to the ML criterion. First, let us assume that the distance measurement errors are independently and identically distributed (iid) random variables, each of which has fδ(δ) as its marginal density. Likewise, let us assume that the measurement errors of the breath frequencies are iid random variables having f() as a marginal density, and the distance measurement error and the breath frequency measurement error are independent of each other. Then, the optimal data association index,
μn, can be calculated as
μn=arg max
Here, not only an optimal partition but also optimal val-ues of the location and breath frequency of each target are also searched. If we further assume that the distance mea-surement error and breath frequency meamea-surement error are mean-zero Gaussian random variables havingσδ2and
σ2
as variances, respectively, thenμncan be given as
μn=arg min
Determination of the number of targets
Figure 7Scatter plot of the cost function for measurement set number 7.The marked point on the far left with respect to each value ofn represents the optimal data association index.
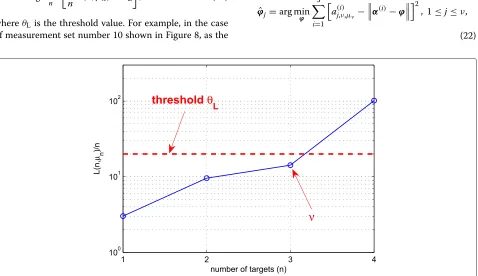
alarm occurring in one radar does not match the detec-tion results in the other radars. In light of this, the present study obtained the estimate ofn, namelyν, by calculat-ing the rate of L(n,μn) according to n and applying a threshold as follows:
ν=arg max
n
1
nL(n,μn) < θL
, (21)
whereθL is the threshold value. For example, in the case of measurement set number 10 shown in Figure 8, as the
value ofnincreases from 3 to 4, the value of 1
nL(n,μn) is shown to be significantly greater thanθL = 20. Once parameterνis obtained, the estimate of the location and breath frequency of thejth target can be determined as follows:
ˆ
ϕj=arg minϕ
3
i=1
a(j,iν),μν −α(i)−ϕ2, 1≤j≤ν,
(22)
b
Figure 9Estimated location and resulting breathing pattern for measurement set number 1.The result was obtained withσδ2=2.5×10⁻³, σ2
=2.5×10⁻⁵, andθL=20.(a)Estimated location of the target.(b)Breathing pattern of the target.
and
ˆ
λj=arg min
λ 3
i=1
b(j,iν),μν −λ2, 1≤j≤ν, (23)
respectively.
Summary of the estimation algorithm
The estimation process of the number of targets, location, and breath frequency can be summarized as follows:
1. Cross-spectral densityS(xsi),BP(τ;λ)is calculated
from signalr(i)(τ;t)3i=1measured at each reference radar.
2. Distance and breath frequency information of potential targets is detected fromS(xsi),BP(τ;λ). Using the observations obtained at this step, matrix
R(i)is generated.
3. Among the observations detected at each radar, those that have a high probability of being generated by indirect reflections are searched and removed. These can be searched by comparing the frequency information of the observation and phase of the corresponding spectral density.
4. Using the observations left, matrixR˜(i)is generated. Here, if the number of the observations included in
˜ R(i)isk˜
i, the number of potential targets,n, satisfies
1≤n≤N= min
1≤i≤3k˜i.
5. Letn=1.
(a) With regard to all the possible combinations that createn groups, each group consists of three observations selected from matrices
˜ R(i),3
i=1, and matrix
Cn,m Mn
m=1is
a
b
Figure 10Estimated locations and resulting breathing patterns for measurement set number 7.The result was obtained with σ2
δ =2.5×10⁻³,σ2=2.5×10⁻⁵, andθL=20.(a)Estimated locations of the targets.(b)Breathing pattern of target 1 (upper) and target 2 (lower).
(b) The optimal data association index,μn, is searched for according to the ML criterion.
6. Increasen by 1. Ifn≤N, go to step 5a; otherwise, go to step 7.
7. By finding a value ofn where a ratio ofL(n,μn)
according ton is increased above a specific threshold value, this value is selected as the estimate,ν, of the number of targets.
8. The ML estimates,
ˆ ϕj
ν
j=1and
ˆ λj
ν
j=1, of the
location and breath frequency ofνtargets are determined, respectively.
Test results
a
b
Figure 11Estimated locations and resulting breathing patterns for measurement set number 10.The result was obtained with σ2
δ =2.5×10⁻³,σ2=2.5×10⁻⁵, andθL=20.(a)Estimated locations of the targets.(b)Breathing pattern of target 1 (upper), target 2 (middle),
EURASIP
Journal
o
n
W
ireless
C
ommunications
and
N
etworking
2014,
2014
:145
Page
13
of
15
Table 1 Summary of the test results on 10 experiment sets
Measurement Number Number of Number Estimated number Location Estimate of breathing
number of targets observation vectors of ambiguities of targets error (m) frequency (Hz)
k1 k2 k3 k˜1 k˜2 k˜3 Target 1 Target 2 Target 3 Target 1 Target 2 Target 3
1 1 3 6 4 3 2 2 24 1 0.1393 - - 0.23 -
-2 1 4 5 3 2 2 2 12 1 0.1397 - - 0.21 -
-3 1 3 7 1 3 7 1 21 1 0.1709 - - 0.20 -
-4 1 3 2 2 2 1 1 2 1 0.1239 - - 0.26 -
-5 1 4 5 4 1 1 4 4 1 0.0634 - - 0.30 -
-6 2 5 3 7 3 3 6 1,314 2 0.0831 0.1134 - 0.23 0.44
-7 2 6 5 6 6 3 6 17,208 2 0.2087 0.1583 - 0.41 0.17
-8 2 3 4 3 3 3 3 171 2 0.0350 0.2501 - 0.21 0.42
-9 2 3 2 4 2 2 3 24 2 0.0184 0.0221 - 0.24 0.24
described in the previous sections was applied to 10 sets of measurement data. Figures 9, 10, 11 show the detected results of the target location and breath pat-terns measured at measurement set numbers 1, 7, and 10. Part (b) in each figure shows the results of finding loca-tions of targets using combinaloca-tions selected through the observation-target association process. Additionally, the breath pattern of each target shown in part (c) of each figure shows one of the results obtained at three radars. Table 1 shows the summary of the test results on 10 experiment sets. The average positioning error is approx-imately 12.7 cm, which is very small. It was found that as the number of targets increases, in particular, under the presence of many false alarms, the number of ambi-guities becomes very large. For example, in the case of measurement set number 10, 1,201,420 ambiguities were obtained.
Conclusions
The present study proposed a detection technique for the location and breathing pattern of an unknown number of people. The algorithm proposed in this study was applied to 10 data sets measured in an indoor environment and exhibited a significantly high level of estimation accuracy. Through the initial screening process via frequency anal-ysis, a considerable number of false alarms occurring at the detection process could be removed. More remark-ably, false alarms, which were not removed by the initial screening, were removed effectively at the data associ-ation process. The test results of 10 experimental sets introduced in this study show that all of the false alarms were removed completely. It is an interesting finding of this study that not only the distance information but also breath frequency information of the target can be highly useful in data association.
Because we employed a brute-force approach for data association, the number of ambiguities increased combi-natorially as the number of targets increased, in particu-lar, under the presence of many false alarms. Moreover, because the experiments introduced in this study were conducted in a well-controlled environment, they are likely to have more false alarms in a complicated envi-ronment such as search-and-rescue situations than in our experimental environment. This will create a heavy com-putational load, so an application with a more efficient data association technique will be required for future work.
Consent
Written informed consent were obtained from the pa-tients for the publication of the accompanying image.
Competing interests
The authors declare that they have no competing interests.
Acknowledgements
This research was supported by the Basic Science Research Program through the National Research Foundation of Korea (NRF) funded by the Ministry of Education, Science and Technology (2010-0025422). The authors would like to thank Taechong Cho, Dongbok Ki, Bong Ho Cho, and Jihoon Yoon for their assistance in taking the measurements mentioned in this paper.
Author details
1Korea District Heating Corp., 463-908 Seongnam, South Korea.2School of Computer Science and Electrical Engineering, Handong University, 791-708 Pohang, South Korea.
Received: 15 January 2014 Accepted: 26 August 2014 Published: 8 September 2014
References
1. VM Lubecke, O Boric-Lubecke, G Awater, P-W Ong, P Gammel, R-H Yan, JC Lin, Remote sensing of vital signs with telecommunications signals, in
World Congress on Medical Physics and Biomedical Engineering (WC2000)
(Chicago, IL, USA, 23–28 July 2000)
2. A Droitcour, VM Lubecke, J Lin, O Boric-Lubecke, A microwave radio for doppler radar sensing of vital signs, inProceedings of 2001 IEEE MTT-S International Microwave SymposiumPhoenix, AZ, USA, 20–24 May 2001, pp. 175–178
3. C Li, J Lin, Complex signal demodulation and random body movement cancellation techniques for non-contact vital sign detection, in
Proceedings of 2008 IEEE MTT-S International Microwave Symposium Digest
Atlanta, GA, USA, 15–20 June 2008, pp. 567–570
4. EM Staderini, UWB radars in medicine. IEEE Aerospace Electron. Syst. Mag.
17(1), 13–18 (2002)
5. Y Chen, E Gunawan, KS Low, Y Kim, CB Soh, AR Leyman, LL Thi,
Non-invasive respiration rate estimation using ultra-wideband distributed cognitive radar system, inProceedings of the 28th Annual International Conference of the IEEE Engineering in Medicine and Biology Society (EMBS 2006)New York, NY, USA, 30 Aug–3 Sept 2006, pp. 920–923
6. I Immoreev, T-H Tao, UWB radar for patient monitoring. IEEE Aerospace Electron. Syst. Mag.23(11), 11–18 (2008)
7. H Soganci, S Gezici, O Arikan, A bayesian approach to respiration rate estimation via pulse-based ultra-wideband signals, inProceedings of 2009 IEEE International Conference on Ultra-Wideband (ICUWB 2009)Vancouver, BC, Canada, 09–11 Sept 2009, pp. 9–11
8. JCY Lai, Y Xu, E Gunawan, PA Chua EC-Maskooki, YL Guan, K-S Low, CB Soh, C-L Poh, Wireless sensing of human respiratory parameters by low-power ultrawideband impulse radio radar. IEEE Trans. Instrum. Meas.
60(3), 928–938 (2011)
9. J Salmi, AF Molisch, Propagation parameter estimation, modeling and measurements for ultrawideband MIMO radar. IEEE Trans. Antennas Propag.59(11), 4257–4267 (2011)
10. MYW Chia, SW Leong, CK Sim, KM Chan, Through-wall UWB radar operating within FCC’s mask for sensing heart beat and breathing rate, in
Proceedings of 2005 European Radar Conference (EURAD 2005)Paris, France, 03–04 Oct 2005, pp. 267–270
11. J Sachs, M Aftanas, S Crabbe, M Drutarovsk, R Klukas, D Kocur, TT Nguyen, P Peyerl, J Rovnakova, E Zaikov, Detection and tracking of moving or trapped people hidden by obstacles using ultra-wideband pseudo-noise radar, inProceedings of 2008 European Radar Conference (EuRAD 2008)
Amsterdam, Netherlands, 30–31 Oct 2008, pp. 408–411
12. B Levitas, J Matuzas, UWB radar for breath detection, inProceedings of the 11th International Radar Symposium (IRS 2010)Vilnius, Lithuania, 16–18 July 2010, pp. 1–3
13. S Singh, Q Liang, D Chen, L Sheng, Sense through wall human detection using UWB radar. EURASIP J. Wireless Commun. Netw.2011, 1–11 (2011) 14. W Li, X Jing, Z Li, J Wang, A new algorithm for through wall human
respiration monioring using GPR, inProceedings of the 14th International Conference on Ground Penetrating RadarShanghai, China, 04–08 June 2012, pp. 947–952
16. K Higashikaturagi, Y Nakahata, I Matsunami, A Kajiwara, Non-invasive respiration monitoring sensor using UWB-IR, inProceedings of the 2008 IEEE International Conference on Ultra-Wideband (ICUWB 2008)Hannover, Germany, 10–12 Sept 2008, pp. 101–104
17. J Li, L Liu, Z Zeng, F Liu, Simulation and signal processing of UWB radar for human detection in complex environment, inProceedings of the 14th International Conference on Ground Penetrating RadarShanghai, China, 04–08 June 2012, pp. 1–3
18. E Zaikov, UWB radar for detection and localization of trapped people, in
Proceedings of the 11th International Radar SymposiumVilnius, Lithuania, 16–18 June 2010, pp. 1–4
19. M Baboli, O Boric-Lubecke, V Lubecke, A new algorithm for detection of heart and respiration rate with UWB signals, inProceedings of the 34th Annual International Conference of the IEEE EMBSSan Diego, CA, USA, 28 Aug–01 Sept 2012, pp. 3947–3950
20. A Lazaro, D Girbau, R Villarino, Analysis of vital signs monitoring using an IR-UWB radar. Prog. Electromagnetics Res.100, 265–284 (2010) 21. A Sharafi, M Baboli, M Eshghi, A Ahmadian, Respiration-rate estimation of
a moving target using impulse-based ultra wideband radars. Australas Phys. Eng. Sci. Med.35(1), 31–39 (2012)
22. M Leib, W Menzel, B Schleicher, H Schumacher, Vital signs monitoring with a UWB radar based on a correlation receiver, inProceedings of the Fourth European Conference on Antennas and Propagation (EuCAP 2010)
Barcelona, Spain, 12–16 April 2010, pp. 1–5
23. CL Morefield, Application of 0-1 integer programming to multitarget tracking problems. IEEE Trans. Automatic Control.22(3), 302–312 (1977) 24. C Kim, J-Y Lee, T Cho, D Ki, BH Cho, J Yoon, Multi-target localization of
breathing humans, inProceedings of the 2013 IEEE International Conference on Ultra-Wideband (ICUWB 2013)Sydney, Australia, 15–18 Sept 2013, pp. 49–54
25. S Venkatesh, CR Anderson, NV Rivera, RM Buehrer, Implementation and analysis of respiration-rate estimation using impulse-based UWB, in
Proceedings of the 2005 Military Communications Conference (MILCOM 2005)Atlantic City, NJ, USA, 17–20 Oct 2005, pp. 3314–3320
26. NV Rivera, S Venkatesh, C Anderson, RM Buehrer, Multi-target estimation of heart and respiration rates using Ultra Wideband sensors, in
Proceedings of the 2006 European Signal Processing ConferenceFlorence, Italy, 04–08 Sept 2006
27. W Chunming, D Guoliang, The study of UWB radar life-detection for searching human subjects, inProceedings of the 2012 International Conference on Future Electrical Power and Energy SystemSanya, China, 21–22 Feb 2012, pp. 1028–1033
doi:10.1186/1687-1499-2014-145
Cite this article as:Kim and Lee:ToA-based multi-target localization and respiration detection using UWB radars.EURASIP Journal on Wireless Communications and Networking20142014:145.
Submit your manuscript to a
journal and benefi t from:
7Convenient online submission
7Rigorous peer review
7Immediate publication on acceptance
7Open access: articles freely available online
7High visibility within the fi eld
7Retaining the copyright to your article