Article
1
How Well Can Spaceborne Digital Elevation Models
2
Represent a Man-Made Structure: a Runway Case
3
Study
4
Kazimierz Becek 1,*, Volkan Akgül 2, Samed Inyurt 2, Çetin Mekik 3, and Patrycja Pochwatka 4
5
1 Wroclaw University of Science and Technology, Wroclaw, Poland; [email protected]
6
2 Zonguldak Bulent Ecevit University, Zonguldak, Turkey; [email protected]
7
2 Zonguldak Bulent Ecevit University, Zonguldak, Turkey; [email protected]
8
3 Hacettepe University, Ankara, Turkey; [email protected]
9
4 University of Life Sciences in Lublin, Lublin, Poland, [email protected]
10
11
* Correspondence: [email protected]
12
13
Abstract: In this case study, an active runway of a civilian airport in Zonguldak, Turkey, is used to
14
assess the suitability of spaceborne digital elevation models (DEMs) to model an anthropogenic
15
structure. The tested DEMs include the ASTER, the AW3D30 m, the SRTM-1”, the SRTM-3”, the
16
SRTM-X, the TanDEM-3”, and the WorldDEMTM. A photogrammetric high accuracy DEM was also
17
available for the tests. As a reference dataset, a line leveling survey of the runway using a Leica
18
Sprinter 150/150M instrument was performed. The selection of a runway as a testbed for this type
19
of investigation is justified by its unique characteristics, including its flat surface, homogenous
20
surface material, and availability for a ground survey. These characteristics are significant because
21
DEMs over similar structures are free from environment- and target-induced error sources. The
22
most accurate DEM is the WorldDEMTM followed by the SRTM-3” and TanDEM-3”, with vertical
23
errors (LE90) equal to 1.291 m, 1.542 m, and 1.56 m, respectively. This investigation uses a method
24
for identifying the vertical errors in DEMs that is known as the runway method.
25
Keywords: spaceborbe DEM; SRTM; TanDEM; AW3D30m; runway method; Zonguldak; suitability
26
assessment
27
28
29
1. Introduction
30
Significant progress in the construction of sensors, methods, and platforms for the measurement
31
of distance, angle, position, navigation, and timing have been observed for the last few decades. A
32
consequence of this development is the shift from in situ surveying to more convenient and cheaper
33
solutions, whereby geodata are acquired from platforms, such as unmanned aerial vehicles (UAV),
34
aircrafts, and satellites, located at a certain distance from the operator. The Global Navigation Satellite
35
Systems (GNSS), Light Detection and Ranging (LiDAR), and Synthetic Aperture Radar
36
Interferometry (InSAR) are prominent examples of technologies benefiting land surveying and
37
allowing for survey-grade measurements of objects’ locations and dimensions. Over the last
38
approximately twenty-five years, several attempts have been made to develop a global digital
39
elevation model (DEM) of the Earth’s landmasses. There are a few uses for such a consistent, accurate,
40
and global DEM, including applications in the military and in many branches of science. The first
41
such global DEM product is the Shuttle Radar Topography Mission (SRTM) [13]. Since 2004, the
42
SRTM became partially available to the public. InSAR technology was used to produce the SRTM
43
product. Another model, known as the Advanced Spaceborne Thermal Emission and Reflection
44
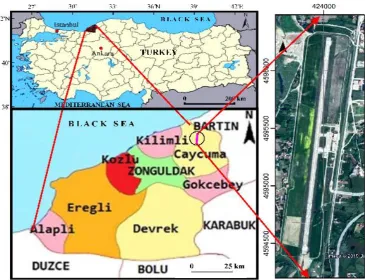
Radiometer (ASTER version 3), is also a space-based DEM product but, in this case, photogrammetry
45
was used [3,7,8,11] to develop the ASTER product. In addition, there are three recent DEM products
46
available: the TanDEM-3” [18], the WorldDEMTM [15], and the AW3D30m [10,15-17]. The former
47
was developed from the TerraSAR-X/TerraDEM-X satellite data (InSAR method), while the latter was
48
developed from the Advanced Land Observing Satellite (ALOS) mission data, using
49
photogrammetry. The spatial resolution of these DEMs varies between 12 m and 90 m (at the
50
equator). It is anticipated that the spatial resolution of future DEM products will be even higher, and
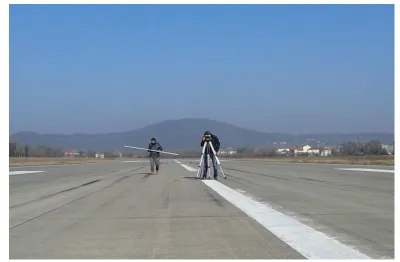
51
the vertical and horizontal accuracy will increase. This process will benefit a number of surveying
52
projects that could be performed using remotely operated data acquisition platforms.
53
The aim of this case study is to contribute to the body of knowledge on the suitability and fidelity
54
of an engineering structure representation using currently available spaceborne DEMs. While the
55
topic of DEM vertical/horizontal accuracy assessment has already been investigated in several
56
papers, this paper’s approach differs from previous studies by the type of reference data used.
57
Reference data sets typically used in investigations of DEM accuracy include a higher accuracy DEM
58
[17], reference benchmarks [7,18], and profiles or cross-sections along a known higher accuracy DEM
59
[14]. However, conclusions drawn from these investigations may be biased due to: a) not considering
60
terrain steepness, b) comparing point elevation against pixel elevation (area), and c) arbitrarily
61
selecting cross-sections without considering the terrain’s anisotropy. In the present study, an airport
62
runway is used as a testbed. This engineering structure possesses unique features that eliminate the
63
abovementioned limitations of other types of reference datasets. The preferred features of runways
64
as testbeds for DEM vertical accuracy assessment studies include the horizontal orientation (no
65
slope), dimensions (typically a length > 1000 m and a width > 15 m), typically homogenous material,
66
and surface roughness. Additionally relevant for this type of study, the data are in the public domain,
67
e.g., [5].
68
The objectives of the present study leading to the aim formulated above include:
69
Calculating the statistical indicators of the differences between the surveyed runway surface and
70
the corresponding surface extracted from the investigated DEMs.
71
Analyzing the statistics of the differences, drawing conclusions and recommendations for
72
engineering structure surveyors and operators on the suitability of the freely available or
73
reasonably priced spaceborne DEMs for monitoring anthropogenic or natural features.
74
In this context, the present study investigates the following DEMs: the ASTER v.2, the AW3D30,
75
the airborne photogrammetric DTM, the SRTM (both 1” and 3”), the SRTM-X, the TanDEM, and the
76
WorldDEMTM.
77
The adopted study method, the runway method (RWYM) [4], possesses the ultimate feature of
78
allowing comparisons of the instrument- or method-induced component of DEM errors, which is a
79
fundamental question to be answered before a DEM source is selected for a given project. The
80
findings of this study indicate that, in a vertical accuracy–wise sense, photogrammetry produces the
81
most accurate results. However, there are some situations where the InSAR method is more suitable.
82
2. Materials and Methods
83
2.1. Area of Interest
84
The testbed used in this study is a runway (18–36) at the Zonguldak Airport, located 8 km to the
85
north of Ç aycuma, Turkey (Lat = 41°30'25''N; Lon = 32°05'23''E), approximately 12.5 m above the mean
86
sea level. According to the official airport’s chart, the geoid undulation is 34.14 m (EGM2008 33.489
87
m). Figure 1 shows the location of the runway.
89
Figure 1. Location of the Zonguldak Airport, including its runway (18–36). Source: Image: Google
90
Earth® ; Maps: own work. Coordinates: WGS84/UTM36T.
91
Some of the runway’s relevant physical parameters are listed in Table 1.
92
93
Table 1. Selected physical characteristics of the runway used as a testbed in this study. Source: AIP
94
Turkey, 2016.
95
Parameter Value
Length (m) 1881 Width (m) 30 Threshold elevation a.m.s.l. (18/36) (m) 12.45/13.3
Surface Concrete Slope (centerline) 0.05% Cross-slope (left/right from centerline) 1.0%
96
The runway was constructed in the 1960s. Very low air traffic at the airport allowed for easy
97
access to perform the optical leveling. Figure 2 shows the runway’s centerline profile and the profile
98
as per aeronautical documentation. It is assumed that the declared profile is an “as constructed”
99
profile of the runway. The maximum discrepancy between the declared and leveled profiles is 0.993
100
m. While the negative discrepancy between the profiles shown in Figure 2 can easy be explained by
101
land subsidence, the positive discrepancies in the profile’s righthand side is probably due to the
102
recent extension of the runway’s length.
104
Figure 2. Leveled vs. declared centerline runway profile.
105
Figure 3 shows the leveling of the runway in progress.
106
107
Figure 3. Leveling of the runway in progress. Photo: K. Becek
108
2.2. Digital Elevation Data
109
In the following sections, the DEMs investigated in this experiment are briefly outlined. The
110
dataset used in this study is available as a supplementary material.
111
2.2.1 ASTER
112
The Advanced Spaceborne Thermal Emission and Reflection Radiometer (ASTER) version 3 is a
113
global DEM. The spatial resolution of the product is 1” (approx. 30 m at the equator). The DEM covers
114
the Earth’s surface from 82N to 82S. The ASTER version 3 was produced from the previous versions
115
by removing outliers, thanks to the inclusion of additional data. The ASTER was produced using the
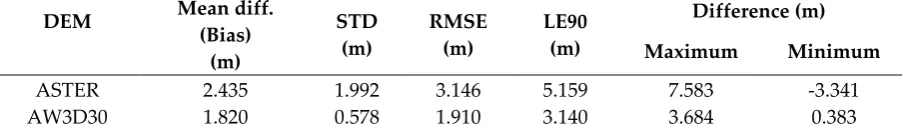
116
photogrammetry method [6] and processing over 2 million stereopairs. The ASTER data are
117
distributed free of charge in a form of one-by-one-degree tiles [3,7,8,11].
2.2.2 AW3D 30m
119
The AW3D 30m is a DEM developed using data captured by the Panchromatic Remote Sensing
120
Instrument for Stereo Mapping (PRISM) installed on board the ALOS satellite. An automatic stereo
121
matching method was used. The AW3D 30m data are available for free at a 1 arcsec resolution
122
(approx. 30 m at the equator). The DEM is a resampled version of the original DEM available for free
123
at a 5 m resolution. The AW3D 30m is distributed as “average” and “median,” with the difference in
124
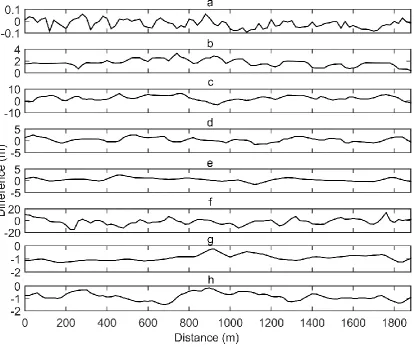
the resampling kernel used. The average version of the AW3D 30m is used in the study. The
125
elevations are rounded off to the closest meter and are referenced to the EGM96 geoid. The GRS80
126
datum is used for the geographic coordinates [10,15].
127
The target vertical accuracy of the AW3D 30m is 5 m (one sigma). This figure seems to be rather
128
pessimistic provided that some researchers demonstrated that the vertical accuracy is 4.10 m (RMSE)
129
[15] or 4.29 m (built-up areas) [14].
130
2.2.3 Aerial Photogrammetry (AP)
131
For the area of interest (AOI), an aerial photogrammetry–developed DEM is available. The AP
132
model was captured and processed in 2010. The UltraCamX camera was used to capture the aerial
133
photos from an altitude of 1530 m above the ground. The model’s pixel size is 10 cm. The vertical
134
accuracy of the model is approximately 10 to 15 cm (one sigma). The project was funded by the
135
Natural Disaster Insurance Institution (TCIP) and carried out by the Directorate General of
136
Geographic Information Systems, Turkey.
137
2.2.4 Leveling
138
Line leveling was performed using the automatic Leica Sprinter 150/150M Electronic Level
139
Package along with two barcoded leveling staff with a built-in dumpy level and without support.
140
The manufacturer’s height accuracy specification is (one standard deviation) 1.5 mm/km double run
141
(ISO 17-123-2). The line leveling was conducted along the centerline of the runway and included
142
intermediate sights on both sides of the centerline (on the edge and in the middle between the edge
143
and centerline). The 25 m distance between the instrument and staff was maintained. The leveling
144
was referenced to a nearby benchmark of Turkey’s national heighting system. The leveling loop’s
145
disclosure was 3 mm. The leveled spot elevations were used to interpolate 475 spot elevations that
146
formed a rectangular grid, 9 m x 20 m, oriented parallel to the runway’s centerline. These interpolated
147
points were used as control spot elevations in this study.
148
2.2.5 SRTM-1”and SRTM-3”
149
The SRTM-1” and SRTM-3” elevation data products are perhaps the best known in many
150
branches of science. The data for the DEM were acquired during an 11-day mission of the space
151
shuttle Endeavor in 2000. A technique known as Synthetic Aperture Radar Interferometry (InSAR)
152
was used to develop both DEMs. The products are distributed free of charge at 1” and 3” (30 m or 90
153
m at the equator). The DEM’s three-arc second version is a resampled version of the one arc-second
154
version. Many tests of the DEMs [2,3] showed that the vertical accuracy of the SRTM data product is
155
at a level of approximately 2 m (one sigma) or 3.3 m (LE 90%), which is well over the required 16 m.
156
The SRTM-3” version exhibits less high frequency noise in elevation because the noise was
157
significantly reduced by the averaging filter applied during the resampling operation. This SRTM
158
version was produced using the Synthetic Aperture Radar (SAR) system working in band C (λ =
159
approx. 5.6 cm) of the electromagnetic waves. Both versions of the SRTM DEM are investigated in
160
this contribution.
161
2.2.6 SRTM-X
162
The SRTM-X is a product of a different instrument than that used for the production of the SRTM
163
DEM flown on board the space shuttle Endeavor during its mission in 2000. The SAR system used
164
the X band (λ = approx. 3.1 cm) of the electromagnetic spectrum. The X-band system was jointly
developed by the Italian and German space agencies. The SRTM-X product is available at the one
arc-166
second resolution.
167
2.2.7 TanDEM-3” (TanDEM)
168
The TanDEM-3” is a just-published (11/05/2019) DEM data product developed from the
169
TanDEM-X DSM by down sampling to a resolution of 3” (90 m at the equator). The TanDEM-3” is a
170
digital surface product available free of charge from https://geoservice.dlr.de/web/dataguide/tdm90/.
171
Since the resampling procedure used an averaging filter, which is known to reduce high frequency
172
noise, the relative elevation error should be smaller than that of the WorldDEM-3”.
173
2.2.8 WorldDEMTM
174
The WorldDEM™ is the commercial digital terrain model (DTM) developed from the data
175
acquired by the German TanDEM-X satellite program [9]. The WorldDEM™ is an edited version of
176
the digital surface model (DSM) from which artefacts and objects located above the ground were
177
removed [4]. The model’s spatial resolution is 0.4” (or approximately 12 m at the equator). The
178
absolute vertical accuracy of the WorldDEM™ (LE 90% based on global product) is < 10 m, but recent
179
studies indicate that it is “outperforming the requirement by a factor of five” [18]. A separate study
180
produced an estimate for the absolute vertical accuracy of the WorldDEM™ (the instrument- and
181
environment-induced error sources only) at a level of < 1 m [4].
182
2.2.9 Aeronautical Data on the Runway
183
In this project, the runway elevation data were also used to compare with the corresponding
184
DEMs elevations. The aeronautical data on runways are in the public domain and available from the
185
Aerodrome Obstacle Chart publication [5].
186
2.3. Data Processing
187
The RWYM was conceived in 2008 [2]. The RWYM assumes that the height error in a DEM is
188
composed of three independent error sources: the instrument-induced error, the
environment-189
induced error, and the target-induced error. This can be expressed as follows in Equation (1):
190
𝜎𝐷𝐸𝑀2 = 𝜎𝐼2+ 𝜎𝐸2+ 𝜎𝑇2, (1)
where 𝜎∗2 is the variance of DEM (DEM) error: instrument-induced (I),
environment-induced (E), and target-environment-induced (T).
While the instrument- (I) and environment-induced (E) errors can be managed by surveyors by
191
selecting a more accurate instrument or mitigating the environmental conditions during data
192
collections, the target-induced error (T) is due to the very nature of the terrain surface’s discrete
193
representation. As was demonstrated [2], the target-induced error can be estimated as follows in
194
Equation (2):
195
𝜎𝑇2 =
1
12𝑑
2𝑡𝑎𝑛2
(𝑠),
(2)where 𝑑 is the DEM pixel size, and s is the terrain slope at a particular pixel.
The target-induced error is equal to zero when the slope is zero. This observation, along with
196
Equation (1), leads to a directive that DEM vertical accuracy assessments should be performed on flat
197
surfaces (slope = 0). Thus, only the instrument- and environment-induced errors will be captured,
198
which is very important in the case of the SAR interferometry method of DEM production, simply
199
because the whole process is extremely complicated. Hence, the instrument accuracy estimation is
very difficult. In this investigation, 475 control points located on the runway’s surface were used as
201
the reference data. The elevation of the control points was obtained by line leveling. The bilinear
202
interpolation method was used to calculate the corresponding elevations of the investigated DEMs.
203
To visualize the discrepancies between the investigated DEMs and the reference elevations,
204
centerline profiles of the differences were created, which allow for a visual inspection and qualitative
205
assessment of the discrepancies’ behaviors.
206
The following data-processing steps were taken to estimate the vertical accuracy of the
207
investigated DEMs (i.e., the instrument- and environment-induced error components):
208
209
1. Using a bilinear interpolation method, the elevation for the locations corresponding to 475 control
210
points were calculated for each investigated DEM;
211
2. The discrepancies between the interpolated elevation and the control point elevation were
212
calculated for each investigated DEM;
213
3. The mean (D) and standard deviation (σ) of the differences were calculated for each DEM;
214
4. The root mean square error (RMSE) of the differences for each DEM was calculated using the
215
following formula:
216
𝑅𝑀𝑆𝐸 = √𝐷2+ 𝜎2
(3)
5. A histogram of differences was calculated for each DEM; and
217
6. The Laplace probability density function (pdf) was calculated according to Equation (4):
218
𝑓(𝑥; 𝑚, 𝑎) = 1 2𝑎𝑒
−|𝑥−𝑚|
𝑎 (4)
The maximum likelihood estimator of m is the median of the differences, and the maximum
219
likelihood estimator of a is given by Equation (5):
220
𝑎 =1
𝑛∑ |𝑥𝑖− 𝑚| 𝑛
𝑖=1 , (5)
where n is the number of samples (475 in this case).
221
3. Results
222
Table 2 shows the statistics of the differences between the investigated DEMs and the
223
corresponding leveled spots on the runway. As expected, photogrammetric DEM is the most
224
accurate. Its RMSE is approximately 6 cm, and its bias is equal to -0.002 m. The second-best DEM is
225
the WorldDEMTM, with a standard deviation of 0.327 m. However, this DEM exhibits a significant
226
bias of -0.722 m. Hence, the RMSE is 0.787 m (or 1.291 m – LE90). Note that the TanDEM, in terms of
227
its standard deviation of 0.231 m, is even more accurate than the WorldDEMTM. However, it suffers
228
from a larger bias of -0.923 m which, in terms of its RMSE, makes it slightly less accurate than the
229
WorldDEMTM. The third best–performing DEM is the AW3D30, with a standard deviation of 0.578
230
m, which is comparable to that of the WorldDEMTM. However, the bias is 1.82 m, leading to an
231
RMSE of 1.91 m (or 3.14 m – LE90). The worst-performing DEM is the SRTM-X, with a standard
232
deviation of 5.209 m and a bias of -1.570 m.
233
Table 2. Statistics of the differences between the investigated DEMs and the leveled spots on the
234
runway (DEM minus the reference elevation).
235
DEM Mean diff.
(Bias) (m)
STD (m)
RMSE (m)
LE90 (m)
Difference (m)
Maximum Minimum
AP -0.002 0.064 0.064 0.105 0.174 -0.238 SRTM-1” 0.580 0.990 1.147 1.882 3.392 -1.652 SRTM-3” 0.614 0.712 0.940 1.542 2.705 -1.656 SRTM-X -1.570 5.209 5.440 8.922 13.631 -14.977 TanDEM -0.923 0.231 0.951 1.560 -0.233 -1.286 WorldDEMTM -0.722 0.327 0.787 1.291 0.113 -1.493
236
The SRTM-X elevations were converted to orthometric elevations by subtracting the geoid
237
undulation provided in the aeronautical information on the runway.
238
Figure 4 shows plots of the difference between each DEM and the leveling along the runway’s
239
centerline. Note the different vertical scale for the plots.
240
241
242
Figure 4. Plots of height differences between profiles extracted from the investigated DEMs minus the
243
leveling along the runway’s centerline: a. Aerial photogrammetry DEM; b. ASTER; c. AW3D30; d.
244
SRTM-1”; e. SRTM-3” f. SRTM-X; g. TanDEM; h. WorldDEMTM. Note the different vertical scales on
245
the vertical axes.
246
Table 3 shows the parameters of the Laplace probability density function that were calculated
247
using the maximum likelihood estimator [12]. These parameters were used to produce the Laplace
248
pdf graph shown in Figure 5 on top of the histograms of the discrepancies between the investigated
249
DEMs minus the reference elevations.
250
Table 3. Parameters of the Laplace probability distribution function estimated using the maximum
251
likelihood estimator from the discrepancies between the investigated DEMs and the reference
252
DEM
m – Median of differences
(m)
a – Equation (5)
(m)
ASTER 2.546 1.619 AW3D30 1.774 0.439 AP -0.002 0.047 SRTM-1” 0.568 0.813 SRTM-3” 0.624 0.553 SRTM-X -1.875 3.694 TanDEM -1.494 0.200 WorldDEMTM -0.724 0.251
254
Figure 5 shows the histograms of the differences and the Laplace probability density function.
255
256
Figure 5. Histograms of the differences between the investigated DEMs and leveling : a. Aerial
257
WorldDEMTM. A theoretical Laplace probability density function is also shown. The function
259
parameters were estimated using the experimental data. They are shown in Table 3.
260
4. Discussion
261
The comparison of the elevation of 475 control points evenly distributed across a runway’s
262
homogenous, almost flat surface provided an opportunity to assess the vertical accuracy of DEM
263
models in a unique way. A typical approach to test a DEM employs sparsely distributed control
264
points (e.g., GPS stations) located at various types of terrain cover and topography (slope).
265
Alternatively, a higher accuracy DEM is used. However, the DEM vertical error model indicates that
266
both terrain cover and topography also control DEM accuracy. Therefore, a flat and homogenous
267
surface as a test bed largely eliminates the impact of these target- and environment-induced error
268
sources. Hence, the results obtained in this study represent the DEMs’ instrument-induced error
269
sources, allowing a biasless comparison of the instruments’ performance and the methods used to
270
generate these DEMs.
271
Analyzing Table 2, one may conclude the following: 1) The bias in the case of
photogrammetry-272
derived models (ASTER and AW3D30) is positive and reaches approximately 2 m. The bias for the
273
XBand InSAR–derived DEMs (SRTMX, TanDEM, and WorldDEMTM) is negative of the order of
-274
1 m. Simultaneously, the elevation bias of the C-Band InSAR–derived DEM (SRTM-1”/3”) is the
275
lowest and of the order of 0.6 m. The global DEMs’ bias issue was noted in the previous literature
276
[1,3] and is believed to be due to the calibration of the SAR data (performed over the ocean), the
277
accuracy of the ground control points (GCPs), and/or the accuracy of the geoid. This bias could be
278
locally eliminated by estimating it using a few checkpoints with known elevations from an
279
independent survey. 2) The standard deviation column in Table 2 represents the relative or
point-to-280
point DEM accuracy and, therefore, is most important for the engineering applications. The lowest
281
level of the standard deviation is exhibited by the TanDEM and WorldDEMTM, at 0.231 m and 0.327
282
m, respectively. Surprisingly, the lower resolution TanDEM’s better performance than that of the
283
WorldDEMTM is a result of the averaging effect of the down-sampling procedure used to produce
284
the 1” TanDEM model from the 0.4” original data. A similar effect can be observed in the case of the
285
SRTM-3” vs. the SRTM-1” DEMs, for which the standard deviation is 0.990 m and 0.712 m,
286
respectively. Judging by the numbers, one might conclude that a lower resolution DEM performs
287
better than a higher resolution one (e.g., the SRTM-1” vs. the SRTM-3”). This deception can be
288
explained by the fact that the results shown in Table 2 cover only the instrument-induced error
289
source. In other words, they are good for a flat and horizontal surface. In the case of flat surfaces, the
290
target-induced error component (Eq. 2) must be added. Thus, the slope of the terrain and the pixel
291
size come into the play. Eq. (2) clearly shows that, in the case of slope terrain, the accuracy is
292
controlled by pixel size. A “break-even point” or a critical slope from which the higher resolution
293
DEM is more accurate than the lower is approximately 1% or 0.613°. The third most accurate DEM in
294
terms of the standard deviation is the photogrammetry-derived AW3D30 model. Hence, this DEM’s
295
higher standard deviation is most likely caused by clouds—the major obstacle of the satellite-based
296
photogrammetric method of DEM production. 3) In terms of the absolute vertical accuracy, the
297
SRTM-3” and TanDEM exhibit almost equal sub-meter readings. However, because of the TanDEM’s
298
1” resolution, its superiority over the SRTM-3” model will be evident in an even slightly undulated
299
surface. The AW3D30 is significantly less accurate due to the level of bias, which can be easily locally
300
estimated and compensated for. 4) The graphs shown in Figure 3 do not reveal the existence of any
301
clear trend, and they are also not correlated, suggesting that the differences are random and
302
independent events. 5) The histograms of the differences shown in Figure 4 should resemble the
303
Laplace probability density function, which can be visually verified. This is very visible in the case of
304
the AP-derived DEM in particular.
305
5. Conclusions
306
The present study on the accuracy of the digital representation of the vertical dimension of a
307
man-made structure using spaceborne DEMs can be concluded as follows:
309
1. It appears that the spaceborne InSAR technology is more accurate than the traditional
310
photogrammetry based on the satellite imagery for DEM production. The limiting factor is the
311
cloud cover that restricts the number of stereopairs used to develop DEMs e.g., [3].
312
2. The TanDEM dataset is slated to replace the SRTM model as a global DEM due to its higher
313
vertical accuracy and the fact that it is more current than the almost 20-year-old SRTM dataset.
314
3. All the investigated DEMs, except the AP one, exhibit a vertical bias. The reason for the bias is
315
probably related to the DEMs’ vertical calibration. A separate study of the effect is being
316
considered.
317
4. The vertical bias can be locally determined and subtracted from the DEM. This operation will
318
increase the TanDEM’s absolute accuracy to a level of approximately 0.5 m and the AW3D30 to
319
0.6 m (one sigma RMSE).
320
5. Both the TanDEM and AW3D30 spaceborne elevation data are good enough to perform at least
321
preliminary studies on a variety of engineering projects.
322
323
The presented work contributes to the body of knowledge of surveying engineering and similar
324
branches of technology and engineering disciplines, such that one of the most important quantitative
325
representations of the topography of the Earth’s surface, which is a DEM, offer the vertical accuracy
326
level that can satisfy the needs of, at least, a preliminary study of a variety of projects, including
327
hydrotechnical engineering, landscaping, and civil engineering. In addition, there is a clear trend in
328
the availability of more accurate and high spatial resolution DEMs, which will continue for the
329
foreseeable future. Also, this work demonstrates the utility of the runway method of DEM accuracy
330
assessment for the surveying community. This work provides also a first ever accuracy assessment
331
of the latest DEM – the TanDEM.
332
Supplementary Materials: Dataset s1: DTM_Data.zip. The data file is in the csv format. The coordinates are
333
referenced to WGS84/UTM36T.
334
Author Contributions: Conceptualization and methodology K.B; validation, V.A., S.I. and C.M.; formal analysis,
335
P.P.; data curation, P.P.; writing—original draft preparation, K.B.; writing—review and editing, P.P.;
336
visualization, V.A. and S.I.; supervision and administration, C.M.
337
Funding: Please add: “This research received no external funding”.
338
Acknowledgments: The authors are grateful to Dr. Wolfgang Koppe of Airbus Defense and Space for providing
339
the WorldDEM™ data over the AOI free of charge. The assistance of the Directorate General of Geographic
340
Information Systems, Turkey by providing the aerial photogrammetry DTM is kindly acknowledged.
341
Conflicts of Interest: The authors declare no conflict of interest.
342
References
343
1. Bayik, C.; Becek, K.; Mekik, C.; Ozendi, M. On the vertical accuracy of the ALOS world 3D-30m digital
344
elevation model. Remote Sens. Lett 2018, 9(6), 607–615, doi: 10.1080/2150704X.2018.1453174.
345
2. Becek, K. Investigating error structure of shuttle radar topography mission elevation data product.
346
Geophys. Res. Lett 2008, 35(15), L15403, doi: 10.1029/2008GL034592.
347
3. Becek, K. Assessing global digital elevation models using the runway method: The Advanced Spaceborne
348
Thermal Emission and Reflection Radiometer versus the Shuttle Radar Topography Mission Case. IEEE
349
Trans. Geosci. Remote Sens 2014, 52, 4823–4831, doi: 10.1109/TGRS.2013.2285187.
350
4. Becek, K.; Koppe, W.; Kutoğlu, Ş.H. Evaluation of Vertical Accuracy of the WorldDEM™ Using the
351
Runway Method. Remote. Sens 2016, 8, 934, 10.3390/rs8110934.
352
5. EUROCONTROL. The European Organisation for the Safety of Air Navigation. Available online:
353
https://www.ead.eurocontrol.int/eadcms/eadsite/index.php.html, (accessed on Jun. 19, 2019).
354
6. Fujisada, H.; Urai, M.; Iwasaki, A. Advanced methodology for ASTER DEM generation. IEEE Trans. Geosc.
355
7. Gesch, D.; Oimoen, M.J.; Danielson, J.J.; Meyer, D. Validation of the ASTER Global Digital Elevation Model
357
version 3 over the conterminous United States. Int. Arch. Photogramm. Remote Sens. Spatial Inf. Sci 2016,
358
XLI-B4, 143–148, doi: 10.5194/isprs-archives-XLI-B4-143-2016.
359
8. Girod, L.; Nuth, C.; Kääb, A.; McNabb, R.; Galland, O. MMASTER: Improved ASTER DEMs for Elevation
360
Change Monitoring. Remote. Sens 2017, 7, 704, doi: 10.3390/rs9070704.
361
9. Huber, M.; Gruber, A.; Wendleder, A.; Wessel, B.; Roth, A.; Schmitt, A. The Global Tandem-X DEM:
362
Production Status and First Validation Results. Int. Arch. Photogramm. Remote Sens. Spatial Inf. Sci., 2012,
363
XXXIX-B7, 45–50, doi: 10.5194/isprsarchives-XXXIX-B7-45-2012.
364
10. JAXA. ALOS Global Digital Surface Model ALOS World 3D–30m (AW3D30). Available online:
365
http://www.eorc.jaxa.jp/ALOS/en/aw3d30/ (accessed on Aug. 1, 2017).
366
11. JPL. ASTER Global Digital Elevation Map. Available online: https://asterweb.jpl.nasa.gov/gdem.asp
367
(accessed on Jun. 19, 2019).
368
12. Norton, R.M. The Double Exponential Distribution: Using Calculus to Find a Maximum Likelihood
369
Estimator.” Amer. Stat 1984, 38(2), 135–136, doi: 10.1080/00031305.1984.10483185.
370
13. Rabus, B.; Eineder, M.; Roth, A.; Bamler, R. The Shuttle Radar Topography Mission—A new class of digital
371
elevation models acquired by spaceborne radar. ISPRS J. Photogramm. Remote. Sens 2003, 57(4), 241–262,
372
doi: 10.1016/S0924-2716(02)00124-7.
373
14. Santillana, J.; Makinano-Santillana, M. Vertical Accuracy Assessment of 30-m Resolution ALOS, ASTER,
374
and SRTM Global DEMs Over Northeastern Mindanao, Philippines. Int. Arch. Photogramm. Remote Sens.
375
Spatial Inf. Sci 2016, XLI-B4, 149–156, doi: 10.5194/isprsarchives-XLI-B4-149-2016.
376
15. Tadono, T.; Takaku, J.; Tsutsui, K.; Oda, F.; Nagai, H. Status of ALOS World 3D (AW3D) global DSM
377
generation. In Proceedings of the IEEE International. Geoscience and Remote Sensing Symposium
378
(IGARSS), Milan, Italy 26-31 July 2015, doi: 10.1109/IGARSS.2015.7326657.
379
16. Tadono, T.; Nagai, H.; Ishida, H.; Oda, F.; Naito, S.; Minakawa, K.; Iwamoto, H. Generation of the 30
m-380
Mesh Global Digital Surface Model by ALOS Prism. Int. Arch. Photogramm. Remote Sens. Spatial Inf. Sci
381
2016, XLI-B41, 57–162, doi: 10.5194/isprs-archives-XLI-B4-157-2016.
382
17. Takaku, J.; Tadono, T.; Tsutsui, K. Generation of High Resolution Global DSM from ALOS PRISM. Int.
383
Arch. Photogramm. Remote Sens. Spatial Inf. Sci 2014, XL-4, 243–248, doi:
10.5194/isprsarchives-XL-4-243-384
2014.
385
18. Wessel, B.; Huber, M.; Wohlfart, C.; Marschalk, U.; Kosmann, D.; Roth, A. Accuracy assessment of the
386
global TanDEM-X Digital Elevation Model with GPS data. ISPRS J. Photogramm. Remote. Sens 2018, 139,