Drug Design, Development and Therapy
Dove
press
O r i g i n a l r e s e a r c h
open access to scientific and medical research
Open access Full Text article
hologram quantitative structure–activity
relationship and comparative molecular field
analysis studies within a series of tricyclic
phthalimide hiV-1 integrase inhibitors
Uiaran de Oliveira
Magalhães1
alessandra Mendonça Teles
de souza1
Magaly girão albuquerque2
Monique araújo de Brito3
Murilo lamim Bello1
lucio Mendes cabral4
carlos rangel rodrigues1
1Universidade Federal do rio de
Janeiro (UFrJ), Faculdade de Farmácia, laboratório de Modelagem Molecular and Qsar (ModMolQsar), rio de Janeiro, rJ, Brazil; 2Universidade
Federal do rio de Janeiro (UFrJ), instituto de Química, laboratório de Modelagem Molecular (labMMol), rio de Janeiro, rJ, Brazil; 3Universidade
Federal Fluminense (UFF), Faculdade de Farmácia, laboratório de Química Medicinal computacional (labQMc), niterói, rJ, Brazil; 4Universidade
Federal do rio de Janeiro (UFrJ), Faculdade de Farmácia, laboratório de Tecnologia Farmacêutica industrial (labTiF), rio de Janeiro, rJ, Brazil
correspondence: carlos rangel rodrigues
laboratory of Molecular Modeling and Qsar, Faculty of Pharmacy, Federal University of rio de Janeiro, rio de Janeiro, 21949-900, rJ, Brazil Tel +55 21 2260 9192 email rangelfarmacia@gmail.com
Abstract: Acquired immunodeficiency syndrome is a public health problem worldwide caused by the Human immunodeficiency virus (HIV). Treatment with antiretroviral drugs is the best option for viral suppression, reducing morbidity and mortality. However, viral resistance in HIV-1 therapy has been reported. HIV-1 integrase (IN) is an essential enzyme for effective viral replica-tion and an attractive target for the development of new inhibitors. In the study reported here, two- and three-dimensional quantitative structure–activity relationship (2D/3D-QSAR) stud-ies, applying hologram quantitative structure–activity relationship (HQSAR) and comparative molecular field analysis (CoMFA) methods, respectively, were performed on a series of tricyclic phthalimide HIV-1 IN inhibitors. The best HQSAR model (q2= 0.802, r2= 0.972) was obtained using atoms, bonds, and connectivity as the fragment distinction, a fragment size of 2–5 atoms, hologram length of 61 bins, and six components. The best CoMFA model (q2= 0.748, r2= 0.974) was obtained with alignment of all atoms of the tricyclic phthalimide moiety (alignment II). The HQSAR contribution map identified that the carbonyl-hydroxy-aromatic nitrogen motif made a positive contribution to the activity of the compounds. Furthermore, CoMFA contour maps suggested that bulky groups in meta and para positions in the phenyl ring would increase the biological activity of this class. The conclusions of this work may lead to a better understanding of HIV-1 IN inhibition and contribute to the design of new and more potent derivatives.
Keywords: 3D-QSAR, AIDS, CoMFA, HQSAR, 2D/3D-QSAR
Introduction
Acquired immunodeficiency syndrome (AIDS) is a public health problem worldwide caused by the Human immunodeficiency virus (HIV). It is estimated that 33.3 million people are infected with HIV-1 and about 2.1 million deaths are reported every year that are related to AIDS.1 HIV-1 infection is characterized by destruction of immune
cells, especially T lymphocytes, which are responsible for the immune response against antigens, pathogens, and cancer cells.2
The HIV-1 replication cycle depends on different macromolecules, including three viral enzymes, namely, reverse transcriptase, protease, and integrase (IN). Currently, reverse transcriptase and protease are targets for several antiretroviral US Food and Drug Administration-approved drugs, such as efavirenz and indinavir, respectively, while for IN there are just two, raltegravir and elvitegravir.3,4
Treatment with antiretroviral drugs is the best option for viral suppression, reduc-ing morbidity and mortality. However, as viral resistance in HIV therapy has been
Drug Design, Development and Therapy downloaded from https://www.dovepress.com/ by 118.70.13.36 on 22-Aug-2020
For personal use only.
Number of times this article has been viewed
This article was published in the following Dove Press journal: Drug Design, Development and Therapy
Dovepress Magalhães et al
reported,5–7 additional therapeutic approaches are needed.8
HIV-1 IN is one of three essential enzymes required for viral replication, and the absence of a host-cell equivalent target means that IN inhibitors may not interfere with cellular physi-ological process, suggesting that they are an attractive target for biological active compounds.8 Thus, resistance to HIV-1
IN inhibitors is the greatest problem and the discovery of new potential inhibitors is essential for AIDS treatment.5,7
In an attempt to design new chemical entities with effi-cient antiretroviral activity, we explored the two-dimensional (2D) and three-dimensional (3D) molecular features of a series of tricyclic phthalimide HIV-1 IN inhibitors developed by Verschueren et al,9 using two- and three-dimensional
quantitative structure–activity relationship (2D/3D-QSAR) approaches, namely, hologram quantitative structure– activity relationship (HQSAR)10 and comparative molecular
field analysis (CoMFA)11 methods, respectively, which are
powerful ligand-based strategies in drug design.12
Materials and methods
Dataset
The same dataset was used for the HQSAR and CoMFA studies containing the 42 tricyclic phthalimides developed by Verschueren et al9 showing HIV IN inhibitory activity
(Table 1). The biological activity of all compounds was used as originally expressed, as pIC50 (M) values (−Log of the half maximal inhibitory concentration, IC50) values. The 42 compounds were divided into training (30 compounds) and test (12 compounds) sets, ensuring that both sets contained structurally diverse compounds with high, medium and low activity, to avoid possible problems during the external validation.
Molecular modeling design
and conformational analysis
All tricyclic phthalimides (1–42) were built using SPARTAN’10 software (Wavefunction, Inc, Irvine, CA, USA) for Windows XP®. Conformational analysis was performed
with the conformer distribution Monte Carlo method, using Merck Molecular Force Field 94 (MMFF94). The lowest energy conformations were geometrically optimized by the Parameterized Model number 3 (PM3) semi-empirical method available in the program. In the absence of a compound from the phthalimide class co-crystallized with HIV-1 IN, the lowest energy conformations were used as the bioactive conforma-tion, a methodology successfully used by other authors.12–14
hQsar models
The structures of tricyclic phthalimides were converted into fragments initially using the default fragment size of 4–7 atoms per fragment. All fragments were allocated in defined molecular hologram lengths (53, 59, 61, 71, 83, 97, 151, 199, 257, 307, 353, 401 bins) and fragment distinction analysis was performed in terms of atoms, bonds, connectivity, hydrogen, and donor/acceptor atoms. Since these parameters may affect HQSAR models, different combinations of these parameters were considered during the HQSAR runs.15
After the partial least-squares (PLS) analysis, several QSAR models were generated for each distinguishing fragment (Table 2). Importantly, in the HQSAR method, the alignment step is not necessary for the generation of a model. All QSAR models were generated using PLS and the internal validation was performed by leave-one-out (LOO) cross-validation. An external validation was performed with the test set compounds, which was not considered in the HQSAR model development.
3D-Qsar molecular alignment
Conformer selection and molecular alignment are the most essential steps in 3D-QSAR studies. The accuracy and reliability of the CoMFA model is directly dependent on the molecular alignment rule.11 In this study, the alignments were carried out
using the SYBYL-X 1.1 software package (Tripos International, St Louis, MO, USA) and made based on the presence of a moiety common to all derivatives, by adopting the RMS (root mean square) atom-fit rule for superposition of individual atoms. Two different alignments were performed and three models were generated from each one. The most active compound from the series (33) was used as the template for both alignments (Figure 1). In alignment I, all atoms of the tricyclic phthalimide moiety were chosen, except for the hydroxyl groups and external carbon atoms of the pyrazine ring. In alignment II, all atoms of tricyclic phthalimide moiety were chosen (Figure 1).
coMFa 3D-Qsar models
For CoMFA calculations, steric and electrostatic interac-tions were calculated using three different probes: an sp3- hybridized carbon atom with +1.0 charge (Csp3+ 1), a
hydrogen atom with +1.0 charge (H + 1), and an sp3 oxygen
atom with -1.0 charge (Osp3- 1). Tripos standard and
indica-tor force fields with a distance-dependent dielectric constant at all intersections in a regularly spaced grid (1 and 2 Å) were evaluated (Tables 4 and 5). The default value of 30 kcal/mol was set as the maximum steric and electrostatic energy
Drug Design, Development and Therapy downloaded from https://www.dovepress.com/ by 118.70.13.36 on 22-Aug-2020
Dovepress hQsar and coMFa studies in tricyclic phthalimide hiV-1 integrase inhibitors
Table 1 chemical structures and biological data of 42 tricyclic phthalimide hiV-1 integrase inhibitors
N O
O R1
OH
OH
1
N O
O R1
N OH
OH
2
N O
O R1
N C H3
OH
OH
3
N O
O R1
N N
OH
OH
4
N O
O R1
N
N OH
OH
5-42
No R1 pIC50 (M) No R1 pIC50 (M) No R1 pIC50 (M)
1*
F
<4.00 15
O O
5.85 29*
F F
6.43
2
Br
6.42 16*
O
6.09 30
Cl F
6.75
3*
Br
6.59 17
O
6.25 31*
Cl
6.66
4
Br
5.44 18*
O
O
5.70 32
Cl
6.38
5
Br
6.68 19 O
O
6.37 33 Cl
Cl
6.95
6 CH3 4.31 20
O O
6.37 34*
Cl
Cl
6.73
7 4.98 21
O
O 6.11 35
Br
6.20
8 NH <4.00 22* 5.80 36 N 5.17
9 N
O
5.62 23
O F
F F 5.69 37 5.85
10 5.66 24
F F F
6.37 38 S 6.17
11 5.98 25*
F
6.25 39
F
6.30
12 5.69 26
F
6.38 40
F
6.00
13
O O
5.00 27*
Br F
6.36 41* 5.84
14*
O O
6.25 28
F
Br
6.45 42 5.69
Notes: *Test set compounds. pic50 represents the -log ic50, where ic50 is the half maximal inhibitory concentration.
Abbreviation: hiV, Human immunodeficiency virus.
Drug Design, Development and Therapy downloaded from https://www.dovepress.com/ by 118.70.13.36 on 22-Aug-2020
Dovepress Magalhães et al
showing HIV-1 IN inhibitory activity. The chemical structures and biological data of these inhibitors are listed in Table 1. The compounds’ distribution in the training (30) and test (12) sets, an important step in the development of QSAR models, was careful, aiming to maximize the test set diversity and to analyze the model prediction accuracy.
HQSAR studies require values to be selected for the para-meters that specify the hologram length, as well as the size and type of fragments to be encoded.16 The molecular
frag-ments were generated using the following fragment distinc-tion parameters: atoms, bonds, connecdistinc-tions, hydrogen atoms, chirality, and donor/acceptor atoms. The HQSAR models were first generated using the default fragment size (4–7 atoms) combined with various fragment types and various hologram lengths (Table 2). To identify how the fragment size could influ-ence the statistical parameters, we tested different fragment sizes (2–5, 3–6, 4–7, 5–8, 6–9, and 7–10 atoms) on the three best fragment distinction parameters of this model having the highest statistical indexes (models 1, 10, and 15) (Table 2).
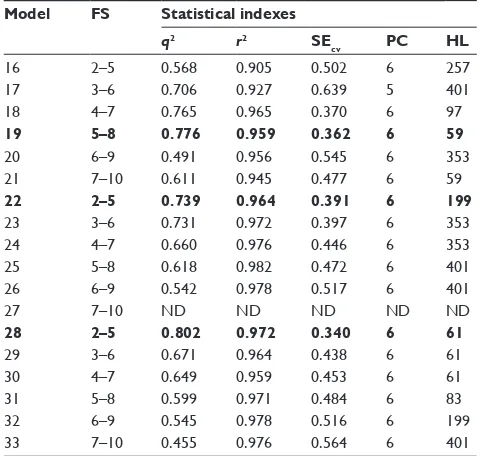
The best HQSAR model for these HIV-1 IN inhibitors was found to be model 28, with atoms, bonds, and connectivity as the fragment distinction parameters, and 2–5 atoms as the fragment size, showing good predictive capacity (q2= 0.802),
high data fitting (r2= 0.972), and low cross-validated standard
error (SEcv= 0.340) (Table 3).
hQsar contribution maps
According to the HQSAR method, it is possible to predict the activity value of a molecule by mapping its structural fragments. Thus, HQSAR contribution map analysis is an important step toward understanding the individual atomic
A
N
N
N
Cl
Cl
OH OH
O O
* * *
* * * *
* * * * *
* *
C
B
D
N
N
N
Cl
Cl
OH OH
O O
* * *
* * * * *
* * * *
* * * * *
*
Figure 1 selected atoms to alignment i (A) and three-dimensional (3D) view of superimposed aligned molecules (B). selected atoms to alignment ii (C) and 3D view of superimposed aligned molecules (D).
cutoff. A PLS approach was used to derive 3D-QSAR and the cross-validation with the LOO method11 to maximize the
probability that the results would have predictive validity.
Results and discussion
hQsar models
The dataset used for the HQSAR studies contained the 42 tricyclic phthalimides developed by Verschueren et al9 Table 2 summary of hologram quantitative structure–activity relationship (HQSAR) statistical indexes for the influence of various fragment distinctions (FD), using 4–7 as the fragment size parameter
Model FD Statistical indexes
q2 r2 SE
cv PC HL
1 A 0.765 0.965 0.370 6 97
2 B 0.362 0.668 0.574 3 97
3 c 0.517 0.918 0.520 5 97
4 h 0.258 0.465 0.608 2 97
5 Da 0.625 0.889 0.458 5 199
6 a/B 0.644 0.963 0.456 6 59
7 a/c 0.551 0.972 0.512 6 401
8 a/h 0.474 0.942 0.555 6 151
9 a/Da 0.482 0.926 0.550 6 83
10 B/C 0.660 0.976 0.446 6 353
11 B/h 0.362 0.668 0.574 3 97
12 B/Da 0.454 0.959 0.553 5 307
13 c/h 0.517 0.918 0.520 5 97
14 c/Da 0.250 0.474 0.600 1 401
15 A/B/C 0.649 0.959 0.453 6 61
Note: Models 1, 10 and 15 are indicated in bold to show that they are the three best models using 4-7 as the fragment size parameter.
Abbreviations: a, atoms; B, bonds; c, connectivity; Da, donor/acceptor atoms; h, hydrogen; hl, hologram length; Pc, principal components; q2, leave-one-out
cross-validated correlation coefficient; r2, non-cross-validated correlation coefficient;
secv, cross-validated standard error.
Drug Design, Development and Therapy downloaded from https://www.dovepress.com/ by 118.70.13.36 on 22-Aug-2020
Dovepress hQsar and coMFa studies in tricyclic phthalimide hiV-1 integrase inhibitors
contributions to the biological activities through a color code. This code ranges from red to green in a spectrum indicating favorable (yellow, green blue, and green), neutral (white), and unfavorable (red, red orange, and orange) contributions (Figure 2).
The fragment contribution map of the most active compound, 33, shows no fragments with negative contribution (Figure 2). As can be seen, the carbonyl-hydroxy- aromatic nitrogen motif was colored white and green, indicating
neutral and positive contributions to activity, respectively, since this moiety is common for all compounds and provides a structural scaffold for holding the pharmacophoric groups in suitable orientation for maximum complementarity with the catalytic site of HIV-1 IN.9 Furthermore, the carbonyl and
hydroxyl oxygens could chelate the Mg2+ ion in the active site,
an essential interaction for enzyme inhibition.9,17,18
In addition, the methylene spacer (colored green) that links the phthalimide nitrogen to the 3,4-dichlorophenyl group (mostly colored green and yellow) in compound 33 appears to be important for directing this bulky aromatic group in the active site of the enzyme, as suggested by dock-ing studies.7 This is consistent with benzodioxoles 13, 14,
and 15, since the compound with one methylene spacer (14) was more potent than that with none (13) or with two (15) methylene spacers.7
coMFa models
In the present work, all CoMFA models were derived using the same training and test sets as in the HQSAR analysis. To validate the reliability of these models, all important statistical parameters were analyzed, including LOO cross-validated correlation coefficient (q2), non-cross-validated
correlation coefficient (r2), standard error of the estimate
(SEE) and F-statistic values. To see how the alignment rule could influence the predictive capability of a model, two dif-ferent alignments, I and II, were proposed, and three difdif-ferent probe atoms and lattice spacing (1 and 2 Å) were performed to obtain the best model. The statistical results obtained from the CoMFA models are summarized in Table 4.
The PLS statistical analyses performed for alignment I showed that the best model generated was self-consistent (r2 = 0.973), with good predictive ability (q2 = 0.625), and
low SEE (0.130), with optimum number of components (six) determined by SAMPLS (sample–distance PLS) analysis
(33) (8)
Positive Neutral Negative
Figure 2 The hologram quantitative structure–activity relationship contribution maps of the most (33) and least (8) potent hiV-1 integrase inhibitors.
Abbreviation: hiV, Human immunodeficiency virus.
Table 3 summary of hologram quantitative structure–activity relationship statistical indexes for the influence of various fragment sizes (Fs), using atoms (Models 16–21); bonds and connectivity (Models 22–27); or atoms, bonds, and connectivity (Models 28–33) as the fragment distinction parameter
Model FS Statistical indexes
q2 r2 SE
cv PC HL
16 2–5 0.568 0.905 0.502 6 257
17 3–6 0.706 0.927 0.639 5 401
18 4–7 0.765 0.965 0.370 6 97
19 5–8 0.776 0.959 0.362 6 59
20 6–9 0.491 0.956 0.545 6 353
21 7–10 0.611 0.945 0.477 6 59
22 2–5 0.739 0.964 0.391 6 199
23 3–6 0.731 0.972 0.397 6 353
24 4–7 0.660 0.976 0.446 6 353
25 5–8 0.618 0.982 0.472 6 401
26 6–9 0.542 0.978 0.517 6 401
27 7–10 nD nD nD nD nD
28 2–5 0.802 0.972 0.340 6 61
29 3–6 0.671 0.964 0.438 6 61
30 4–7 0.649 0.959 0.453 6 61
31 5–8 0.599 0.971 0.484 6 83
32 6–9 0.545 0.978 0.516 6 199
33 7–10 0.455 0.976 0.564 6 401
Note: Models 19, 22 and 28 are shown in bold to indicate that they are the three best models in each fragment distinction parameter.
Abbreviations: hl, hologram length; nD, not determined; q2, leave-one-out
cross-validated correlation coefficient; r2, non-cross-validated correlation coefficient;
Pc, principal components; secv, cross-validated standard error.
Drug Design, Development and Therapy downloaded from https://www.dovepress.com/ by 118.70.13.36 on 22-Aug-2020
Dovepress Magalhães et al
A
B
Color legend 20.000
10.000
Color legend 20.000
10.000
Color legend 20.000
10.000
Color legend
20.000
10.000
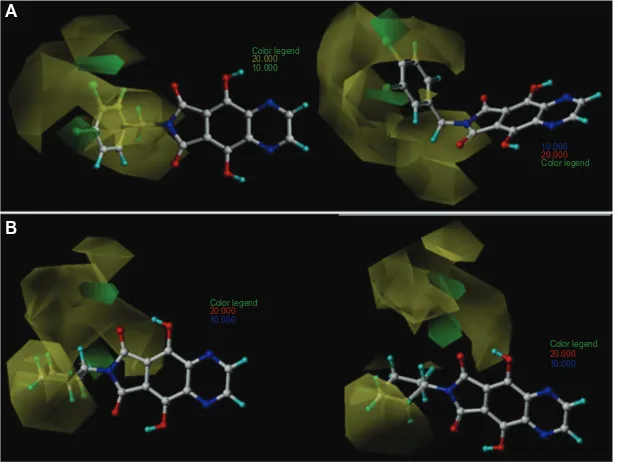
Figure 3 comparativemolecular field analysis contour maps for steric field with the most (33; A) and least (8; B) active compounds.
Note: left images show front view; right images show side view.
Table 4 Comparative molecular field analysis for alignments I and II using Tripos standard and indicator force fields with a lattice spacing of 2 Å
PLS statistics
Tripos standard Tripos indicator Probe atom (charge) Probe atom (charge) Csp3
(+1) H (+1)
Osp3 (-1)
Csp3 (+1)
H (+1)
Osp3 (-1) Alignment I
q2 0.588 0.471 0.573 0.625 0.336 0.597
F-value 253.085 333.547 296.312 125.159 56.323 104.418
r2 0.957 0.799 0.991 0.973 0.941 0.968
see 0.156 0.323 0.073 0.130 0.190 0.142
Pc 4 2 6 6 6 6
Alignment II
q2 0.557 0.490 0.484 0.748 0.317 0.597
F-value 445.728 361.309 287.329 130.192 55.905 104.418
r2 0.992 0.990 0.988 0.974 0.941 0.968
see 0.069 0.077 0.086 0.127 0.191 0.142
Pc 4 5 5 6 3 6
Abbreviations: Pc, principal components; Pls, partial least squares; q2,
leave-one-out cross-validated correlation coefficient; r2, non-cross-validated correlation
coefficient; SEE, standard error of the estimate.
Table 5 Comparative molecular field analysis for alignment II using lattice spacing of 1 Å and csp3 (+1) as the probe atom
PLS statistics Standard Indicator
q2 0.477 0.583
F-value 675.001 399.966
r2 0.995 0.991
see 0.056 0.073
Pc 3 6
Abbreviations: Pc, principal components; Pls, partial least squares; q2,
leave-one-out cross-validated correlation coefficient; r2, non-cross-validated correlation
coefficient; SEE, standard error of the estimate.
implemented in SYBYL-X 1.1. As can be seen in Table 4, this model was obtained using a carbon sp3 (+1) probe atom in
an indicator force field,19 with a lattice spacing of 2 Å. In
alignment II, the PLS statistical parameters were better than those generated for alignment I (q2= 0.748, r2= 0.974, and
SEE = 0.127) (Table 4). Despite the fact that the statistical results for alignments I and II both provided consistent data, alignment II was selected as the best model.
With the objective of evaluating the influence of steric and electrostatic interaction energies for model generation, the value of the grid spacing was decreased to 1 Å using both force fields (standard and indicator) and the carbon sp3 (+1) probe atom
(Table 5). After reducing the cell size to 1 Å, no improvement was observed in q2 values (predictive model), although some
statistical parameters, such as r2, F-value, and SEE, presented
with better values when compared with the best model gener-ated with the 2 Å cell size. Normally, 3D-QSAR studies with a q2 value .0.5 are considered statistically significant, but q2 alone is not sufficient to assess the predictive power of a
QSAR model.20 Thus, external validation is the only way to
establish a reliable QSAR model. In this study, the best model was validated using the test set of 12 compounds, which was used to predict the activities of the test set.
coMFa contour maps
CoMFA steric and electrostatic contour maps are useful in the context of ligand–receptor interactions. Furthermore, these contour maps can help identify areas where changes in
Drug Design, Development and Therapy downloaded from https://www.dovepress.com/ by 118.70.13.36 on 22-Aug-2020
Dovepress hQsar and coMFa studies in tricyclic phthalimide hiV-1 integrase inhibitors
steric or electrostatic fields can affect biological activity and indicate important regions for ligand interaction with the receptor site. Moreover, the absence of a field does not necessarily mean that a particular pharmacophore is not important for activity; but, according to the generated model, all derivatives exert the same influence at that point.
The analysis of the steric and electrostatic contour maps was made only with the model generated by alignment II (q2= 0.748). The steric and electrostatic contributions of the
final model were 97% and 3%, respectively. This means that the model was more influenced by the steric field around tri-cyclic phthalimides than the electrostatic field. The CoMFA contour maps of the most (33) and least (8) active compounds are shown in Figure 3.
The green contour characterizes the regions where bulky substituents would increase the HIV-1 IN inhibitory activity, whereas the yellow contour indicates the regions where steric bulk would decrease the activity. The contributions of the green and yellow contours were maintained at the default values of 80% and 20%, respectively.
Figure 3A shows two favorable green regions for compound 33 located close to the meta and para positions of the benzyl group (R1 substituent), mainly near the two (orto and para) chlorine atoms. This indicates that bulky groups at those positions are favorable and this accounts for the high biological activity of 33. The several unfavorable yellow regions spread around the benzyl group indicate that bulky groups at those positions would significantly reduce the binding affinity. In the contour map of the most active compound, 33 (Figure 3A), it can be observed that the benzyl group is planar and does not touch the yellow regions, while in the map of the least active compound, 8 (Figure 3B), the piperidine ring (R1 substituent) is localized in the yellow prohibitive regions.
external validation of the best hQsar
and coMFa models
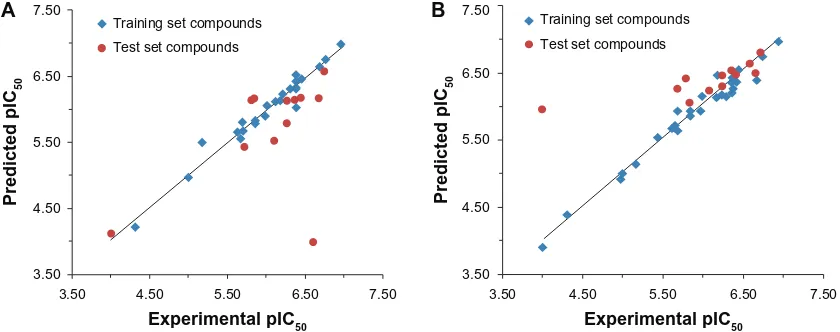
The experimental pIC50, predicted pIC50, and residual values of the tricyclic phthalimide HIV-1 IN inhibitors obtained for the best HQSAR and CoMFA models are reported in Table 6. The comparison plots between the experimental and predicted potencies of both the training and test sets using the best HQSAR and CoMFA models are shown in Figure 4.
In this work, we considered as outliers all compounds of the training and test sets whose differences between experimental and predicted activities exceeded 2.0 standard deviations (SD) from the mean of the residuals (HQSAR 2*SD = 0.68 and CoMFA 2*SD = 0.90).21 According
Table 6 experimental and predicted pic50 values of training and
test set compounds
No Experimental HQSAR CoMFA
Predicted Residual Predicted Residual
1* 4.00 5.95 -1.95 4.12 -0.12
2 6.42 6.35 0.07 nD nD
3* 6.59 6.63 -0.04 4.00 2.59
4 5.44 5.54 -0.10 nD nD
5 6.68 6.39 0.29 6.65 0.03
6 4.31 4.40 -0.09 4.22 0.09
7 4.98 4.92 0.06 4.97 0.01
8 4.00 3.92 0.08 4.09 -0.09
9 5.62 5.67 -0.05 5.67 -0.04
10 5.66 5.71 -0.05 5.56 0.10
11 5.98 5.93 0.05 5.90 0.08
12 5.69 5.93 -0.24 5.69 0.00
13 5.00 5.01 -0.01 4.97 0.03
14* 6.25 6.45 -0.20 5.80 0.45
15 5.85 5.93 -0.08 5.83 0.02
16* 6.09 6.23 -0.14 5.53 0.56
17 6.25 6.17 0.08 6.12 0.13
18* 5.70 6.26 -0.56 5.44 0.27
19 6.37 6.35 0.02 6.44 -0.07
20 6.37 6.20 0.17 6.31 0.06
21 6.11 6.24 -0.13 6.13 -0.02
22* 5.80 6.41 -0.61 6.14 -0.34
23 5.69 5.68 0.01 5.81 -0.12
24 6.37 6.35 0.02 6.34 0.03
25* 6.25 6.29 -0.04 6.14 0.11
26 6.38 6.26 0.12 6.04 0.34
27* 6.36 6.53 -0.17 6.15 0.21
28 6.45 6.53 -0.08 6.47 -0.02
29* 6.43 6.47 -0.04 6.18 0.25
30 6.75 6.73 0.02 6.77 -0.01
31* 6.66 6.48 0.18 6.18 0.48
32 6.38 6.43 -0.05 6.53 -0.15
33 6.95 6.95 0.00 7.00 -0.04
34* 6.73 6.79 -0.06 6.57 0.16
35 6.20 6.45 -0.25 6.23 -0.03
36 5.17 5.14 0.03 5.50 -0.33
37 5.85 5.85 0.00 5.79 0.06
38 6.17 6.13 0.04 6.14 0.03
39 6.30 6.14 0.16 6.30 0.00
40 6.00 6.15 -0.15 6.06 -0.06
41* 5.84 6.05 -0.21 6.17 -0.33
42 5.69 5.64 0.05 5.67 0.02
Notes: *Test set compounds; “nD” indicates that a value was not determined because the molecules did not show any atoms common to the core used for alignment, resulting in the withdrawal of the same training set.
Abbreviations: CoMFA, comparative molecular field analysis; HQSAR, hologram quantitative structure–activity relationship; pic50, -log ic50; ic50, half maximal
inhibitory concentration.
to this criterion, there was one outlier for each model: compound 1 for HQSAR and compound 3 for CoMFA.
The HQSAR outlier, 1, presented the highest residual value (-1.95), but it must be remembered that this compound belonged to the test set and did not take part in the model building process. Derivative 1 is analogous to 26, one of the
Drug Design, Development and Therapy downloaded from https://www.dovepress.com/ by 118.70.13.36 on 22-Aug-2020
Dovepress Magalhães et al
most potent tricyclic phthalimide inhibitors, and both have the same 4-fluorobenzyl group as the R1 substituent, dif-fering only in the first ring (Table 1). The HQSAR models overestimated the biological potency of 1 probably because it has a similar fingerprint to compound 26.
The CoMFA outlier, 3, which also belongs to the test set, presented the highest residual value (2.59). In this case, the CoMFA model underestimated the biological activity of 3 because this derivative has structural difference in the first ring.
Conclusion
The methylene spacer that links the phthalimide nitrogen to the 3,4-dichlorophenyl group in compound 33 appears to be important for directing this bulky aromatic group in the active site of the enzyme, as suggested by docking studies.7
Predictable and statistically significant CoMFA and HQSAR models of tricyclic phthalimide HIV-1 IN inhibitors were obtained. The CoMFA model emphasized the importance of the steric descriptor field, as it explained nearly 97% of the variance in HIV-1 IN inhibitory activity. The inhibi-tory activities of the external test set of compounds were well predicted and explain the statistical robustness of the CoMFA and HQSAR models created. This could be useful in the development of newer molecules that are structurally related to these HIV-1 IN inhibitors. The CoMFA contour map analysis showed two favorable green regions located close to the meta and para positions of the benzyl group (R1 substituent), mainly near the two (orto and para) chlorine atoms for compound 33. This indicates that bulky groups at those positions are favorable for activity, which accounts for the increased activity of the inhibitors in this series.
Training set compounds Test set compounds
Experimental pIC50
7.50
6.50
5.50
4.50
Predicted pIC
50
A
3.50
3.50 4.50 5.50 6.50 7.50
Training set compounds Test set compounds
Experimental pIC50
7.50
6.50
5.50
4.50
Predicted pI
C50 B
3.50
3.50 4.50 5.50 6.50 7.50
Figure 4 Plotof experimental versus predicted pic50 values of the training and test sets of the tricyclic phthalimide HIV-1 integrase inhibitors by comparative molecular field
analysis (A) and hologram quantitative structure–activity relationship (B).
Abbreviations: pic50,-log ic50; ic50, half maximal inhibitory concentration; hiV, Human immunodeficiency virus.
A successful HQSAR model should provide important information about which molecular fragments are directly related to the biological activity, apart from predicting the activities of the untested molecules. Together, these data would be useful for designing new compounds with potent HIV-1 IN inhibitory activity.
Acknowledgments
Financial support from Fundação de Amparo à Pesquisa do Estado do Rio de Janeiro (FAPERJ), Conselho Nacional de Desenvolvimento Científico e Tecnológico (CNPq), and Coordenação de Aperfeiçoamento de Pessoal de Nível Supe-rior (CAPES) was received for this study.
Disclosure
Other than the funding received for this study outlined in the Acknowledgments section, the authors declare no conflicts of interest in this work.
References
1. Joint United Nations Programme on HIV and AIDS (UNAIDS).
UNAIDS Report on the Global AIDS Epidemic: 2010. Washington: UNAIDS; 2010. Available from: http://www.unaids.org/globalreport/ global_report.htm. Accessed July 2, 2013.
2. Koppensteiner H, Brack-Werner R, Schindler M. Macrophages and their relevance in Human Immunodeficiency Virus Type I infection.
Retrovirology. 2012;9:82.
3. Nguyen BY, Isaacs RD, Teppler H, et al. Raltegravir: the first HIV-1 inte-grase strand transfer inhibitor in the HIV armamentarium. Ann N Y Acad Sci. 2011;1222:83–89.
4. Mullard A. 2012 FDA drug approvals. Nat Rev Drug Discov.
2013;12(2):87–90.
5. Mesplède T, Quashie PK, Wainberg MA. Resistance to HIV integrase inhibitors. Curr Opin HIV AIDS. 2012;7(5):401–408.
6. Mouscadet JF, Delelis O, Marcelin AG, Tchertanov L. Resistance to HIV-1 integrase inhibitors: A structural perspective. Drug Resist Updat. 2010;13(4–5):139–150.
Drug Design, Development and Therapy downloaded from https://www.dovepress.com/ by 118.70.13.36 on 22-Aug-2020
Drug Design, Development and Therapy
Publish your work in this journal
Submit your manuscript here: http://www.dovepress.com/drug-design-development-and-therapy-journal
Drug Design, Development and Therapy is an international, peer-reviewed open-access journal that spans the spectrum of drug design and development through to clinical applications. Clinical outcomes, patient safety, and programs for the development and effective, safe, and sustained use of medicines are a feature of the journal, which
has also been accepted for indexing on PubMed Central. The manu-script management system is completely online and includes a very quick and fair peer-review system, which is all easy to use. Visit http://www.dovepress.com/testimonials.php to read real quotes from published authors.
Dovepress
Dove
press
hQsar and coMFa studies in tricyclic phthalimide hiV-1 integrase inhibitors
7. Quashie PK, Mesplède T, Wainberg MA. Evolution of HIV integrase resistance mutations. Curr Opin Infect Dis. 2013;26(1):43–49. 8. Pommier Y, Johnson AA, Marchand C. Integrase inhibitors to treat HIV/
AIDS. Nat Rev Drug Discov. 2005;4(3):236–248.
9. Verschueren WG, Dierynck I, Amssoms KI, et al. Design and optimi-zation of tricyclic phtalimide analogues as novel inhibitors of HIV-1 integrase. J Med Chem. 2005;48(6):1930–1940.
10. Heritage TW, Lowis DR. Molecular hologram QSAR. ACS Symposium Series. 1999;719:212–225.
11. Cramer RD, Patterson DE, Bunce JD. Comparative molecular field analysis (CoMFA). 1. Effect of shape on binding of steroids to carrier proteins. J Am Chem Soc. 1988;110(18):5959–5967.
12. Rodrigues CR, Flaherty TM, Springer C, McKerrow JH, Cohen FE. CoMFA and HQSAR of acylhydrazide cruzain inhibitors. Bioorg Med Chem Lett. 2002;12(11):1537–1541.
13. Burt SK, Hutchins CW, Greer J. Predicting receptor-ligand interactions.
Curr Opin Struct Biol. 1991;1(2):213–218.
14. de Brito MA, Rodrigues CR, Cirino JJ, et al. Residue-ligand interac-tion energy (ReLIE) on a receptor-dependent 3D-QSAR analysis of S- and NH-DABOs as non-nucleoside reverse transcriptase inhibitors.
Molecules. 2012;17(7):7666–7694.
15. Yu L, Cao R, Yi W, et al. Synthesis of 4-[(diethylamino)methyl]-phenol derivatives as novel cholinesterase inhibitors with selectivity towards butyrylcholinesterase. Bioorg Med Chem Lett.
2010;20(11):3254–3258.
16. de Souza SD, de Souza AM, de Sousa AC, et al. Hologram QSAR models of 4-[(diethylamino)methyl]-phenol inhibitors of acetyl/butyryl-cholinesterase enzymes as potential anti-Alzheimer agents. Molecules.
2012;17(8):9529–9539.
17. Kawasuji T, Fuji M, Yoshinaga T, Sato A, Fujiwara T, Kiyama R. A platform for designing HIV integrase inhibitors. Part 2: a two-metal binding model as a potential mechanism of HIV integrase inhibitors.
Bioorg Med Chem. 2006;14(24):8420–8429.
18. Agrawal A, DeSoto J, Fullagar JL, et al. Probing chelation motifs in HIV integrase inhibitors. Proc Natl Acad Sci U S A. 2012;109(7): 2251–2256.
19. Clark M, Cramer RD. The probability of chance correlation using par-tial least-squares (PLS). Quantitative Structure-Activity Relationships.
1993;12(2):137–145.
20. Golbraikh A, Tropsha A. Beware of q2! J Mol Graph Model. 2002;20(4):269–276.
21. Pasqualoto KF, Ferreira MM. Molecular modeling and dependent (RD) 3D-QSAR approach to a set of antituberculosis derivatives. QSAR Comb Sci. 2009;28(11–12):1455–1464.
Drug Design, Development and Therapy downloaded from https://www.dovepress.com/ by 118.70.13.36 on 22-Aug-2020