Studies for high energy air shower identification using RF measurements
with the ASTRONEU array
StavrosNonis1,∗,GeorgeBourlis2,IoannisGkialas1,AntoniosLeisos2,IoannisManthos3,KostasPapageorgiou1, Apos-tolosTsirigotis2, andSpyrosTzamarias3
1Department of Financial and Management Engineering, University of the Aegean, Chios, Greece 2Physics Laboratory, School of Science and Technology, Hellenic Open University, Patras, Greece 3Department of Physics, Aristotle University of Thessaloniki, Thessaloniki, Greece
Abstract. The Hellenic Open University (HOU) Cosmic Ray Telescope (ASTRONEU) consists of 9 large scintillator detectors and 3 RF antennas arranged in three autonomous stations operating at the Hellenic Open University campus in the city of Patras. High energy showers that are detected simultaneously by two distant stations and in coincidence with the RF antennas are used to study the RF signature of cosmic events. In previous studies we have shown that the timing of the RF signals as well as the measured electric field at the antennas position are in very good agreement with the simulation predictions. In this work we concentrate on the transfer functions of the antennas which are strongly frequency and angular dependent. We show that the RF spectra (at frequencies 30-80 MHz) of the detected showers are exhibiting features of the antenna response as predicted by detailed Monte Carlo simulation suggesting that a single antenna RF spectrum gives access to the cosmic ray arrival direction.
1 Introduction
High energy cosmic particles hitting the atmospheric molecules produce cascades of secondary particles also known as atmospheric air showers. The (constituents) sec-ondary particles of the air shower are traditionally detected by large arrays of particle detectors (mostly used scintilla-tion detectors and water-Cherenkov detectors). Addiscintilla-tion- Addition-ally, the electrons and positrons of very high energy show-ers are radiating a measurable electric field in the radio frequency (RF) regime. Since a number of experiments have studied the RF signal [1–5] the dominant emission mechanisms are now well understood. The two proposed mechanisms that explain the RF emission are the trans-verse current variation (opposite deflection of e- and e+ in the earth’s magnetic field) [6], and charge excess vari-ation (due to excess of electrons in the shower front) [7]. Among shower’s detection methods the radio technique is relatively low cost and is working during daytime and bad weather.
The ASTRONEU cosmic ray telescope is a hybrid Extensive Air Shower (EAS) detection array installed at the Hellenic Open University campus on the outskirts of the city of Patras, Greece. The telescope’s layout is di-vided into 3 autonomous stations each comprising 3 large (≈ 1m2 ) scintillator detectors and 1 RF antenna. The array operates in urban environment with strong human made noise collecting data since the beginning of 2014. In previous studies [8] we have shown that it is possible to detect RF signals from showers in noisy environments by
∗e-mail: [email protected]
imposing the appropriate selection criteria to the RF sig-nals. We have also studied the timing and the amplitude strength of the RF signals by comparing the antenna data with the particle detector data as well as with the simu-lation predictions [9]. In this work we present a detailed Voltage Response Model (VRM) for the RF system using the antenna’s Vector Effective Length (VEL) [10] and the electric field at the antenna’s position in order to estimate the primary particle arrival direction.
In Section 2 we describe briefly the architecture of the Astroneu array while, in Section 3, the event selection cri-teria are discussed. In Section 4 we focus on the antenna’s response model. We compare the measured RF spectra of the antennas with the VRM predictions, estimate the pri-mary particle arrival direction and compare with the re-spective direction estimated from the particle detectors. Finally, in Section 5 the conclusions are drawn.
2 The ASTRONEU Array
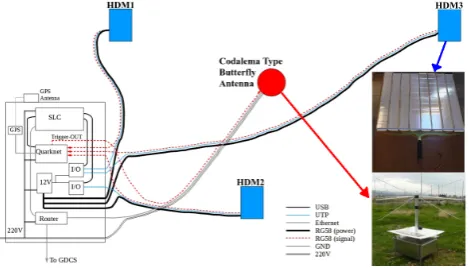
The layout of the stations of the Astoneu array is depicted in figure 1. Each station consists of three HELYCON1 Detector Modules (HDM) [12] along with one2 RF An-tenna (RFA) [10] and is equipped with trigger, digitiza-tion and Data Acquisidigitiza-tion (DAQ) electronics. It is also equipped with slow control and monitor electronics and a GPS-based timing system.
1HELYCON is the acronym of Hellenic Lyceum Cosmic
Observato-ries Network a project aiming for the development of a network of exten-sive air shower detector stations, distributed in western Greece [11].
Figure 1. The outline of the ASTRONEU array installed at the HOU campus. Each of the three stations comprises three Hely-con Detector Modules and a CODALEMA type RF antenna. Pic-ture taken from [13].
The HDM is made of 160 scintillating tiles covering an area of about 1 m2. The light generated by the in-teraction of shower particles with the scintillation mate-rial, is collected by wavelength shifting fibers embedded in the scintillator material and is driven to a photomulti-plier tube (PMT). The RF antenna is a "Butterfly" bowtie antenna [10] developed by the CODALEMA collaboration [1] with dimension 2x2x1m3 constructed with two elec-trically short dipoles aligned in the East-West (EW) and North-South (NS) directions. The dipole signals are fed directly into the input of a Low Noise Amplifier (LNA) [14] at the center of the antenna and they are sampled at a rate of 1GHz.
Figure 2. Schematic representation of the connections in the Astroneu station. Picture taken from [13].
A schematic representation of the Astroneu station ar-chitecture is shown in figure 2. The signals of the three HDM PMTs of a station are readout by a Quarknet elec-tronics board [15] which measures with 1.25 ns accuracy the time of the crossings of the PMT waveforms with a predefined voltage threshold. The time of the first cross-ing defines the timcross-ing of the pulse, while the time that the pulse remains above the threshold (Time over Threshold -ToT) is used to estimate the pulse size. The necessary I/O and network devices as well as the Station Local Com-puter (SLC) that communicates with the RFA-DAQ and hosts the Quarknet-DAQ and the monitor/control software
of the station are located inside a metallic Central Elec-tronics Box (CEB). A station trigger is generated when all three HDMs of the station acquire signals above 9.7mVin a time window of 240 ns. This trigger signal is driven into the RFA external trigger input which activates the recording of 2560 samples of each waveform in the two poles of the antenna. The experimental information from both the HDMs and the RFA of a station are transferred to the Global Data and Control Server (GDCS), where the event building is performed offline utilising the time-tags of the data provided by GPS devices embedded in the cor-responding DAQs.
The detector network has been operated, collecting data since August 2014. Standard installation, calibra-tion and operacalibra-tion procedures have been established [12] and software packages to simulate in detail the response of the detectors to showers as well as to reconstruct the EAS characteristics have been developed [13]. Each au-tonomous station of the Astroneu array is capable of re-constructing extensive air showers of energy more than 10 TeV with a typical resolution of 3.5 degrees at a rate of 17h−1. The performance of the Astroneu array in de-tecting and reconstructing EAS using the charged parti-cle detectors of a station (single station operation) or by combining the experimental information from two stations (multiple station operation) is reported in [13]. The RF component of the EAS has been studied using noise fil-ters, timing and signal polarization [8]. Further studies including the correlation of the RF signals with the parti-cle detector data as well as the comparison of the electric field measurements with the MC prediction have also been reported [9].
3 Data Selection
The data sample used in this analysis was collected by sta-tions A and B (see figure 1) in coincidence, from 2014 August 1st to 2016 March 16th. Detailed MC studies [13] show that these double station events correspond to EAS energiesE>5·103TeV. Each station was triggered when all three HDM signals were above 9.7mV(corresponding roughly to 2 minimum ionizing particles), while coinci-dence events between stations were identified offline using the event GPS time and the distance between the stations (164 m). The final sample after passing all the quality cri-teria consisted of 1395 events corresponding to an event rate of about 0.15h−1. For each event, the ToT value and the timing of the six HDM pulses as well as the full wave-form of each pole of the two RF antennas were kept for further analysis.
Figure 3.The upper plots show the raw EW waveform of a cos-mic event. The lower plots show the corresponding filtered signal in the 20-80 MHz band. In both cases the full waveform (left) and the central region (right) are presented.
Fast Fourier Transform (FFT) is applied. After this trans-formation, the non-desirable frequencies are removed and subsequently the inverse Fourier Transform (FFT-1) is ap-plied, providing the filtered signal (figure 3).
The filtered RF waveforms of the data sample were re-tained for further analysis when a peak value of at least 10 times above the noise was observed in a time window of 100 ns around the trigger signal (signal time window). The noise was estimated as the rms3 of the voltage in a large time window exluding the signal time window. Addition-ally, in order to select very high energy showers another criterion based on the particle detectors information was applied. As it is reported in [9] the sum of the ToT val-ues of the 6 HDMs of stations A and B over the projected HDM area perpendicular to the shower axis is a measure-ment of the ground particle density and can be used to se-lect showers of higher energy. In this analysis a threshold value of 500 ns was used and the final sample consisted of 34 events from Station-A and 48 events from Station-B. In this data sample the EW component of the RF signal was used to define the timing of the RF signal evaluated as the time instance of the peak value of the filtered waveform. The timing of the RF signal is found to be consistent [9] with the plane particle front approximation, the timing of the HDM pulses and the geometry of the station4. Fur-thermore, the strength of the RF signals were used to es-timate the electric field intensity at the antennas position
3Root of the Mean of the Square
4Using the direction of the shower axis as estimated by the particle
detectors and the position of the antenna the expected delay of the RF signal w.r.t. an HDM signal can be evaluated with triangulation.
and found to be in very good agreement with the MC pre-diction [9].
4 Cosmic Ray Arrival Reconstruction from
Single RF Antenna Spectrum
4.1 Vector Effective Length Evaluation
The gainGof an antenna is a parameter which takes into account the receiving efficiency (as well as the radiation efficiency) of the antenna and its directional dependen-cies. It also characterizes the frequency dependence of the structure. In the majority of modern cosmic rays RF de-tection experiments, the antennas are connected to a Low Noise Amplifier (LNA). Thus a more detailed description of the directional and frequency dependencies of the set-up (antenna+LNA) is achieved using the Vector effective Length (VEL) (or alternative known as system transfer functions) [1]. The VEL is considered to be the ratio of the voltage that appears at the LNA output (V) to the mag-nitude of the electric-field strength (E) in the direction of the antenna polarization (V EL=V/E).
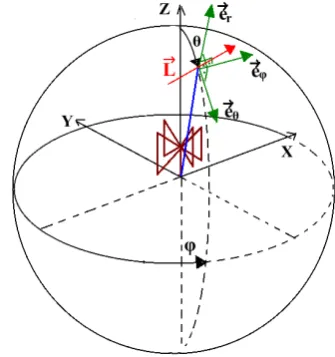
Figure 4. The spherical coordinate system with the antenna in the center. The zenith angleθis counted from the top, the az-imuth angleφfrom the x-axis (along NS direction) of the coor-dinate system. The RF signal arrives from a specific direction (θ, φ). The VEL~Lfor the specified direction is shown.
Let’s consider a spherical coordinate system with the antenna in its center as shown in figure 4. In this coordi-nate system, the electric field of a plane wave arrives from a given direction (θ, φ). The antenna’s VEL, for each pole separately, can be expressed with a two-component vector along the directions of the unit vectorse~θande~φ,
~
Lew/ns(θ, φ,t)=Lew/ns(θ,t)·e~θ+Lew/ns(φ,t)·e~φ (1)
The antenna characteristics contained in VEL are usually obtained in the frequency domain rather than the time do-main as provided by the Fourier transformsF of the quan-tities
~
The VEL’s amplitude can be described in terms of the gain G(θ, φ) and structural features of the system such as the antenna radiation resistance and reactance (Rrad,Xant) and
the LNA input resistance and reactance (RLNA,XLNA)
ac-cording to [16, 17]
Lew/ns(θ, φ,f)=
c f
s
Gew/ns(θ, φ)
πZ0
· √
Rrad|RLNA+iXLNA|
|RLNA+iXLNA+Rrad+iXant| (3) withZ0the intrinsic impedance and f the frequency of the received electric field.
Figure 5.Butterfly Antenna VEL 30-80 MHz for EW/NS poles and for directionθ=60o,φ=120o.
The evaluation of the VEL of each pole is performed utilizing the NEC software [18]. An example is shown in figure 5 where the two components of the effective length of each pole are evaluated as a function of the frequency (0-100 MHz) for a signal arriving directionθ = 60o and
φ=120o.
4.2 Voltage Response Model
The voltage magnitude (response) of the system to an inci-dent electric field that arrives from a given direction (θ, φ) (in a single polarization) is obtained by the convolution of the field and the VEL of the antenna [19]. For the two an-tenna’s poles the response can be written in time domain [20] as follows
Vew/ns(θ, φ,t)=~Lew/ns(θ, φ,t)∗E~ew/ns(θ, φ,t) (4)
In the frequency domain the antenna respone can be ex-pressed with multiplication of their Fourier transforms (ac-cording to convolution theorem [17])
Vew/ns(θ, φ,f)=~Lew/ns(θ, φ,f)·E~ew/ns(θ, φ,f) (5)
For the calculation of the electric field the SELFAS [21] simulation package is used. SELFAS calculates the RF signal, in the MHz range, emitted by cosmic ray air showers during their formation in the atmosphere. The simulation includes RF emission by charge excess varia-tion (due to excess of electrons in the shower front) and by transverse current variation (due to the opposite direction deflections ofe−ande+in the earth magnetic field). Based on “shower universality”, it generates onlye+ande−in the shower front according to the Greisen particle generator [22]. For eache+/e−generated, it computes and adds all the individual field contributions at any given point (even at heights near the shower maximum). Combining NEC’s simulations for the VEL in the frequency domain 30-80 MHz with the electric field generated by SELFAS for vari-ous primary directions5we calculated the voltage response model for the RF system Vew/ns(θ, φ,f). An example is
shown in figure 6.
Figure 6. Butterfly Antenna voltage response model for EW pole for a shower generated by SELFAS. The proton’s energy is 1018eV and the distance between the shower core and the
antenna is 10m. The arrival directions areθ = 20o, φ = 40o (blue), θ = 40o, φ = 40o (green), θ = 60o, φ = 40o (red),
θ=80o, φ=40o(light blue).
4.3 Estimation of the Primary Arrival Direction
The estimation of the primary arrival direction is per-formed by comparing the RF spectrumVespectrumw/ns (f) of the recorded signals with the Vew/ns(θ, φ,f) response model
described in the previous subsection. TheVew/ns(θ, φ,f)
response is evaluated for a large number of (θ, φ) pairs (i.e. for 0 ≤ θ ≤ 90, 0 ≤ φ ≤ 360 with a step of one degree) and many different frequency values in the region
5Only the angular direction is used while the shower core, the
0−100MHz. Then the shower direction is estimated by the minimization of the followingχ2value:
χ2= X
f=30−80MHz
α·Vew/ns(θ, φ,f)−V spectrum ew/ns (f)
2 (6)
In equation 6 the summation is performed over the fre-quency values (a step of 1 MHz was used) and for both poles of the antenna while the parameterαis a factor to scale theVew/ns(θ, φ,f) for any energy, primary type and
core distance.
The procedure for the evaluation of the RF spectrum Vespectrumw/ns (f) of the recorded signals is the following. First both the EW and NS signals are filtered keeping frequen-cies in the range 30-80 MHz. Then the filtered signals are subjected to Hilbert transformationH (or envelop) being the convolution of the signalV(t) with the functionπ1t,
H(V(t))=1
π
Z +∞
−∞ V(τ)
t−τdτ (7)
The Hilbert envelop is used to make the spectrum smoother removing possible remaining sources of noise (with frequencies near the cosmic event 45-55 MHz) and negative frequency components. Finally, theVespectrumw/ns (f) is computed by the Fourier transformation ofH(V(t)) for each antenna pole.
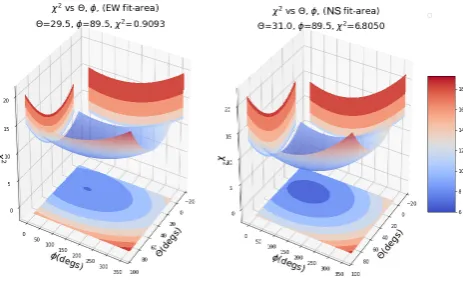
Figure 7. χ2 as a function ofθ, φfor EW and NS polarization
for a cosmic event. The direction of this event using the particle detetor data is estimated to beθ=30oandφ=930.
An example of the minimization procedure is shown in figures 7 and 8. The χ2 as a function ofθ, φ is eval-uated by the corresponding valuesVew/ns(θ, φ,f) and the
Vespectrumw/ns (f) (figure 7). The response modelVew/ns(ˆθ,φ,ˆ f)
where ˆθand ˆφdenote the estimated values from the min-imization is shown in figure 8 in comparison with the re-sponse RF spectrumVespectrumw/ns (f).
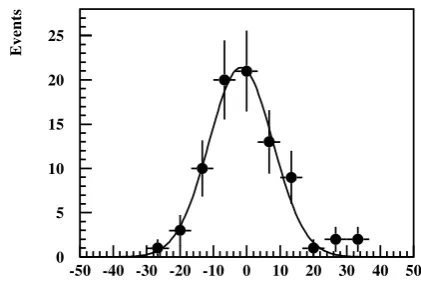
The estimated zenith and azimuth angles of the shower axis using the VRM can be compared with the correspond-ing values estimated from the particle detectors. The dis-tribution of the difference on the zenith angle and on the azimuth angle are shown in figures 9 and 10 respectively. Both distributions are well described by Gaussian func-tions centered near zero. The corresponding sigmas of the Gaussian function areσ∆θ=6.0oandσ
∆φ=9.6o.
Figure 8. The comparison between the response model
Vew/ns(ˆθ,φ,ˆ f) and theV spectrum
ew/ns (f) for a cosmic event. ˆθand ˆφ denote the estimated values from the minimization procedure shown in figure 7 (ˆθ=29.5o,φˆ =89.5o). The green (magenta) crosses is the EW (NS) spectrum and the red (light blue) line the EW (NS) VRM.
0 5 10 15 20 25 30 35
-40 -30 -20 -10 0 10 20 30 40
Events
Figure 9. The distribution of∆θbetween the zenith angle es-timated using the VRM and the corresponding angle eses-timated using the particle detector data. The distribution is fitted with Gaussian function of sigma equal to 6 degrees.
5 Conclusions
0 5 10 15 20 25
-50 -40 -30 -20 -10 0 10 20 30 40 50
Events
Figure 10. The distribution of∆φbetween the azimuth angle estimated using the VRM and the corresponding angle estimated using the particle detector data. The distribution is fitted with Gaussian function of sigma equal to 9.6 degrees.
sample of very high energy showers were selected for a running period of about one year and a half. This sam-ple was analyzed in order to obtain the voltage response spectrum for frequencies between 30 and 80 MHz. The spectrum was compared on an event by event basis with a voltage response model evaluated using the vector ef-fective length of the antennas and MC simulation. It was found that the estimated values of the zenith and azimuth angle direction are in very good agreement with the es-timations using the timing of the particle detectors. The analysis is still on going in order to define more efficient selection criteria and signal processing techniques in the full data set which is a factor of 2 grater than the sample used in this analysis. In addition, to examine further the potential of the RF detection, more antennas have been installed in one of the stations. Specifically, since 2017 station-A is equipped with 4 RF antennas receiving a com-mon trigger from the HDM detectors. This will allow to study the correlation between RF signals corresponding to the same shower events.
Funding: This research was supported by the Hel-lenic Open University Grant No. ΦK228: “Development of technological applications and experimental methods in Particle and Astroparticle Physics.”
Acknowledgments: We would like to thank Co-dalema experiment and especially Dr. Lillian Martin and Dr.Didier Charrier for their precious support in this work. We would like also to thank Michael Petropoulos, George
Georgis and the technical staffof HOU for their support in operating the Astroneu array.
References
[1] D.Ardouin et al., Nucl. Instrum. Methods A,555, 148-163 (2005).
[2] P. Schellart, A. Nelles S. Buitink et al., Astron. Astro-phys.,560, 98 (2013).
[3] Pierre Auger Collaboration,Nucl. Instrum. Meth. A 798, 172-213 (2015).
[4] Schröder F. G., Prog. Part. Nucl. Phys., Elsevier,93, 1-68 (2017)
[5] Huege, T. Phys. Rep., Elsevier BV,620, 1-52 (2016) [6] O. Scholten K.Werner F. Rusydi., Astropart. Phys.,29,
94-103 (2008).
[7] G.A. Askaryan, Phys. JETP14, 441 (1962).
[8] I. Manthos et al., arXiv:1702.05794 (2017), to be sub-mitted.
[9] A. Leisos et al., submitted to Universe (2018). [10] D. Charrier, Nucl. Instrum. Methods Phys. Res.,
Sect.A 662, 142–145 (2012).
[11] A. Leisos et al., submitted to Universe (2018). [12] T. Avgitas et al, arXiv:1702.04902 (2017), to be
sub-mitted.
[13] T. Avgitas et al., arXiv:1801.04768 (2017), to be sub-mitted.
[14] D. Charrier, IEEE Antennas and Propagation Society International Symposium, 4485-4488 (2007).
[15] S. Hansen et al, IEEE Transactions on Nuclear Sci-ence,V.51, 926-930 (2004)
[16] O. Ravel, Nucl. Instrum. Methods Phys. Res., Sect., A 662, 89-94 (2012).
[17] C.A. Balanis,Antenna Theory- 3rd Edition, (Wiley, 2010).
[18] G. Burke and A. Poggio,Numerical Electromagnet-ics Code (NEC) method of moments, parts I, II, III, tech. rep., (Lawrence Livermore National Laboratory, NEC-3, 1983).
[19] J. D. Kraus and R. J. Marhefka,Antennas, (McGraw-Hill, 2003).
[20] P. Abreu for the Pierre Auger Collaboration, Nucl. Instrum. Methods Phys. Res.,B 521, 65-72 (2013). [21] V. Marin and B. Revenu, Astropart. Phys. 35, 733
(2012)