Physical Processes in Complex Plasma
Slobodan Miti´
c
Physical Processes in Complex Plasma
Slobodan Miti´
c
Dissertation
der Fakult¨at f¨ur Physik
der Ludwig–Maximilians–Universit¨at
M¨unchen
vorgelegt von
Slobodan Miti´c
aus Niˇs / Serbien
Zweitgutachter: Prof. Dr. Dietrich Habs
Contents
Abstract xiii
Abstract in German xv
1 Introduction 1
1.1 General review of complex plasma . . . 1
1.1.1 Complex plasma in nature . . . 2
1.1.2 Complex plasma in industry . . . 3
1.1.3 Complex plasma in laboratories . . . 4
2 Basics of Complex Plasma 9 2.1 Microparticle charging . . . 9
2.2 Interaction of particles in complex plasmas . . . 13
2.3 Forces . . . 16
2.4 Structures . . . 20
2.4.1 Coupling parameter Γ . . . 21
2.4.2 Pair correlation function - g(r) . . . 22
2.4.3 Local Order Analysis . . . 23
2.5 Optical emission spectroscopy . . . 25
2.5.1 Elementary introduction . . . 26
2.5.2 Spectroscopy and Complex Plasmas . . . 27
3 Experimental Setup 31 3.1 Evolution of the setup: History of Complex Plasmas, Different setups, Mi-crogravity experiments . . . 31
3.3 Plasma Crystal 4, PK-4 . . . 34
4 Cumulative thesis 39 4.1 Structural Properties of Complex Plasmas in a Homogeneous Discharge . . 40
4.1.1 Objectives . . . 40
4.1.2 Experiment and methods . . . 40
4.1.3 Results . . . 41
4.1.4 Conclusion . . . 42
4.2 Convective Dust Clouds Driven by Thermal Creep in a Complex Plasma . 44 4.2.1 Objectives . . . 44
4.2.2 Experiment . . . 46
4.2.3 Results . . . 46
4.2.4 Conclusion . . . 50
4.3 Spectroscopic Evaluation of the Effect of the Microparticles on a Radiofre-quency Argon Plasma . . . 51
4.3.1 Objectives . . . 51
4.3.2 Experimental method . . . 51
4.3.3 Results . . . 52
4.3.4 Conclusion . . . 54
4.4 Determination of Electron Temperature in Low-pressure Plasmas by Means of Optical Emission Spectroscopy . . . 55
4.4.1 Objectives . . . 55
4.4.2 Model . . . 55
4.4.3 Results . . . 56
4.4.4 Conclusion . . . 58
5 Outlook and future work 61
Bibliography 65
Acknowledgements 75
CONTENTS vii
Publication list 79
5.1 Publication in refereed journals: . . . 79 5.2 Publication in conference proceedings: . . . 79
List of Figures
2.1 Schematic of interaction of a particlej with a dust grains of the same charge. 11 2.2 Phase diagram of Debye-H¨uckel systems, obtained from numerical modelling. 22
2.3 Relative number of microparticlesN6/N that have six neighbors (6-fold cells) vs. the coupling parameter Γ for different types of confinements presented in insets (a) for potential-well and (b) for parabolic confinement. . . 22
2.4 Pair correlation factor, g(r), for different coupling parameters. . . 23
2.5 Different types of lattice structures commonly found in complex plasma systems. . . 24
2.6 Local order analysis for characteristic phases in the process of crystallization. From liquid like (far left), glassy (middle) to crystal phase of particle cloud (right). . . 25
3.1 Sketch (left) and cross section (right) of the PK-3 Plus experimental setup. 32
3.2 Sketch of PK-4 experimental setup. . . 34
4.2 Distribution of dust particles at different values of Γ in the plane of local or-der parametersq4−q6(calculated by using 12 nearest neighbors) as seen from MD simulations of Yukawa systems of particles together with experimental data. Scattered data are color-coded by third order rotational invariantw4
value. Data for ideal hcp (#) and fcc (∇) are also plotted. Distribution (b) shows a liquid-like system with Γ ∼ 1, while case (a) corresponds to a crystallized Yukawa system with Γ!104. Experimental data are scattered
within the area marked with (c) and in detail presented in the insert. . . . 42
4.3 Experimentally recorded particle positions for 30P apressure and low power plasma. Shell-like structure is clearly visible. . . 43
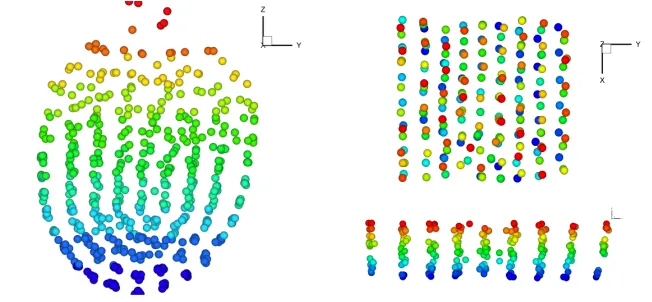
4.4 Example of other experimentally resolved particle positions (left). Top and side view of crossection of cloud approximately at the middle of its hight (right). Particles are clearly ordered in shells and have well defined order. 44
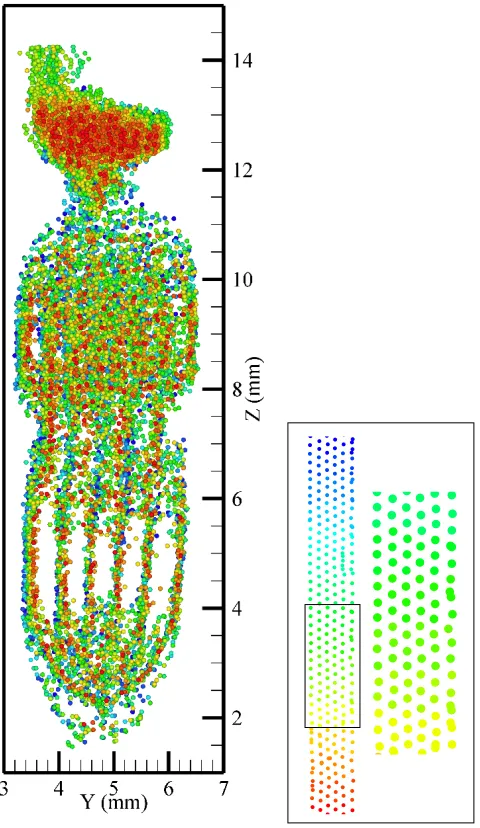
4.5 Particle structure at higher power and high pressure. The complexity of these structure is due to the presence of different types of particles in the plasma (left). One layer of particles at about 5 mm hight and magnification of one part of it (right). A clear hexagonal structural arrangement is obvious. 45
4.6 Dust clouds ofa = 1.64µmparticles at pressures of 30, 50, and 100P a(from left to right). The vertical dash-dotted lines indicate the position of the center of the tube. The field of view is 21 x 26 mm. . . 47
4.7 Convective dust clouds of a = 3.05µm particles at a pressure of 50P a for cases (a) “plasma on” and (b) “plasma off”. The shape of the cloud and direction of the rotation in the ”on” and ”off” cases are indicated by the upper and lower loops, respectively, and their overlap shows the region used for the reconstruction of radial electric force (see Fig. 4.9). The vertical dashed lines show the center of the tube. . . 48
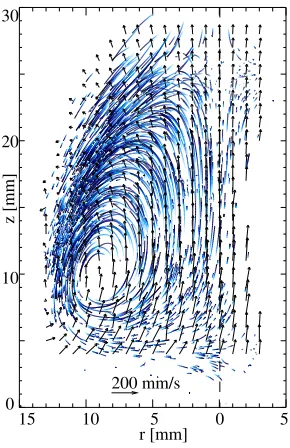
4.8 Averaged gas flow velocity field (vectors) superimposed with particles tra-jectories. The vertical dashed line indicates the center of the tube. . . 49
4.9 Reconstructed radial force for the overlapping region. The vertical dashed line indicates the center of the tube. . . 49
LIST OF FIGURES xi
4.11 Measured spectral dependence of the attenuationKd
ij and relative absorbtion
1−!Kd ij
"−1
of the light by a cloud of 2.55 µm diameter microparticles. In the spectral range of interest the relative absorbtion varies more than twice. The higest value of Kd
ij, obtained in our experiments, is ≈1.13 . . . 53
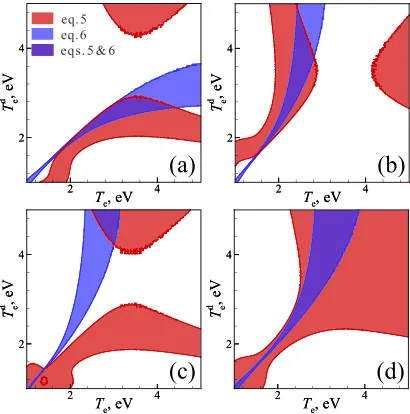
4.12 Influence of the presence of the microparticle cloud on the parallel-plate RF-discharge in argon at 30 Pa. (a) videoimage of a microparticle-free RF-discharge; (b) videoimage of a discharge containing a microparticle cloud in the vicinity of the bottom electrode; (c) videoimage of a laser-illuminated microparticle cloud; (d) axial profiles of the intensities of argon spectral lines; (e) axial profile of the number density of metastable 1s5 state; (f) axial profile of the number density of radiative 1s2 state. In figures (d)-(f) solid line corresponds to the microparticle-free case and dashed line with circles corresponds to the case of a plasma, containing a microparticle cloud. . . 54 4.13 Solution of eqs. 4.5 and 4.6 for the points in microparticle-free plasma at an
argon pressure of 60 Pa and RF power of 0.2 W withδF =±0.05: (a) index 1 corresponds to the vertical position z= 5 mm (peak of emission), index 2 - toz = 11 mm (minimum of the emission); (b) index 1 -z = 5 mm (peak of emission), index 2 -z = 26 mm (symmetric peak of emission). Evidently, the temperatures are much better determined if the two points with significantly different parameters are considered. The metastable density profile and the positions used for the evaluation are presented in the inset. . . 57 4.14 Solution of eqs. 4.5 and 4.6 for the points in the plasma at the argon
pressure of 60 Pa and RF power of 0.2 W with δF =±0.02. (a) z= 5 mm, presence of microparticles decreases the densities of 1sstates; (b)z = 8 mm, presence of microparticles increases the densities of 1s states; (c) z = 17 mm and (d) z = 26, presence of microparticles practically does not affect the densities of 1s states; Vertical positions for (a) and (b) are inside the microparticle cloud, whereas for (c) and (d) outside. For (d) the density of 1s states is significantly higher, than that for (c). Te exhibits much larger
upper limit than Td
e in (a) and vice versa in (b), which is in accord with
Abstract
This thesis is a cumulative dissertation that consists of four papers addressing the different aspects of complex plasmas.
The first paper addresses the issue of structural properties of complex plasma in elongated dc discharge chamber. The main motivation for this work was based on a detailed three-dimensional reconstruction of complex plasmas rarely investigated so far. The analysis of the structural arrangement of particles is one of the fundamental questions in complex plasma crystals. In this work a full three-dimensional reconstruction of the positions of a few thousand particles was done. The reconstruction of particles positions revealed the locally enhanced structural properties that indicate that the system was near crystallization. Due to the strong influence of gravity a combination of pronounced macro structures is clearly visible, like shells and layers. Presented results might help us to understand similar generic properties of the other cylindrical-shaped systems, particularly those on the nano-meter scale.
The second paper enclosed in this thesis is focused on fundamental gas thermodynamic properties. The convective motion of particles in complex plasma experiments is a common effect. In most cases the origin of this motion was described by a temperature gradient in the discharge or electric forces. In this particular experiment particles experienced unusually high velocities due to the convective motion of the background gas. By detailed analysis it was found that the convection of the gas is produced by the thermal gas creep effect. The main results of this work are the confirmation of the presence of gas creep in typical conditions for complex plasmas experiments, a full reconstruction of the gas velocity pattern and a rare experimental example of this effect.
The third work is oriented to the important question of complex plasma diagnostics by means of optical emission spectroscopy. For this purpose the density of metastables in an argon plasma was estimated in the case of a pure plasma and a plasma with a microparticle cloud levitated in it. The estimation of the metastable density was based on measuring the selfabsorption of the pure plasma and the complex plasma. For the complex plasma an additional correction had to be implemented for the light extinction on the surface of the microparticles. The correction factor was experimentally evaluated. It was found that the presence of particles in the plasma influence the metastable density in a non-local way. Results presented here confirms the changes in plasma parameters (metastable density) due to the presence of particles and introduces wavelength dependent light extinction on particles as an important effect for any spectroscopic observation of complex plasmas.
Zusammenfassung
Diese Doktorarbeit ist eine kumulative Dissertation bestehend aus vier Ver¨offentlichungen, die sich mit verschiedenen Aspekten der komplexen Plasmen befassen.
Die erste Ver¨offentlichung behandelt die strukturellen Eigenschaften komplexer Plasmen in einer l¨anglichen DC-Entladungskammer. Die vordergr¨undige Motivation dieser Arbeit war eine detailgetreue, dreidimensionale Rekonstruktion komplexer Plasmen, wie sie bis jetzt kaum untersucht wurde. Die Analyse der strukturellen Anordnung von Teilchen ist eine der grundlegenden Fragen auf dem Gebiet der komplexen Plasmakristalle. In dieser Arbeit wurde eine vollst¨andige, dreidimensionale Rekonstruktion einiger tausend Teilchen bewerkstelligt. Die Rekonstruktion der Teilchenpositionen gab die lokal verst¨arkten, strukturellen Eigenschaften zu erkennen, die zeigen, dass sich das System nahe der Kristallisation befand. Durch den starken Einfluss der Gravitation wird eine Kombination ausgepr¨agter Makrostrukturen - ¨ahnlich zu Schalen und Lagen - deutlich sichtbar. Die hier pr¨asentierten Ergebnisse k¨onnten uns helfen, ¨ahnliche grundle-gende Eigenschaften der anderen zylindrisch geformten Systeme zu verstehen, im besonderen derer in der Gr¨ossenordnung von Nanometern.
Die in dieser Doktorarbeit enthaltene zweite Ver¨offentlichung konzentriert sich auf grundlegende ther-modynamische Eigenschaften von Gasen. Die Konvektionsbewegung von Teilchen in Experimenten mit komplexen Plasmen ist ein verbreiteter Effekt. In den meisten F¨allen wurde der Ursprung dieser Be-wegung durch einen Temperaturgradienten in der Entladung oder den elektrischen Kr¨aften beschrieben. In diesem speziellen Experiment erfuhren die Teilchen ungew¨ohnlich hohe Geschwindigkeiten durch die Konvektionsbewegung des Hintergrundgases. Eine detaillierte Analyse ergab als Grund f¨ur die Konvek-tion des Gases den thermischen Kriecheffekt des Gases. Die Best¨atigung der Existenz dieses Effektes, und eine vollst¨andige Rekonstruktion der Gasgeschwindigkeitsmuster sind das vorrangige Ergebnis dieser Arbeit. Die wichtigsten Ergebnisse dieser Arbeit sind die Best¨atigung der Existenz von Kriecheffekten unter typischen Bedingungen in Experimenten mit komplexen Plasmen, die vollst¨andige Rekonstruktion der Gasgeschwindigkeitsmuster, und das seltene experimentelle Beispiel dieses Effektes.
Chapter 1
Introduction
1.1
General review of complex plasma
Complex plasmas represent systems of small solid (dust) particles immersed into a plasma. Plasma-particle interaction and particle-particle interaction result in very complex and interesting underling physics of complex plasmas.
The number of parameters (plasma parameters, particle size and material, concentra-tion) and their range allow to engineer complex plasmas in many different ways.
Starting from star forming regions, interplanetary medium, planetary rings, Earth’s atmosphere, large number of industrial applications, laboratories investigations to fusion reactors and new materials, complex plasmas are ubiquitous and making their mark in physics.
The observation of small solid particles in a discharge due to the sputtering of the cathode material in 1920’s by Langmuire [1] represents the first publication of aggregates immersed in a discharge.
reported in 1994 in an rf discharge [4], [5], [6], [7]. From this point on Complex plasmas started to develop very fast.
1.1.1
Complex plasma in nature
The study of plasma-dust interaction are of major interest in astrophysics due to the presence of dust almost anywhere in space. The closest example of dusty plasma in nature have been observed in the lower part of the Earth’s ionosphere. The most significant phenomenon is the formation of a special type of clouds, named noctilucent clouds (NLC) (from latin - night shining) and micro-meteorits. The NLC are composed of ice, heavy ion clusters, dust from man made pollution (terrestrial aerosols). They are visible only when illuminated by sunlight from below the horizon, while the ground and lower layers of the atmosphere are in the Earth’s shadow. Due to the presence of sub-micronsize particles in the ionized surrounding of the NLC there is a strong radar backscattering at MHz and GHz frequencies [8].
A new group of examples of complex plasmas existing in nature can be observed in space environment. Most of the rings of the giant planets contain micron to sub-micron size of dust particles and with further analysis a wealth of information was recovered [9]. First observation of the Jupiter’s rings were made in 1979 and inspired the further research. Observation of planetary rings continue with recordings of Saturn’s rings and legendary ”spokes” which were an inspiration for a number of publications and theories about charge and dust-plasma interaction [10], [11], [12], [13], [14].
1.1 General review of complex plasma 3
Smaller dust particles can be found in the interstellar medium. This submicron size particles are mainly composed of silicates, carbon, ice and iron compounds. Dust in the interstellar medium can play an important role in spectral observations of light from other stars. Depending on the particle size and particle number density, the passing light can by dimmed due to the extinction of light by particles. If the dust cloud is thick enough, the light will be completely blocked, leading to dark areas. These dark clouds are known as dark nebulae.
1.1.2
Complex plasma in industry
The development of surface-processing, etching and computer chips industry using chem-ically active discharges in early 1990s were faced with the presence of levitating grains in the plasma which triggered further investigation in the direction of complex plasmas [15], [16], [17]. The physics of grain formation and growth in etching processes is actively investigated [18], [19]. Presence of dust in almost all industrial plasma is a big problem due to contamination of semiconductors, films etc. Argon silane mixture is widely used as buffer gas in industry and a great number of publication were devoted to the growth of particles in it [20], [21], [22], [23], [24], [25], [26], [27].
The transport of dust particles in the discharge has also been well studied (see for example [28], [29]). Depending on the construction of the discharge different forces can be used to confine and move particles. Manipulation of a dust cloud or an individual particle become a great tool for industry and for experimental use [30].
such materials with promising optoelectronic and electronic properties. The incorporation of these particles into the crystalline layers led to an enhancement of the layer properties: the crystalline structure was improved, it had a higher stability under thermal annealing and the defect density was reduced. As a result those materials are highly suitable for thin film transistors and solar cells [31], [32].
Detailed studies of particle formation and growth in plasma led to a better control of the particle production. Size, structure and composition can be tailored for the specific ap-plication [33]. Using gases like methane, ammonia or nitrogen in addition to silane plasmas lead to the formation of dust particles based on this components. A good temperature con-trol and gas flow allows creating a desired particle stoichiometry. With the mentioned feed gases, particles likeSi3N4 and SiC have been formed resistant against oxidation with very good mechanical and thermal properties, and thus are excellent catalyst support powders [34], [35].
Development of applied complex plasma research led to the creation of an entirely new class of materials by using plasma-based technologies. Increased interest of industry on dusty plasma technologies resulted in the development of applied dusty plasma research in direction of coating, surface activation, etching, modification and separation of clustered grains in the plasma environment [17].
New perspectives in the application of complex plasmas are related to their basic phys-ical properties. The investigations of complex plasmas over the years resulted in more insight in particle interaction and the possibility to tune this interaction. Current work shows very interesting results in changing the interaction potential between the particles by external electric fields [36]. Moreover modifying the potential can result in changes of other properties like viscosity and optical properties. Resulting effects can have signifi-cant industrial applications in the production of smart materials based on fast response of complex systems on the external influence.
1.1.3
Complex plasma in laboratories
1.1 General review of complex plasma 5
at atmospheric pressure [42] and nuclear-induced dusty plasmas [43], [44]. Transition from a disordered gaseous-like to a liquid-like phase and the formation of plasma crystals were observed [45]. Experiments are based on particles that are either grown in chemically active discharges or injected in to the plasma.
Since then many studies (experimental and theoretical) are devoted to the investigation of charging processes, dust-dust interaction, dust-plasma interaction and the forces acting on the dust particle (electric force, neutral drag force, ion drag force, thermophoretic etc.). Recent developments of laboratory investigations give the opportunity to study complex plasmas in various types of gas discharges and in a broad parameter range (pressure, power, particle size and density etc.). The discharges are typically sustained in the pressure range from 0.1 to a few hundred Pa with input power up to a few hundreds of Watts. In such plasmas the average electron temperature is in a range from 1 to 7 eV and the ion temperature on the order of the neutral gas temperature 0.03 eV, with the electron and ion densities ne =ni ∼108−109cm−3. The particle sizes usually used in the laboratories
on Earth are spherical dielectric particles in the range form 1 to 10 µm which acquire a significant negative charge in plasma of about 103−105 elementary charges.
As a result of the high particle charge the interaction between particles can strongly exceed the interaction between particles and other plasma species for several orders of magnitude. In this case the behavior of the particle cloud is mainly governed by the electrostatic (repulsive) Coulomb force and these systems are known as strongly coupled Coulomb systems (liquids or crystals). Strongly coupled systems represent one of the most studied areas of complex plasmas due to the strong scientific impact on other fields and the potential in industrial applications.
inter-national space station. As a result, it was possible to directly study the plasma-dust and dust-dust interactions without gravitational perturbations. There it is possible to study a much wider set of parameters and increase the size of dust particles up to hundreds of microns, which is impossible in laboratories on Earth.
Everyday research (theoretical and experimental) is still committed to the investigation of the interaction potential between particles and its control. Latest discovery that complex plasma can have electrorheological properties [36] add a new dimension to the research of electro-rheological fluids having a significant industrial application potential in hydraulics, photonics or medical engineering. Meanwhile, the research on dusty plasma interaction and particle growth is still motivated by strong technological challenges. Presence of dust particles created by plasma-wall interaction represents a serious safety hazard in thermo-nuclear fusion devices [28], [46]. Thus, the problem of dust removal from these devices represents one of the most important technological and scientific problems. On the other hand, nanoparticles grown in the plasma can have very useful properties. For example, the polymorphous silicon created by embedding the silicon nanoparticles in the amorphous silicon, is of major interest for the manufacture of solar cells [47], [48].
occur-1.1 General review of complex plasma 7
Chapter 2
Basics of Complex Plasma
In this chapter some basics of complex plasma important for further understanding of this work are explained.
2.1
Microparticle charging
The screening of electric fields created by individual charged particles (ions, electrons and dust particles) or by a surface with a potential that is different to the plasma potential is a fundamental characteristic of plasma. The screening effect is defined by a characteristic length called the Debye length. Below this length the electric field of charged particles can influence other charged particles. For electron and ions the Debye lengths are defined by the following equation
λe(i) =
# $ $
%#0kBTe(i)
ne(i)0e2 (2.1)
wherekB is the Boltzmann constant,#0 the vacuum permittivity,Te(i)the electron (ion) temperature, ne(i) the electron (ion) density and e the elementary charge.
For typical discharge conditions Te = 3 eV, Ti = 0.03 eV n0 = 1015 m−3 electron and
ion Debye lengths are 120 µm and 13 µm respectively.
In dusty plasmas, the linearized Debye length is often used. It is given by [60]:
1
λ2 D
= 1
λ2 De
+ 1
λ2 Di
(2.2)
than the inter-particle distance d, particles can be considered as isolated in the plasma. On the other hand, when λD > d, particle interact with each other and show a collective behavior.
In this section charging of the particles will be considered only for an isolated particle with a'λD wherea is the radius of particles.
The charging process of dust particles in a plasma is governed by the contributions of all currents entering and leaving the dust surface, involving plasma electron and ion currents, photoemission and thermionic emission currents, etc.
dQd dt =
&
ab
Iab+&
em
Iem (2.3)
where Qd is charge of the particle and Iab and Iem are currents absorbed and emitted by the particle with appropriate signs. In most cases for discharge plasmas, one can ignore emission currents so the particle consequently get charged by the accumulation of charged plasma particles:
dQd dt =
&
j
Ij (2.4)
where Ij is the current associated to the speciesj.
In the stationary regime the charge of the particle depends on the frequency of col-lisions of electrons and ions with the particle. In most plasmas ve ( vi where ve(i) =
'
8kBTe(i)/πme(i) is electron (ion) the thermal velocity. Consequently electrons reach the particle surface at a greater rate, more electrons are collected, and the particle surface potentialφdis thus negative. Ion and electron currents are affected by the dust surface po-tential. Thus, when it is repulsive for the speciesj, the current from the oppositely-charged plasma particles is favored which modifies, in proportion, the dust surface potential.
For particles with radius a and for a ' λe/i ' λe(i)mf p, where λe(i)mf p is the mean free path of electron/ion, the currents of the plasma species on the particle surface can be calculated using the orbital motion limited (OML) theory [61], [62].
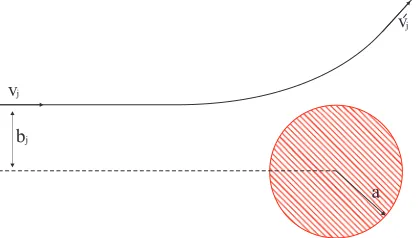
Let us consider a plasma particle j with velocityvj approaching the solid particle with radius a from infinity. When the particle j enters the Debye sphere of the solid particle, it experiences an electrostatic force, its trajectory gets affected and the velocity change to
2.1 Microparticle charging 11
bj vj
a vj
Figure 2.1: Schematic of interaction of a particle j with a dust grains of the same charge.
collision cross section:
σjd=πb2j (2.5)
For a solid particle with mass md (mi (me the equation of energy and momentum
conservation for the interaction with particle j has the form
mjbjvj =mjvj!a (2.6)
1 2mjv
2 j =
1 2mjv
!2 j +
qjQd
4π#0a (2.7)
where mj is the mass of j particle and qj is its charge. The charge of the solid particle
Qd is directly connected to the potential differenceφdif =φd−Vpl where Vpl is the plasma potential. For a spherical particle where λD ( a the charge of the particle is Qd=Cφdif
whereC = 4π#0aexp(−a/λD)≈4π#0a is capacitance of spherical solid particle with λd (
a. Combining the equations 2.5, 2.6, 2.7 the cross section can be written as
σdj =πa2(1−2qjφd
mjv2 j
) (2.8)
For a velocity distribution functionfj(vj) of plasma speciesjthe current on the particle surface can be written as
Ij =qj ( ∞
vjmin
vjσjdfj(vj)d3vj (2.9)
governed by equation (1/2)mjv2
jmin = qjφd, and the particle needs a minimal velocity of vjmin ='2qjφd/mj to overcome the potential difference from the charged solid particle.
For a Maxwellian plasma, the velocity distribution function is
fj(vj) =nj( mj 2πkBTj
)3/2exp(−mjv
2 j
2kBTj
) (2.10)
where nj is the number density of j species. Combining attractive and repulsive cases the currents to the particle surface have the following form, respectively:
Ij = 4πa2njqj )
kBTj
2πmj *1/2)
1− qjφd
kBTj *
(2.11)
Ij = 4πa2njqj ) kBTj 2πmj *1/2 exp )
−qjφd
kBTj *
(2.12)
In the steady state case, the particle charge is constant and electron and ion currents, Ie
andIi, compensate each other Ie =Ii. For most laboratory plasma where Te > Ti the dust potential upper limit is thus [30], [60], [63].
φd= kBTe
e ln )
ni ne
+meTe miTi
,1/2*
(2.13)
and the dust particle charge is
Qd =
4π#0akBTe e ln ) ni ne +meTe miTi
,1/2*
(2.14)
2.2 Interaction of particles in complex plasmas 13
2.2
Interaction of particles in complex plasmas
The interparticle interaction is one of the most fundamental property in complex plasmas. Understanding the underlying physics of the interaction is of great importance for explain-ing the observed phenomena in laboratory complex plasmas, astrophysical plasma, fusion reactors, plasma processing etc. In order to estimate the electrostatic force of the charged particles it is necessary to know the distribution of the electrostatic potential U(r) in the plasma around the dust particle. The main point is that the interaction potential is not unique but strongly depend on the conditions of the background plasma. Here it should be mentioned that the interaction between dust particles is not only of electrostatic nature.
For the lower dust concentration the interparticle interaction can be considered within the approximation of an isolated particle.
The electrostatic force acting on a particle with a charge Ze from another particle at a distancer is presented in the form:
Fint =− dU(r)
dr (2.15)
where U(r) is the interaction potential.
One of the main interaction mechanisms is the electrostatic repulsion between like-charged particles. For small distances r ' λD the potential of an isolated particle is not affected by the ion screening and it can be considered to be of pure Coulomb form [70]. At the moderate distances r ∼ λD screening starts to affect and the Debye-Huckel potential can by used.
U(r) = Q
rexp(−r/λD) (2.16)
At larger distances (several Debye length) absorption of ions on the particle surface results in a much slower decay of the potential, which scale as ∝r−2. Here it is important
to notice that previous evaluations are valid for collisionless, isotropic plasma where ion mean free path is much larger then Debye screening length, λimf p ' λD. For collisional plasma, λimf p ' λD, the ion-neutral collisions strongly affect the potential distribution around the particle resulting in even slower decay of the potential which scales as ∝ r−1
[71], [72].
between two particles. The interaction potential was reconstructed from the particles trajectories and velocities during the collisions by using the equation of motion.
Beside the electrostatic interaction, system of particles can experience forces caused by flow of plasma species on their surfaces. For a single grain in a isotropic plasma, ion and electron flows on its surface is spherically symmetric and there is no net momentum transfer from ions to a grain. For two grains separated by a distance smaller than the ion mean free path in isotropic collision-less plasma, the plasma flux on one grain is shadowed by the presence of other in its vicinity. This shadowing effect results in a difference in momentum transfer from plasma to grains where pressure is larger from outside of the grains than from inside. As outcome some attraction of particles can be expected. This effect was proposed by Ignatovet al. [74] followed by works of Tsytovichet al. [75] and Lampeet al.
[76]. Theory predict that the shadow force can be dominant only for collision-less plasma at large interparticle distances d (λD where the repulsive Coulomb field is screened and that attraction is proportional to the grain size.
Shadowing of the neighboring particle can result in an additional interaction associ-ated with neutral atoms. If the temperature of the particle surface is different from the surrounding plasma, neutral atoms scattered from the particle surface will have energy distribution different from that of the ambient neutral gas [77]. This will result in net fluxes of energy and momentum between particle and gas. If two particles are located close to each other, an anisotropy in momentum flux on the particles will exert shadowing force between them. This force can be repulsive for temperature of particles higher then ambient gas and attractive in opposite case. This effect was first proposed by Tsytovich
et al. [77].
However interactions governed by shadowing effect are only theoretical and, so far, there are no experimental confirmations. Possibility of experimental observation of this effects lies in microgravity experiments where big particles can be levitated in an isotropic plasma.
2.2 Interaction of particles in complex plasmas 15
making it non-Hamiltonian.
The wake effect is usually observed in ground experiments where particles are levitated in the plasma sheath above the lower electrode. In the work by Lampe et al. [76] it was calculated numerically that, for plasma conditions whereTe/Ti ≈25 the decay of the wake potential behind the particle depends on the value of the Mach number. Experimental work of Melzer et al. [78] based on laser manipulation of particles confirmed the presence of non-reciporcal force between two particles. Two particles of different sizes were levitated one above the other in the plasma sheath of a low pressure rf discharge. Then radiation force created by a focussed laser beam was used to push the particles separately and observe the reaction of the other one. It was shown that the lower particle followed the motion of upper one and that the effect was not reciprocal.
2.3
Forces
A particle immersed in the plasma is under the influence of many forces. On ground ex-periments gravity is always present. Collisions of ions and neutrals with the particle lead to considerable momentum transfer so that particle can fell an ion drag and a neutral drag force. An inhomogeneity in the plasma can create electric or pressure gradients which can influence the particle.
The electric force
Due to its charge the particles are subject to electric forcesFe induced by electric fields in the plasma. The different mobility of electrons and ions leads to unequal space distributions of the charges in the plasma which lead to the appearance of an electric field. In capacitively coupled rf discharge due to the higher mobility of the electrons electric field is created in the sheath region which is strong enough to levitate micron size particles. Also due to the ambipolar diffusion the walls of the discharge chamber gets negatively charged and repel the particles. In general the electric force acting on a particle can be written as:
Fe =QdE (2.17)
Gravity force
In any ground-based experiments, gravity plays an important role in the particle position-ing in the discharge. For micron size particles the gravity force is of the same order of magnitude or even higher as other plasma induced forces so it can not be neglected. For smaller particles a ' 1 µm gravity is negligible. This is the reason why nano particles occupy the whole volume of the discharge. For a spherical particle with mass densityρthe gravity force is:
Fg =mdg = 4 3πρa
3g (2.18)
2.3 Forces 17
Neutral drag force
This force is the result of collisions of solid particles with neutral gas atoms or molecules. It is the rate of momentum transfer between the neutral atoms/molecules and the solid particle during their collisions. It is therefore proportional to the gas pressure and particle velocity, which is usually much smaller than the thermal velocity of neutrals. The behavior of particles in the plasma with respect to neutrals can be expressed via Knudsen number as the ratio of atomic/molecular mean free path and particle radius Kn = λmf p/a. For large Knudsen number Kn(1 the molecular regime is realized.
For a particle velocityvp and gas flow velocityvn the neutral drag force can be approx-imated by [79]
Fn!nnmnσnd(vd−vn) (2.19)
assuming the hard sphere interaction, elastic collision, between particles and the neutral gas atoms, where nn is the density of neutral atoms/molecules,mn their mass andσnd the cross section of the dust neutral interaction.
More accurate expression is developed in case when relative velocity of dust and gas is very small in comparison with the neutral gas thermal velocity, |vd−vn| ' vT n. In this case the neutral drag force can be approximated as a simple expression (so-called Epstein expression) [80]:
Fn=−4 3πa
2nnmnvT n(vd−vn) (2.20)
The letter is valid for specular collisions in which the neutrals colliding with the dust particle have their velocity components normal to the dust surface reversed after collision. In most practical situations neutrals are first absorbed at the particle surface and then re-emitted and this is diffuse reflection. In case for the perfect diffuse reflection the neutral drag force should be corrected in following way
Fn =−4 3πa
2nnmnvT n+1 + π
8
,
(vd−vn) (2.21)
For relative velocity |vd−vn|very high in comparison with the neutral thermal velocity
vT h (not experimentally achieved) the neutral drag force is proportional to the squared velocity and it is same for both the specular and perfect diffuse reflection [26]:
For a Knudsen number Kn ' 1, the system is in the hydrodynamic regime and the neutral drag can be evaluated like friction leading to the Stokes expression [81]
Fn=−6πνavd (2.23)
where ν is the neutral gas viscosity.
Ion drag force
The ion drag force describes how momentum is transfered from the ions to the dust par-ticles. Collisions of particles and ions is induced by an external electric field or simply by thermal motion of ions and particles. Momentum transfer is realized through inelastic collisions (absorption of ions by the particle surface) and elastic collisions (scattering of ions in the electric field of particle).
The ion drag force plays an important role in positioning of the particles in the discharge and the structural arrangement of particles in laboratory experiments [82], [29]. A variety of publications are dedicated to the ion drag force, observing its properties (direction and intensity) in the plasma, see for example [83], [84], [85], [86]. In other investigations this force is used to evaluate other properties in complex plasma systems, like charge of the particle in [67]. This force is responsible for low-frequency waves in complex plasmas [87], [88], voids on ground and microgravity experiments [89], [90] etc.
Analytical evaluation of ion drag to the particle is based on pair collision approximation for collisionless ions where λmf p (rint and isolated dust particle d( rint, where λmf p is main free path of ions,rintis characteristic distance of ion particle interaction and d is the
average distance between particles. In general ion drag force can be expressed as:
Fi =mini (
vfi(v)σitr(v)vdv (2.24)
where fi(v) is the ion velocity distribution function, σtr
i is the momentum transfer cross
section for ion particle collisions depending on the ion velocity through the scattering parameter β = U0/mv2
iλD where U0 = e|ϕs|aexp(a/λD) and λD is effective screening
lenght. For subthermal flows (ion flow velocity below thermal ion velocity, ui ≤ vT i) the
thermal scattering parameter is used βT =e2|Z|/λDTi.
In case of small Mach number (MT =ui/vT i '1) and βT ≤5 the following expression for the ion drag force can be used [91]:
Fi = 1 3
-2
π +Ti
e ,2
2.3 Forces 19
where
Λ(βT)!
( ∞ 0 e
−xln(1 + 2x/βT)dx (2.26)
is the modified Coulomb logarithm integrated over the Maxwellian velocity distribution function. The screening length is equal to ion Debye length here. For larger scattering parameter βT, investigated in [92] ion drag force have the following expression
Fi !
2 3 -2 π +T i e ,2
ln2βTMT (2.27)
When MT (1 in equation for scattering parameter β instead of ion thermal velocity vi, drift velocityui should be used.
Thermophoretic force
Solid particles suspended in the gas with a temperature gradient will be subjected to a force directed from the hot part to the cold part. The difference in momentum transfer from neutral gas to the particle from cold and hot part results in thermophoretic force towards the lower gas temperature. Then the thermophoretic forceFth on a microparticle with the radius a [93] is given as
Fth =−8 3
a2
vthktr∇Tn (2.28)
where vth = (8kT /πm)1/2 is the average thermal velocity of the gas atoms with mass m
at the gas temperature T and k is a Boltzmann constant. ktr is the coefficient of heat conductivity and ∇T is temperature gradient.
Thermal conductivity for monoatomic gases can be found in the literature [94] in the form
ktr = 2.4ηc
m (2.29)
wherec= 3k/2 is the specific heat per atom and ηthe shear viscosity of the gas. Viscosity was derived from the precise solution of the transport problem in the case of hard sphere [95]
η= 0.553 √
mkT
σ (2.30)
conductivity for different noble gases can be found in the [93]. Combining the equations 2.28, 2.29 and 2.30 gives the equation of the thermophoretic force
Fth=−3.33ka
2
σ ∇T (2.31)
A large number of publications is devoted to thermophoresis. It is commonly used for particle levitation [93]. Compensating the gravity by thermophoresis in an rf parallel plate plasmas results in presence of particles in central/bulk plasma so that the creation of a void can be observed and investigated on ground experiments. For example, for a melamine formaldehyde spherical particle of radius a = 1.46 µm and density ρ = 1.51 g/cm3, a
temperature gradient of 4.65 K/cm is required to compensate gravity in neon [97]. This temperature gradient is easily reachable in case of narrow gap (fewcm). A lot of phenomena are induced by a thermal gradient in the discharge. Most of these investigations were done in a parallel plate discharge where a uniform heating or cooling of the electrodes is possible. With precise manipulations, many different thermally induced effects can be observed, like bubbles, eruptions [98], convections [97], [99], structures [100] and particle levitations [93]. A temperature gradient in plasma can occur by difference in temperature of some parts of the discharge chamber (heating of vacuum pump) or by an inhomogeneous ionization (Ohm heating).
2.4
Structures
Under the influence of a background plasma microparticles introduced into the plasma can selforganize in various ways. Differences in selforganization are induced by interparticle interaction and mobility. When dust particles have high kinetic energies, they are in a gaseous state. By ”cooling” it down, the microparticles system starts to self-arange and liquify until the particles crystalize.
In the gaseous state particles have higher kinetic energies and lower level of order. When liquifying the particle cloud, electrostatic interactions overcome their kinetic energy and particles arrange towards a hcp lattice structures while more crystalized structures arrange in f cclattice types.
2.4 Structures 21
particles positions and their correlation with neighboring particles the local order can be evaluated observing the coupling parameter, pair correlation function or by comparison with different ideal lattice types.
2.4.1
Coupling parameter
Γ
One of the fundamental parameters of large systems of dust particles is the coupling pa-rameter Γ. It is the ratio of the potential energy of the interaction between two particles to their kinetic energy. For a simple Coulomb interaction between the particles,
Γ = Z
2e2
dTd (2.32)
whered∼=n−d1/3 is the characteristic average interparticle spacing with number density nd
of the particles and Td characterizes their kinetic energy.
For the Yukawa interaction the screening of the particles by the surrounding plasma modifies the coupling ratio by a factor exp(−k) wherek=d/λdis the structure (or lattice) parameter - the interparticle spacing normalized by the effective screening length, leading to
Γ = Z
2e2
dTd exp(−d/λd) (2.33)
Depending on the value of Γ, the system can be strongly or weakly coupled. Usually there are strongly coupled systems if Γ≥1.
There are plenty numerical works devoted to the resolving of the phase of the systems characterizing it with two independent dimensionless parameters Γ and k =d/λd. Differ-ent phases and possible lattice types are presDiffer-ented in (Γ, k) plane summarizing available numerical results. The phase diagram of the Debye-H¨uckel system is presented in figure 2.2 obtained by numerical modeling [101]. Three different phases were found depending on the values of coupling and structure parameters. For Γ above the melting curve two solid phases are found, bccfor small k and f cc for biggerk and fluid phase for Γ below melting curve.
0 2 4 6 8 10 102
103
104 solid (fcc)
solid (bcc) fluid
!
"
Figure 2.2: Phase diagram of Debye-H¨uckel systems, obtained from numerical modelling.
Figure 2.3: Relative number of microparticles N6/N that have six neighbors (6-fold cells) vs. the coupling parameter Γ for different types of confinements presented in insets (a) for potential-well and (b) for parabolic confinement.
2.4.2
Pair correlation function - g(r)
The structural analysis of the systems of particles in the plasma starts with a studies of single layers of particles. In this case fast and simple information of the interparticle separation could be extracted by calculating the pair correlation functiong(r).
2.4 Structures 23
by distance r, and it measures the translational order in the system.
g(r) = 1
N N & i=0 Nj & j=0
δ|ri−rj|/Nj (2.34)
where ri and rj are the coordinates of two particles separated by distance r+ ∆r, ∆r is a bin thickness andNj is the number of particles in the bin. An example ofg(r) for different
Γ is presented in figure 2.4. The position of the first peak corresponds to the particle separation.
There are many publications where pair correlation function is used for structural char-acterization of the system [103], [104], [105], [102].
r/a
g(r)
0 0.5 1 1.5 2 0 0.5 1 1.5 !!" r/a g(r)
0 0.5 1 1.5 2 0 0.5 1 1.5 !!" r/a g(r)
0 0.5 1 1.5 2 0
0.5 1 1.5
!!"#
Figure 2.4: Pair correlation factor, g(r), for different coupling parameters.
2.4.3
Local Order Analysis
For a detailed characterization of the system in an ordered state, a much more precise method for the structural analysis should be used. In a liquid or crystal phase, particles have well defined positions creating different lattice types. In these states the method should evaluate the position of each particle with respect to its nearest neighbors and compare this results with ideal lattice types.
To determine the local order of the particles a bond order parameter method is used [106]. In the framework of this method, the local rotational invariants for each particle are calculated and compared with those for perfect lattice types like f cc/hcp/bcc/ico (see Fig. 2.5).
Figure 2.5: Different types of lattice structures commonly found in complex plasma sys-tems.
each particle i by usingM nearest neighborsNb(i):
ql(i) =
4π
(2l+ 1)
m=l&
m=−l
| qlm(i)|2
1/2
(2.35)
wl(i) = &
m1,m2,m3
m1+m2+m3=0
l l l
m1 m2 m3
qlm1(i)qlm2(i)qlm3(i), (2.36)
where
qlm(i) =
1
Nb(i)
N&b(i)
j=1
Ylm(rij) (2.37)
and Ylm - are the spherical harmonics, rij = ri − rj, where ri are the coordinates of
i-th particle. In equation (2.36)
l l l
m1 m2 m3
are the Wigner 3j-symbols, and the summation in the latter expression is performed over all indices mi =−l, ..., l, that satisfy the condition: m1 +m2+m3 = 0.
It is important to stress that each lattice type has its own unique set ofql wlrotational invariants. It give us a possibility to identify observed lattice types, by comparing the observed ql, wl values with those qid
l , widl for a perfect lattice.
To define the local order around a particle we usedq4,q6,w4 rotational invariants. The rotational invariants can easily be calculated for perfect fcc/hcp/ico/bcc. For fcc/hcp/ico the number of nearest neighbors Nb = 12 and we have for fcc: qfcc
4 = 0.1909, qfcc6 = 0.5745, wfcc
4 = −0.1593 w6fcc = −0.01316; for hcp: q hcp
4 = 0.0972, q hcp
6 = 0.4847, w hcp
4 = 0.1341, whcp6 = −0.01244 and for icosahedral lattice type (ico): q4ico = 0, qico6 = 0.6633, w4ico =
−0.1593,wico
2.5 Optical emission spectroscopy 25
For the bcc case Nb = 8 and qsc
4 = 0.5092, q6sc = 0.6285, w4sc = −0.1593, w6sc = 0.1316.
To identify bcc clusters it is sometimes important to know the position of the second shell having 6 particles (the distance between the nearest-neighbor and the second shells in the bcc lattice is (2/√3−1)∆ ! 0.15∆). In that case Nb = 14 qbcc
4 = 0.0363, qbcc6 = 0.510, wbcc
4 = 0.1593, w6bcc= 0.01316.
Figure 2.6: Local order analysis for characteristic phases in the process of crystallization. From liquid like (far left), glassy (middle) to crystal phase of particle cloud (right).
In figure 2.6 a local order analysis is performed in different moments of crystallization of the particle cloud [107]. The first picture represents the local order for the particles in the gaseous phase. The second picture shows an already cooled system which is in a liquid like or glassy state where we see that the arrangement goes towards the hcp lattice type. In the last snapshot, the particles already have well defined local order divided into two lattice types hcp and f cc.
2.5
Optical emission spectroscopy
2.5.1
Elementary introduction
Plasma spectroscopy was intensively studied for the last few decades. Consequently there are a big number of processes and phenomena connected to this field. Nobel gases are inert and monoatomic in most cases so the number of plasma components involved in processes of plasma light emission is limited. In this section, only elementary processes relevant for the further understanding of the thesis will be described.
The starting point in all spectroscopic evaluations deals with the excitation of some upper states of neutral gas atoms and its spontaneous emission. Light intensityIij emitted from some upper level i to levelj is given by:
Iij =AijhνijN nekgi (2.38) whereAij is the Einstein coefficient for spontaneous emission fori→j transition,hνij the elementary energy of light with frequency νij, N is the neutral density, ne is the electron
density andkgi is the rate coefficient of the population of the upper state from the ground level. The population of the upper statei can be done through different channels. For the excitation from the ground state the rate coefficient can be expressed as:
kgi=
(
vσgs(v)f(v)dv (2.39)
wheref(v) is the electron energy distribution function (EEDF) andσgs(v) is the excitation crossection from ground state to upper leveli which depends on the electron temperature. Combining (2.38) and (2.39) a simple equation for light intensity emission can be obtained. It corresponds to a simple model where state i is populated only by collision of electrons and gas atoms in ground states and no excitation from other levels is included. Many publications proposed models [108], [109], [110] for plasma evaluation are based on this simplified approach.
In reality, population of some excited state includes all possible channels of excitation, through metastable and resonant levels and cascading from higher levels. Summarizing the population of statei from all this different channels is not a simple task due to the big number of possibilities and insufficient informations about cross sections (for example see [111]).
2.5 Optical emission spectroscopy 27
Optical cross sections, are strictly connected to the observed transitions and levels from which the excitation are made. It includes all the possible channels for population of the upper level and Einstein coefficients.
Using the optical cross sections the equation for light emission now can be rewritten as:
Iij =hνijne& s
nskijs (2.40)
where ns represent the population of the level s from which the excitation to level i is
made (ground state and metastable states) and ks is the emission rate coefficients for the corresponding level s. The value ks is then defined as:
kijs =
(
vσijs(v)f(v)dv (2.41)
The most common plasma diagnostics based on optical emission spectroscopy (OES) deals with ratio of line intensities as a function of electron temperature. The selection of spectral lines used for this method strongly depends on the type of gas with the general rule to use lines which excitation energies of upper levels that are quite different. A general overview of this method can be found in [114]. There are other methods for plasma diagnos-tics beside OES which are however based on a detailed knowledge of plasma spectroscopy. Some common methods are laser induced fluorescence (LIF) for the evaluation of the num-ber density of the population of states and tunable diode laser absorption spectroscopy for the measurement of the population of metastable levels.
2.5.2
Spectroscopy and Complex Plasmas
There are not many experimental works which use spectroscopy to characterize complex plasmas. In [115] a simple Corona model is used to evaluate changes of the electron temperature due to the particle injection. Recent work [116] used plasma emission changes induced by different sizes of particles to characterize the influence of the dust on discharge properties. The most common quantities estimated by means of plasma spectroscopy are the metastable density by measuring self-absorption of relevant spectra lines propagating through the plasma [20], [117], [118], [119].
plasma. Particle in the discharge, beside disturbing the ionization balance due to the charging, can interact with the plasma light and hence change the background plasma conditions.
Plasma light can interact with the particles by Mie scattering and change the intensity of the escaped light from the discharge [119], [120]. It means that measured light emission emitted from a discharge can not be directly used in the models and a correction for the extinction of light by microparticles is needed [119].
Small wavelength emission in a plasma, specially in the UV and VUV range, have energies high enough to cause a photoemission effect from the particle surface [121]. This mechanism is the dominant dust-charge process on the lunar sunlit environment leading to levitation and transportation of dust on the lunar surface [122], [123]. Similar to this, light can cause photodetachment of electron from the charged particle surface [27] which can also influence particle charge and background plasma.
The measurement of metastable density variations in the presence of particles is pre-sented in a few publications [20], [117], [118], [119]. Depending on the plasma parameters and the size of particles these changes are different. In the case of nanosize grown particles in the plasma an increase of the metastable density is measured [20]. With larger particles introduced in the plasma the metastable density seems to decrease[117] (increase[119]). Non consistent changes in these two cases gives no possibility for building a unique theory which will explain the underlying physics.
Chapter 3
Experimental Setup
There are many different setups for experimental investigations of complex plasmas. For example, in MPE there about 10 different setups built for different experiments in complex plasmas. All these setups are different in size, driven power, pressure range and plenty of other details. The reason for this variety lies in the purpose of the investigation.
3.1
Evolution of the setup: History of Complex
Plas-mas, Different setups, Microgravity experiments
In this chapter, an elementary introduction to the experimental setups relevant for this thesis will be described. The experiments presented in this work are done in two different setups, Plasma Crystal 3 Plus (PK-3 Plus) and Plasma Crystal 4 (PK-4). These two experimental setups are the logical successors of the Plasma Crystal 1 and 2 and PKE Nefedov experimental setups.
PK1 and PK2 were setups designed for complex plasma experiments under micrograv-ity on the Russian Orbital Station MIR. The PKE Nefedov setup was the first scientific experiment done on board of the International Space Station (ISS) from 2001 to 2005. The experimental module consists of an Experimental Block and the so-called Telescience Unit used for controlling and recording the experiment. For more details about this setup see [128]. After 45 successful experiments done with this setup during this time there were plenty of ideas for improvement for its substitute on the ISS: PK-3 Plus.
launched in 2012. This is a fundamentally different setup from all its precursors. In PK-4 a DC or low frequency discharge within a glass tube is dedicated to different investigations, mainly fluid dynamics and fluid properties of complex plasmas.
In parallel to the microgravity modules there are exact copies of the experimental setups on ground used for preparing new experiments. In the next two sections the PK-3 Plus and PK-4 setups for ground-based experiments will be described in more details.
3.2
Plasma Crystal 3 Plus, PK-3 Plus
The PK-3 Plus chamber is a parallel plate rf discharge. The electrodes are round shaped with a diameter of 6 cm made from aluminum. The distance between the electrodes is 3
cm. On both electrodes there is a metal (guard) ring which under ground voltage confines the plasma and hence also the particles in radial direction towards the center of discharge. The discharge reactor is a square vacuum chamber with a size of 10×10 cm2 and a hight
of 5.4 cm. The walls are made of quartz glass with high transparency for visible light. A sketch and cross section of the setup are presented in figure 3.1.
Figure 3.1: Sketch (left) and cross section (right) of the PK-3 Plus experimental setup.
3.2 Plasma Crystal 3 Plus, PK-3 Plus 33
usually pumped for one day to reach high vacuum and to guarantee a clean environment for the experiments. For gas injection gas bottles are connected to the chamber through a system of valves and controllers. During the experiments gas is injected into the chamber in cycles controlled by software in order to avoid gas degradation. Depending on the experimental conditions the usual refreshing cycle interval is a couple of ten seconds. Direct gas injection would result in a disturbance of the particles. Therefore the gas is injected into the dead volume of approximately 1 mm3 and from there diffuses slowly into the
chamber through a small narrow tube.
Particle injection in the chamber is done by particle dispensers. There is the possibility for attaching 6 mechanical particle dispensers with a software controlled intensity and number of shakes. in this way there is the possibility for roughly controlling the number of the particles per injection.
The plasma is ignited by an rf generator (frequency 13.56 MHz) capacitively coupled to the electrodes with maximum power of 4 W. Most of the experiments are run of low power below 1 W. In order to manipulate particles an additional function generator is coupled to the electrodes which can run in DC or AC mode with a maximum output of±50V to each electrode. In AC mode different shapes of the signals can be used (sinusoidal, square...).
In the experiments performed in laboratories the particles sediment to the lower elec-trode due to the gravity force. In order to compensate gravity and arrange the particles to fill the whole chamber, which is essential for many experiments, the thermophoretic force can be used. In order to create a temperature gradient between electrodes a system of resistors and fans is used. Resistors are evenly distributed on the bottom electrode while two small fans are used to cool the top electrode. In this way a temperature difference of about 70◦ K between the electrodes can be achieved.
For particle visualization a system of laser and camera is attached to a holder on the side of the chamber. The particles scatter the laser light which is recorded by camera under the angle of 90 degree. In PK-3 Plus chamber a 532 nm laser of 200 mW power is used, where the beam is spread into a sheet of about 140 µm thickness. In this way the whole vertical cross section of the chamber can be illuminated and recorded with the camera. In order to record fast motion of the particles a CCD camera must be used together with a system of adequate lenses. In this setup for a typical field of view of 30x30 mm2 up
of the illumination laser is attached in order to avoid light from the discharge to interfere with illumination light scattered from the particles. The positioning of the laser/camera holder is done by a software controlled step motor which give the possibility for full space resolved particle observation by scanning through the particle cloud. Using this system allows to achieve very precise 3D reconstruction of the particle cloud in the plasma.
This kind of discharge chamber is suitable for various types of experiments. Most common experiments concerns particle crystallization and melting, temperature induced gas dynamics, waves, self-induced instabilities etc. The possibility to inject large number of particles and fill a large fraction of the chamber is useful for spectroscopic observation of the influence of particles on the plasma parameters [115], [119] .
3.3
Plasma Crystal 4, PK-4
The PK-4 setup contains a different type of chamber compared to all its precursors. The PK-4 type of chamber design is mainly thought for the observation of fluid like properties of complex plasmas. The heart of the setup is ”U” shaped discharge glass tube as sketched in figure 3.2. The tube is overall 750 mm long with 30 mm inner diameter and DC electrodes on both sides. The main experimental part of the tube, the positive column of the discharge is 350 mm long with flat windows at the sides for optical illumination. The system is mounted on a vertical plate with the possibility of changing the orientation with respect to gravity from vertical to horizontal, depending on the needs of the experiments.
Camera Dust
Dispenser (1 of 4)
Anode Cathode
3cm
35cm Vacuum
Glass Tube Gas
vd
Dust Particles
E
RF Coil (1 of 2) Laser
Illumination Sheet
Laser Manipulation
3.3 Plasma Crystal 4, PK-4 35
One end of the discharge tube is connected to a system of vacuum pumps, pressure controllers and valves while the other end to a system for gas injection through the flow controller as it is shown in figure 3.2. The evacuation of the tube is done by two pumps. Pre-vacuum of about 5 mbar is created by a membrane pump while higher vacuum about 10−5 mbar is reached by a turbo-molecular pump. To ensure stable plasma conditions
over longer time of the discharge, the plasma can be refreshed by continuous gas flow. In vertical configuration continuous gas flow can be used also for particle levitation and manipulation.
This system was first developed as a pure DC discharge. Later on the power supply was upgraded with few additional possibilities. In the latest configuration the plasma can be created as pure DC or low frequency discharge (polarity switching) up to a few kHz. In the polarity switching mode one of the electrode is grounded and the other changes the sign of the voltage with an adjustable frequency. The polarity switching duty cycle can be changed in order to create a net electric field in the plasma. The discharge is current limited with a maximum of 3mA. The voltage difference on the electrodes depends mainly on the pressure and can be from a couple of hundreds volts to about 3 kV. In addition to the main power supply the plasma can be created locally by an rf coil mounted around the tube. This provides the possibility to create a plasma using both DC (or low frequency) and rf combination. The rf mode can be run with a frequency of 13.56 MHz or 81.36 MHz. The discharge tube is designed with the possibility to attach 6 particle dispensers. The intensity and number of shakes can be controlled which ensures a rough control of number of particles injected with each shake.
This configuration of the discharge is suitable for different types of manipulation of the particles. For example, the previous mentioned rf coil can be used for particle trapping. Thermophoretic force can be easily obtained by using a heating coil around the tube. Creating a temperature gradient can lead to additional gas convection inside the discharge which lead to particle motion (see below section 4.2.). Also it is possible to integrate additional electrodes in the tube and to push or attract particles by applying a voltage to it. Particle manipulation can be done also by using a manipulation laser introduced along the tube or from the side in radial direction. For this purpose a 20 W infrared diode laser is installed.
the illumination of the particles along the whole positive column. For these purpose a small power 10 mW red (683 nm) laser spread into a sheet is used. The thickness of the laser sheet is about 150 µm. The camera is attached to the same holder perpendicular to the laser with the possibility to move it along the whole main part of the tube. The frequency of recording with a typical 30x30 mm2 field of view is 60 frames per second. The
whole holder can be moved precisely manually or by step motor. Using the step motor with an adjustable velocity is suitable for 3D scanning of the particle cloud. In this way a 3D reconstruction of the particle positions and velocity distributions can be done [58] (see sect. 4.1.).