Impaired repression at a vasopressin promoter polymorphism
in a rat model of trait anxiety and depression
Dissertation
der Fakultät für Biologie der
Ludwig-Maximilians-Universität zu München
Christopher A. Murgatroyd
Mit Genehmigung der der Fakultät für Biologie der
Ludwig-Maximilians-Universität zu München
Berichterstatter: Prof. Dr. R. Landgraf
Mitberichterstatter:
Prüfungskommission: Prof. Dr. E. H. Weiss
Prof. Dr. C. N. David
Prof. Dr. B. Grothe
Weitere Mitglieder: Prof. Dr. M. Götz
Prof. Dr. R. Klein
Mitbetreuung durch den
promovierten Mitarbeiter: Dr. Dietmar Spengler
Dekan: Prof. Dr. Peter Dittrich
Impaired repression at a vasopressin promoter polymorphism
in a rat model of trait anxiety and depression
CHRISTOPHER A. MURGATROYD
Max-Planck-Institut für Psychiatrie Kraepelinstr. 2-10
80804 München
CONTENTS
1 INTRODUCTION ... 1
1.1 HAB and LAB rats ... 1
1.1.2 Behaviour ... 2
1.1.3 Neuroendocrinology... 3
1.1.4 AVP status... 4
1.2 HAB and LAB mice... 7
1.2.1 Behaviour ... 7
1.2.2 Neuroendocrinology... 7
1.2.3 AVP status... 8
1.3 Human affective disorders... 9
1.3.1 Neuroendocrinology... 10
1.3.2 AVP status... 10
2 MATERIALS AND METHODS... 12
2.1 Materials ... 12
2.1.1 Chemicals... 12
2.1.2 Radiation ... 13
2.1.3 Restriction endonucleases ... 13
2.1.4 Modifying enzymes... 14
2.1.5 Antibodies ... 14
2.1.6 Vectors ... 14
2.1.7 Plastics... 15
2.1.8 Molecular biology kits ... 15
2.1.9 Cell lines... 15
2.1.10 Primer sequences... 15
2.1.11 Sequences and accession numbers ... 17
2.2 Methods ... 18
2.2.1 DNA Analysis ... 18
2.2.2 RNA analysis... 23
2.2.3 Plasmids ... 28
2.2.4 Cell culture and transfection experiments... 34
2.2.5 Protein preparation ... 36
2.2.6 Statistical analysis and computer software... 41
3 RESULTS... 42
3.1 Candidate gene approach ... 43
3.1.1 CRH... 44
3.2 AVP... 44
3.2.1 AVP levels in the PVN correlate with anxiety-related behaviour ... 45
3.2.3 Sequence and genotyping of the adjacent oxytocin gene... 50
3.2.4 Association of AVP gene and anxiety in EPM test... 51
3.2.5 Genotyping HAB AVP allele in an outbred population... 54
3.2.6 In vivo tanscription analysis ... 55
3.2.7 Transcription factor element analysis ... 58
3.2.8 C(-592)T and cAMP responsive element... 59
3.2.9 A(-1276)G and YY1... 59
3.2.10 A(-1276)G and CArG box binding factor A (CBF-A)... 65
3.2.11 Reporter assays... 73
3.2.12 CBF-A expression in the PVN ... 77
3.2.13 Model for the polymorphic CArG element leading to differential AVP expression... 81
3.3 Genetic analysis of HAB and LAB mice lines... 82
3.3.1 Marker analysis of mouse chromosome 2... 82
3.3.2 AVP... 83
3.4 Human AVP gene as a candidate gene for anxiety ... 89
3.4.1 Sequence analysis... 89
3.4.2 C(-229)T promoter SNP... 90
3.4.3 G(-558)T downstream SNP... 91
4 DISCUSSION ... 93
4.1 HAB rat ... 93
4.2 HAB mouse ... 98
4.3 LAB mouse... 98
5 SUMMARY... 100
6 ABBREVIATIONS ... 102
6.1 Standard... 102
6.2 Buffers and substances... 102
6.3 Non standard ... 102
7 REFERENCE LIST ... 104
8 ACKNOWLEDGMENTS ... 121
1 Introduction
Anxiety disorders and major depression represent two of the most common and debilitating psychiatric disorders. Epidemiological studies show that anxiety disorders – including panic disorder, phobic disorders and generalised anxiety - can run in families (Hettema et al., 2001). Moreover, twin studies suggest that a genetic predisposition accounts for, at least, part of the familial nature of the disorders, with heritibilities of 30-40% (Kendler, 2001). However, despite decades of intensive research, the underlying genetic cause(s) of these remain elusive (Nestler et al., 2002). Functional studies have yet to identify a focal brain region or particular neurotransmitter system as the primary site of the abnormality and, furthermore, genetic studies have failed to provide evidence for specific culpability genes (Segurado et al., 2003) and allelic variations showing replicable associations in the general population (Lohmueller et al., 2003).
Current research lines in this field include identification of candidate genes in selectively bred animal models. The concept implies that, in these animal models, specific loci associating with a phenotype provide compelling candidate genes for complex human disorders. Indeed, recent animal studies have investigated the concordance of disease associating genes across species. For instance, in the case of hypertension, a remarkable degree of concordance of quantitative trait loci (QTL) regions in comparison of mouse with rat and human is beginning to emerge (DiPetrillo et al., 2004).
To gain insight into the molecular mechanisms underlying affective disorders, animal models were generated by selectively breeding Wistar rat lines for either high (HAB) or low (LAB) anxiety-related behaviour. This approach was followed up in mice also bred for either high or low anxiety-related behaviour. This concept of selectional inbreeding is postulated to concentrate loci playing major roles in the selected phenotype. In turn, the results from these two animal studies then provide a basis for extrapolating these findings to association studies in humans.
1.1 HAB and LAB rats
be objectively monitored, (c) the behavioural changes observed should be reversed by the same treatment modalities that are effective in humans, and (d) the system should be reproducible between investigators. Taking these guidelines into consideration, it is proposed that the HAB rat represents a robust and unique model for human anxiety.
1.1.2 Behaviour
Ten-week old Wistar rats were selected for inbreeding using behavioural results from the elevated plus-maze (EPM) test. The EPM test is the most widely used apparatus for measuring anxiety in rodents (Pellow et al., 1985). The test is performed by placing a naive rat in the centre of an elevated plus-maze with two open and two enclosed arms, and allowing it to freely explore. It is accepted that the reluctance of rats to explore the open arms of the maze is caused by fear of open spaces. Furthermore, anxiolytic compounds increase, whereas anxiogenic compounds decrease, the percentage of time spent on open the arms (Pellow et al., 1985). The results from the EPM test were used to select mating pairs to establish the HAB and LAB lines. To date, HAB rats of both sexes spend less time in the open arms of the maze and enter this area less frequently. Specifically, HAB animals spend around 5% of the total time on the EPM test in the open arms compared to 50% in LAB animals.
The high anxiety phenotype in the HAB rats is not only detectable in the EPM test, but also in the open field, the modified hole board and in other tests of unconditioned anxiety such as the black and white box and the social interaction test (for a review see Henniger et al., 2000;Wigger et al., 2001). Furthermore, in a social defeat paradigm, HAB and LAB rats differed significantly in their coping behaviour - HAB rats emitting more ultrasound vocalisation calls and spending more time freezing in contrast to the LAB rats which showed increased locomotor activity and signs of aggressive behaviour towards a resident animal indicative of active stress coping (Koolhaas et al., 1999). Measuring ultrasound vocalisation in the rat pups revealed that the HAB rats vocalized significantly more than LAB animals (Wigger et al., 2001). This confirms, not only the early expression of the trait in the HAB rats development, but also of anxiety-related behaviour independent of locomotor activity (Tornatzky and Miczek, 1994).
anxiety-related behaviour is independent of gender. It is of further importance to note that basal blood pressure and heart rate failed to differ between HAB and LAB rats.
In addition to the innate anxiety, HAB rats also present with a depression-like behaviour showing remarkably passive stress coping in the forced swim (FS) test (Keck et al., 2001). The FS test (Porsolt et al., 1977), which is considered to have predictive value for the efficacy of antidepressant treatments (Lucki, 1997), revealed that HAB rats floated much more and struggled far less than LAB animals. This preference of passive coping, in addition to the behavioural despair, is interesting when considering that anxiety and depression share many overlapping symptoms, often co-existing, in the clinic (for review see Gorwood, 2004).
The possibility of a genetic contribution or determinant underlying the anxiety-like behaviour was tested in the HAB line by examining the influence of postnatal factors in the divergent emotionality of HAB and LAB rats. In a cross-fostering experiment animals were reared, from the first postnatal day until weaning, by mothers of the opposite rat line and behaviourally characterized as adults. From this study it emerged that none of the anxiety parameters revealed variances between fostered controls and cross-fostered animals within either line (Wigger et al., 2001). Additionally, HAB mothers showed no deficits in their maternal behaviour making it highly unlikely that environmental factors (Meaney, 2001), or epigenetic programming stemming from maternal behaviour (Weaver et al., 2004) may contribute to the line-specific divergences detectable in the adults. Moreover, cross-breeding of HAB and LAB rats resulted in F1 offspring displaying intermediate anxiety-related behaviour on the EPM test, perhaps again supporting a role of genetic factors in the behavioural differences between HAB and LAB rats (Wigger et al., 2001).
1.1.3 Neuroendocrinology
are not decreased then the subject is said to suffer from DEX non-suppression. A further improvement on this test is the combined DEX/CRH challenge test in which the HPA axis is both stimulated by the administration of CRH and inhibited with DEX (Holsboer et al., 1987), resulting in a far greater sensitivity (for review see Heuser et al., 1994). When the DEX/CRH test was performed in the two rat lines it became evident that HAB rats were DEX non-suppressers (Keck et al., 2002). It was further speculated by the authors that this phenomenon pointed towards an enhanced activity and critical involvement of the neuropeptide AVP, which was supported by the observation of increased basal synthesis and release of AVP within the paraventricular nucleus (PVN) of the hypothalamus in the HAB rats, as described in more detail below.
Anxiolytic and antidepressive drugs generally yield contradictory results when administered to normal rats indicating that - in parallel to the situation in humans - the efficacy of an anxiolytic may depend on the animal's basal level of anxiety (Liebsch et al., 1998;Will et al., 2003). Indeed, HAB rats responded to diazepam with a 20-fold increase in the percentage of time spent on the open arms of the EPM test, in contrast to a 2.5-fold increase in LAB rats (Liebsch et al., 1998). Of further note, diazepam functions in the rat by stimulating basal HPA axis activity (Vargas et al., 2001). As previously stated, the behaviour of the HAB rats is indicative, not only of anxiety-related, but also depression-like symptoms and accordingly responded to, the classical antidepressive selective serotonin re-uptake inhibitor (SSRI), paroxetine, with a more active stress-coping strategy in the FS test, in contrast to the LAB rats which failed to respond (Keck et al., 2003). Similarly to diazepam, paroxetine again attenuates HPA axis overactivity (Nickel et al., 2003).
As previously described, the HAB rats are DEX non-suppressors, however, periferal administration of the AVP V1-receptor antagonist d(CH2)5Tyr(Me)AVP in HABs, resulted in
a reduced level of anxiety/ depression-related behaviour (Keck et al., 2002). This indicates that AVP has major effects in both the neuroendocrine system and in the anxiety-related behaviour.
1.1.4 AVP status
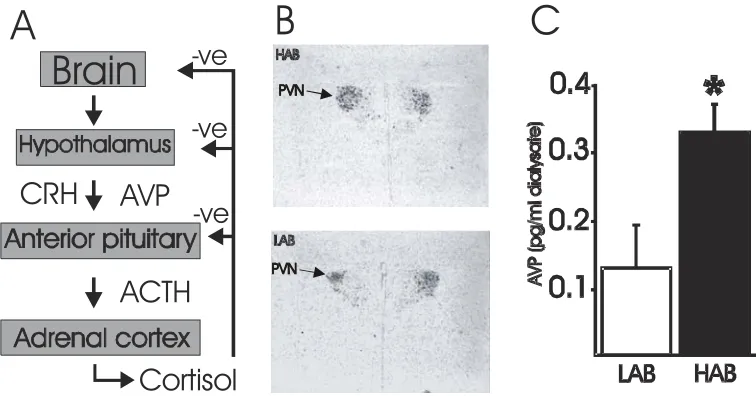
CRH and AVP are the main regulators of the HPA stress system; being released from the hypothalamic parvocellular neurons of the PVN. In situ-hybridisation analysis of the
found to be significantly higher in the parvocellular and magnocellular neurons of the PVN of HAB rats under both basal and stress conditions (figure 1B) (Wigger et al., 2004). Furthermore, the HAB rats presented with a significantly higher AVP release from the PVN in microdialysate experiments (figure 1C) (Wigger et al., 2004).
A
B
C
Brain
CRH
AVP
Cortisol
ACTH
-ve
-ve
-ve
Figure 1. Scheme of HPA axis and differential AVP expression between HAB and LAB animals. (A) Schematic diagram of the HPA axis. (B) in situ-hybridisation experiments using a radiolabelled AVP mRNA-specific oligonucleotide in the PVN (Wigger et al., 2004) reveal an increase in expression of AVP mRNA in the HAB rat line. (C) Microdialysate measurement of AVP peptide in the PVN reveal a significant increase in AVP peptide release from the PVN in the HAB line rats. *, Significantly different (p<0.05).
Measurements of oxytocin - the structurally and functionally related neuropeptide - failed to reveal differences between the HAB and LAB rats in either mRNA or protein content in the PVN or release in the dialysate. When comparing the levels of AVP between the various AVP-containing hypothalamic nuclei strict tissue-specificity emerged whereby AVP overexpression occurred only in the parvocellular and magnocellular neurons of the PVN, whereas no elevations were present in other AVP expressing nuclei in the hypothalamus, namely the supraoptic nucleus (SON) and the suprachiasmatic nucleus (SCN).
mechanism underlying the anxiety in our rat lines, we decided to investigate the AVP locus as a candidate gene for anxiety and depression.
The structures of AVP and oxytocin were determined by du Vigneaud in 1954, and earned him the nobel prize in 1955 (du Vigneaud, 1954). AVP is a cyclic nonapeptide that is synthesised centrally in the hypothalamus. The peptide is released in response to a variety of stimuli including increasing plasma osmolarity, hypovolaemia, hypotension and hypoglycaemia (Dunn et al., 1973;Laszlo et al., 1991) and has powerful antidiuretic and vasoconstrictor effects (Hofbauer et al., 1984). AVP has also been implicated in learning and memory (Engelmann et al., 1996), however, it is the role of AVP in the regulation of the HPA axis that forms the main focus of this study (for review see Scott and Dinan, 2002;Gazdar et al., 1980;Landgraf, 2001). Although the cell-specific expression and physiological regulation of the AVP gene has been described in some detail (for review see Burbach, 2002), much less is known about the regulatory elements and transcription factors bound within the promoter that control these processes. The AVP promoter is positively regulated by the cAMP signalling pathway (Verbeeck et al., 1990), and two cAMP responsive elements (CRE) have been identified at -227 to -220bp and -123 to -116bp in the rat promoter (Iwasaki et al., 1997). Furthermore, an AP1 site has also been identified in the rat promoter (Grace et al., 1999), although its functional role in AVP expression remains to be established (Coulson et al., 1999b). A number of E-box motifs localise to the region -157 to -23bp, which are predicted to be bound by members of the basic helix-loop-helix (bHLH) transcription factor family. Among these Clock, Bmal1, Sim1 and Arnt2 behave as transactivators, involved in controlling either circadian rhythm or neuronal development (for review see Burbach, 2002). Expression of the AVP gene is suppressed by adrenal glucocorticoids through a putative glucocorticoid response element (GRE) which maps to -622 to -608bp in the rat promoter (Iwasaki et al., 1997). Both GR-DNA dependent and independent mechanisms for repression have been assigned to this element (Kim et al., 2001). In addition, AVP gene expression also appears to be regulated by other members of the nuclear hormone receptor family, notably by androgen (Adan and Burbach, 1992) and oestrogen receptors (Shapiro et al., 2000).
In this study we sought to examine the molecular mechanisms underlying the differential expression and release of AVP in the PVN of HAB and LAB lines. We show that the promoter of the AVP gene in the HAB animal, containing a number of SNPs, works in cis
to produce higher levels of AVP. In this promoter region we discovered that the disruption of a CArG element in the HAB rat, located 1276bp upstream from the AVP start codon, plays a major role in this promoter overexpression by disrupting the binding of CBF-A which, in turn, acts as a repressor for AVP expression. We, therefore, conclude that constitutive overexpression of AVP in the PVN of HAB rats is critically dependent on the HAB allele. The relevance of AVP to the anxiety-related behaviour was further investigated in an association study involving the F2 offspring from a HAB/LAB and HAB/outbred cross, which supported a possible involvement of the AVP gene in controlling behaviour on the EPM and FS tests. Therefore, we speculate that this allele might contribute to the behavioural and endocrine correlates of trait anxiety and depression in this rat line.
1.2 HAB and LAB mice
Above findings prompted us to examine, in addition, the relevance of AVP as a candidate gene for anxiety in other mammals. Therefore, to address this topic, mice have recently been subjected to selective bi-directional inbreeding on the EPM test for either high (HAB) or low (LAB) anxiety-related behaviour. In this protocol ‘outbred’ CD1 mice were employed on the basis that a population of outbred animals should display a higher degree of variance in behaviour, which might facilitate the bi-directional selective inbreeding strategy (Kroemer et al., submitted).
1.2.1 Behaviour
Within a few rounds of selective inbreeding, HAB and LAB mice lines - in a similar fashion to the rats - differed markedly and consistently in their anxiety-like behaviour on the EPM test. In addition to this deficit in emotionality, the HAB mice were also impaired in their stress coping, depression-like, behaviour in the FS test, resembling again the aforementioned HAB rat line. Results of the tail suspension (TS) test which, similarly to the EPM test, also measures behavioural despair (Chermat et al., 1986), again support the presence of a passive stress coping behaviour in the HAB mice.
1.2.2 Neuroendocrinology
Therefore, HPA axis functioning in these animals has yet to be characterised. The behavioural responses to antidepressant and anxiolytic drugs in the HAB mice appeared to differ from the HAB rat line because HAB mice revealed no responses to paroxetine, and, furthermore, administration of the benzodiazepine diazepam resulted in no anxiolytic effects (Landgraf R, unpublished data). The HAB mice did, however, react mildly to imipramine (Landgraf R, unpublished data), which is a tricyclic antidepressant whose mechanism of action, in contrary to paroxetine and diazepam, is thought to involve the transmitter-uptake mechanism of monoaminergic neurons (Mongeau et al., 1997).
1.2.3 AVP status
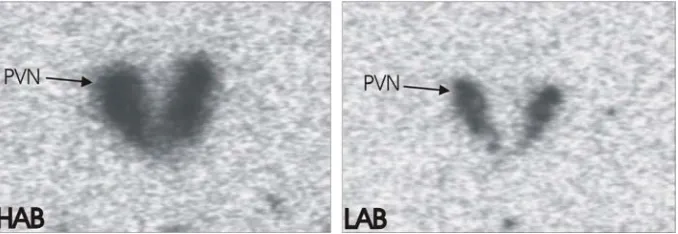
The most striking feature of the mice lines, in the context of this study, was the finding that AVP mRNA expression, as well as release of the neuropeptide, are higher in the PVN of HAB mice when compared to LAB mice (figure 2) (Landgraf R, unpublished data).
Figure 2. In situ-hybridisation experiments for AVP mRNA in the PVN of HAB and LAB mice reveal a 3 to 4-fold increase in expression in the HAB line mice (Landgraf R, unpublished data).
and HAB mice in a similar way to that seen in the anxious rat line. Furthermore, it is possible that the conserved amino acid change in the signal peptide might play a role in AVP post-translational regulation by altering the processing and release of AVP. In this respect it was of further interest to note that subsequent metabolic studies in the LAB mice revealed a defect in their osmotic regulation, being acutely prone to a hyperosmotic challenge (Landgraf R, unpublished data). This supports the theory that this altered signal peptide leads to the observed reduction in AVP, resulting in a diabetes insipidus (DI) -related phenotype.
1.3 Human affective disorders
The impact of depression and anxiety disorders worldwide is overwhelming (figure 3). The World Bank report on the global burden of disease ranked major depression fourth among all medical illnesses in terms of its disabling impact on the world population (Murray and Lopez, 1996) It was further estimated that, by the year 2020, depression would be second only to ischemic heart disease with anxiety disorders ranking close behind (for review see Hirschfeld, 2001). Indeed, between 10% and 20% of adults in any given 12-month period will visit their primary care physician during an episode of mental illness (Kirmayer et al., 1993).
Figure 3. Prevalence of major depression and anxiety disorders in the community. Adopted from (Kessler et al., 1994;Kessler et al., 1995). Values based on 12-month comorbid prevalence data. GAD= generalized anxiety disorder, PTSD= posttraumatic stress disorder.
1.3.1 Neuroendocrinology
Disturbances in HPA axis regulation seem to play a profound role in the development, course and remission of major depression and affective disorder. Patient studies consistently evidence a close correlation between a stable remission of the clinical symptoms and a normalization of HPA regulation (for review see Holsboer, 2003). Furthermore, the finding that healthy probands, witha family history of mood disorder, show abnormalities on the Dex/CRH test (Holsboer et al., 1995), supports the theory that culpability genes can contribute to the development of mood disorders via HPA axis function.
1.3.2 AVP status
genetic variations in the AVPR1b gene, associated in patients with affective disorders (van West et al., 2004).
2
Materials and Methods
2.1 Materials
2.1.1 Chemicals
Consumable Supplier Consumable Supplier
1kb ladder Fermentas 3MM-Papier Wattman
Agar GibcoBRL Agarose (low-melting point) Gibco Agarose (peqGOLDuniversal) Peqlab (Erlangen) Ammoniumperoxodisuphate Sigma
Ampicillin Roth Antibiotic/antimycotic Gibco
Boric acid Biomol Bovine serum Invitrogen
Bradford assay Biorad Bromophenol blue Biorad
BSA Sigma Chloroform Roth
Chloroform (RNase free) Merck Coomasie blue Biorad Developing emulsion (slides) Kodak Developing solution (film) Kodak
Developing solution (slides) Kodak DMSO Sigma
DNA marker (1kb) NEB DNA marker λ/ HindIII GibcoBRL
dNTPs (set of 4) Fermentas DTT Sigma
DMEM (-Na.pyruvate) Gibco EDTA Sigma
Ethanol Merck Ethidiumbromide Biomol
Ficoll 400 Sigma Fixing solution (films) Kodak
Fixing solution (slides) Kodak Foetal bovine serum Gibco
Formaldehyde Merck Formamide Sigma
L-Glutathione reduced Sigma Glutathionine Sepharose Amersham
Glycerine Sigma Glycerol Biomol
Glycine Biomol Glycogen Fermentas
Guanidine thiocyanate Merck IGEPAL Sigma
IPTG Fermentas Isoamylalkohol Merck
β-mercaptoethanol Merck Methanol Merck
Milk powder Regilait (France) MOPS Sigma
Nitrocellulose film BA-S85 Schleicher&Schuell N-lauroyl-sacosine Sigma Oligonucleotides MWG /Invitrogen Optimem1 medium Gibco
Paraformaldehyde Sigma PBS Gibco
Phenol Appligene Phenol pH 7.5 Appligene
Ponceau Sigma 2-propanol Merck
2-propanol (RNase free) Merck Protein marker NEB Poly(d(I-C)) Roche Polaroid instant film Polaroid Polyacrylamide–rotiphorese 30 Roth Polyacrylamide –rotiphorese 40 Roth
RPMI 1640 (+L-glutamine) Gibco Salmon testes DNA Sigma
Sarcosyl Sigma SDS Biomol
Siliconising fluid Sigma Sodium acetate Merck
Sodium chloride Merck Streptavidin Agarose Novagen
Taurine USB (USA) TEMED Sigma
Toluidine blue Sigma Transfer Ribonucleic acid Sigma
Tris Riedel-deHaen Triton X-100 Roth
Trypsin Gibco Tryptone Roth
Urea Roth Ultima Gold Packard
X-Gal Sigma X-ray film (Biomax) Kodak
Xylencyanol Chroma-gesellschaft Yeast extract GibcoBRL
2.1.2 Radiation
Nucleotide Activity Supplier
35S-thio-rUTP 12.5 mCi/mM NEN
(35S)UTP-αS 10mCi/ml Hartmann Analytica
32P αdCTP 1x9,25 MBq Amersham
α-33P dATP 1x9,25 MBq / 1x250µCi Amersham (33P)ddNTPs) Redivue (set of 4) 10mCi/ml Amersham
γ32P-ATP 1x9,25 MBq Amersham
2.1.3 Restriction endonucleases
Enzyme Supplier Enzyme Supplier Enzyme Supplier
AciI NEB BbvI NEB BsmAI NEB
DraIII NEB BamHI Fermentas EcoRI Fermentas
EcoRV Fermentas EamI1041(Ksp6321) Fermentas HindIll Fermentas
KpnI Fermentas HaeIII NEB HincII NEB
NlaIII NEB Pvul Fermentas MaeIII NEB
MseI NEB Sacl Fermentas SfaNI NEB
SmaI Fermentas Sphl Fermentas Tth1III NEB
2.1.4 Modifying enzymes
Enzyme Supplier Enzyme Supplier
T3-RNA polymerase Roche T4-DNA-Ligase Roche
T4 DNA polymerase Fermentas T4 polynucleotide kinase Fermentas
T7-RNA polymerase Fermentas CIAP Fermentas
DNA pol. I, klenow fagment NEB DNA polymerase (Taq.) Fermentas
DNA polymerase(Pfu) Fermentas DNaseI Fermentas
Proteinase K Boehringer Manheim Proteinase K (RNase free) Sigma
Ribonuclease A Sigma RNase Sigma
RNase inhibitor Fermentas S1 Nuclease Amersham
Streptokinase Sigma
2.1.5 Antibodies
2.1.5.1 Primary antibodies
Antibody Epitope Host Supplier
YY1 (H-10)X full length human YY1(monoclonal) Mouse Santa Cruz
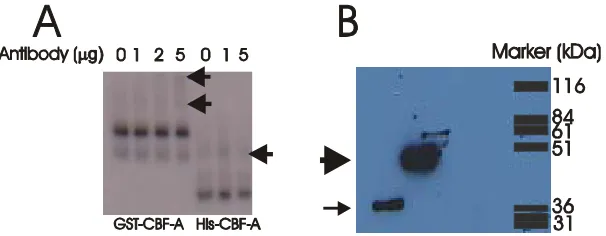
α-N-CBF-A 1st 75aa mouse CBF-A (polyclonal) Rabbit gift Leanderson et al. Anti-GST Shistosomal GST (polyclonal) Goat Pharmacia
Anti-Flag M2 (monoclonal) Mouse Sigma
Anti-His His6 (monoclonal) Mouse Roche
2.1.5.2 Secondary antibodies
Antibody Epitope Host Supplier
Anti-rabbit rabbit IgG Goat Perbio
Anti-goat goat IgG Donkey Santa Cruz
Anti-mouse mouse IgG Goat Santa Cruz
2.1.6 Vectors
Vector Supplier
2.1.7 Plastics
Consumable Supplier Consumable Supplier Consumable Supplier
Filtertips Sarstedt PCR plates/caps (96) ABgene Cell culture plates Greiner Pipette tips Sarstedt Scalpels Merck Micro test plates Greiner Cuvette 1mm Biorad X-ray cassette Kodak Gel chambers Biorad
2.1.8 Molecular biology kits
Consumable Supplier Consumable Supplier
Chemagenic DNA tissue Chemagen Chemagenic stand 2x12 Chemagen NucleoSpin Tissue Macherey Nagel NucleoSpin plasmid quickprep Macherey Nagel
DNAeasy extraction kit Qiagen RNeasy Qiagen
Thermosequ. Radio. Term. cycle sequencing
USB Thermosequ. (33P) Term. cycle sequencing
Amersham
ExoSAP-IT USB Lumi-light Western blotting substrate Roche LipofectamineTM Invitrogen OneStep RT-PCR Qiagen Picogreen DNA
quantification reagent
Molecular probes GeneRacer superscriptII and zero blunt TOPO cloning
Invitrogen
Bio-spin 6 columns Biorad silver stain kit SIGMA
2.1.9 Cell lines
Name Derived tissue Morphology Supplier Reference
Saos-2 prim. Osteosarcoma epithelial DSMZ (Fogh et al., 1977) Neuro2a murine neuroblastoma neuronal ATCC (Klebe RJ, 1969) Lu-165 small cell lung can. SSLC Terasaki. T (Terasaki et al., 1994) HeLa cerv.epith.adenocarcin. epithelial ATCC (Scherer, 1954) 3T3 murine embryo fibroblast ATCC (Todaro, 1963)
2.1.10 Primer sequences
2.1.10.1 SSCP primer pairs
Rat CRF 1f, tca gta tgt ttt cca cac ttg gat; 1r, cga ccc tct tca gaa agc ac; 2f, tat tag gca aat gct gcg tg; 2r, agc tca ggc agc aca aag tt; 3f, cca agg gag gag aag gta gg; 3r, gcg ggt atg gga cac aat aa; 4f, tca atc caa tct
gcc act ca; 4r, aaa gct cat atg gtg cga gc; 5f, cgg cga ata gct taa acc tg; 5r, aag gtg ggg gag aga ggt aa; 6f, agg
8f, gga gag gga gag gcg gtc; 8r, ttg tgc atg cta att aag ggg; 9f, gaa gat gta cag gga gag agc c; 9r, cca aat tga cca
agg atc aga; 10f, agg ggt ggc tag gac aaa at; 10r, gga caa att gca ggg cta gt.
Rat AVP 1f, tca atg cca gct ttc tgc ta; 1r, agt cct agg tga gcc cac ag; 2f, ata gta cca gcc tca ggg ca; 2r, gcc aca gtc atg gag tca ag; 3f, gca tgt gtc aca act gtc ctt t; 3r, tga gca ttt cag cag ctc tc; 4f, gca gac ctg cta gtc
ctt gg; 4r, gct gtc agc agt gat tca gg; 5f, gat tgc aca gca cca atc ac; 5r, agc atc atg gcg agc ata g.
Rat Oxytocin 1f, ctc ctt gag gag aag gct ga; 1r, ggt tgg tcc act ttg gta cg; 2f, aag ggg tgg gca act aga
ac; 2r, ttg acc tgg gac tgt ctg tg; 3f, gtg agt tca agc cca gcc ta; 3r, cat ctc agg gct gga gaa ct; 4f, gca aga gca act
caa cca c; 4r, tgg tct aca gac cta gtt c; 5f, gtc ttc ctg cca tgg ttt gt; 5r, tgc tgg gaa caa aat tca ga; 6f, ggg gag atg
gct taa tgg tt; 6r, tgc atg gga aga atg cta ca; 7f, cac aca cta ggc agg cag tc; 7r, gct ggc ctt gaa ctc aca gt; 8f, agc
tga tgg cct gtg ttt tc; 8r, ggc tca gtg gtt agg agc ac; 9f, agg gcc ttt ggt aga gca gt; 9r, atg agg ttg gat agc gca ag.
2.1.10.2 Sequencing primers
Rat AVP 1f, cgg gcg ctc tag agg atc; 1r, aag gta gtg gtg cac tat cag; 2f,gac tgg agt cct cac acc; 2r, atg tac
aga tat aca tgc aaa c; 3f, tgc cac cat cat cag gct g; 3r, tga gtc cat tcc ttt gtc tc; 4f, gta atc cca gca gac atg tg; 4r, ggc agc ttc cac cag att g; 5f, gga gtt aaa cta tgt taa atc ag; 5r, atc aca tcc act aga gct ttg; 6f, gca cac agg cag
cat ggc; 6r, ttc taa ggc agt cgt tta gtc; 7f, cta tgt agt aag gtc aag gtc; 7r, cca ccg cca cag tga ttg; 8f, ctc acc tcc ctg
att gca c; 8r, tga taa gta tct ctc att ttc tg; 9f, gcc aca taa agg aca gtg tc; 9r, tca gag act tac ctc tcc g; 10f, gga cat
gcc act caa ggg; 10r, tac agg cgt gca tca ccg; 11f, aat act cta gga aga aga caa; 11r, gaa aca gct tcc ttg gtc a; 12f, gac aca gtg tgc ctc tat g, 12r, gct ctc ctg gac ctt ctg; 13f, gtt agc agc cac gtt gtc; 13r, aca tac aat aca gat ctg; 14f, cca tgc cca agt gga gc; 14r, gct gga acg agg cca ag; 15f, cca gca acg caa agc agc; 15r, aat aga gac aga cac
cag g.
Rat Oxytocin 1f, aac gga tct gtg att cag gg; 1r, cct agg ttt gat tcc cag ca; 2f, cac tgg aac tgg gat aag t; 2r, ccc
cag gag ctg tca tta aa; 3f, aat caa gga gct ggg gag at; 3r, gat gcc ctc ttc tgg tgt gt; 4f, tga tgg cct gtg ttt tct ca; 4r, gag ctc aaa agg gac aca gc; 5f, tag aag aag ggc tga gct gc; 5r, agg gga tgc tct ctg aag gt; 6f, ctt ggc cta ctg gct
ctg ac; 6r, atc atc aca aag cag ggc tc.
Mouse AVP 1f, cta gaa gcc gtg ggc tag gt; 1r, ggg gag agc ttg gga ata gtg; 2f, cat tgc cac cat agc ttt cc; 2r, gtt agc agc cac gtt gtc; 3f, caa gag aag gga cac cat ag; 3r, ttc cttt ggt cag aag aaa cct; 4f, att tct gct cga cct cag
ag; 4r, act ctg tgc tct cct gga c; 5f, atc gcc aga gca cca gca ac; 5r, cac ccc aga aat aga gac ag.
Human AVP 1f 5’, tgg cct gag tat agg agg c; 1r 5’, aag gga cac aga at gaga g; 2f 5’, gtg tca tgt ctt gca
ctt tc; 2r5’, cag ttc tgg aag tag cac g; 3f 3’; cca gtc atc cgc agc ccg a, 3r 3’; ttt gtg ttt cag tct cct g, 4f 3’; cac tta
gtc tgt aac gtg a, 4r 3’; gag gcg aga gca gag tg.
Mouse chromosome 2 markers 1f, ccc aag gtt cat aat gaa ttc c; 1r, agc agg tct caa tgc cag g; 2f, aat
gga aag cta agc acc tac; 2r, gag ggc ttc act gca tgt g; 3f, ctc ctc cac ttg cat gca ac; 3r, cct ggg aga aac atg agg ag; 4f, tga gga gct gtc aca tta gg; 4r, ctc aac att taa tca ctt ctc c; 5f, ctg tcc tgc att agc tgt ctg; 5r, act gat gtg gcc aca
gtc c; 6f, ggc ttt aat gtc agt caa acc; 6r, gaa gaa ctt gtg tgg aaa gag; 7f, acc aac att caa agt cct tgg; 7r, gac atg gtg
gat gga taa cag; 8f, aac caa cag aaa gag aag agc; 8r, taa agg ctt gtt cta cca ctg; 9f, gtt gtc aag agt gga gat gga c; 9r, cct gac aca aga cca gtg ag; 10f, cac cca gcg agt atg tca tc; 10r, aaa cat atc tgc agg atg aat g; 11f, tcg agg tcc
pBSKII vector T7, gta ata cga ctc act ata ggg c; T3, aat taa ccc tca cta aag gg; M13 forward, gta aaa
cga cgg cca gt; M13 reverse, gga aac agc tat gac cat g.
pGL2 UPS, ctt atg gta ctg taa ctg; DS, gat aga atg gcg ccg ggc c.
2.1.10.3 In vivo transcription assay primers
Rat AVP f, ccg aca tgg agc tga gac; r, tga gcc tag tga ctg gat tcc c.
Rat oxytocin f, atc tcg gac tga aca cca acg c; r, ctg tgc aca atc cat atc ggg ac.
2.1.10.4 RFLP primer pairs
Location Polymorphism Primers Restriction Enzyme
Rat AVP intron T(+549)C f; TGA GAA CGG GTT AAA CTG GG AciI
r; GGG ACA TAC TCC GCT CAG AC
Rat AVP promoter A(-455)C f; ACA ACT GTC CTT TTT ATT CTT T Eam1104I
r; AAT CAT ACT TGA GCA TTT CA
Rat AVP promoter A(-534)G f; GCA TGT GTC ACA ACT GTC CTT T MaeIII
r; TGA GCA TTT CAG CAG CTC TC
Rat AVP promoter C(-590)T f ; GCA TGT GTC ACA ACT GTC CTT T SfaNI
r; TGA GCA TTT CAG CAG CTC TC
Rat AVP promoter T(-2452)C f; GTG ATT TCA GGT TAG AAC CC HaeIII
r; CAC TTT GGC GTC TAC GTG C
Rat oxytocin exon C(+18)T f ; GCT GTG TCC CTT TTG AGC TC BsmAI
r, CTT GGC CTA CTG GCT CTG AC
Human AVP 3’. G(-558)T f; GCC TCA GGT TCA AGA AGG MseI
r; CCA AGG CAG TGC TCG TGT
Human AVP promoter C(-229)T f; CTG AAT CCA GAG CGC TGC NlaIII
r; GCA TCC TGG TGC ACA CAG
Mouse AVP exon C(+6)T f; GTT AGC AGC CAC GTT GTC BstNI
r; CTC TTG GGC AGT TCT GGA AG
2.1.11 Sequences and accession numbers
2.2 Methods
2.2.1 DNA Analysis
2.2.1.1 DNA extraction
DNA was purified from either 0.5cm tail tips of live rats, or from the spleens of rat autopsies using the NucleoSpin Tissue kit (Macherey-Nagel). Extraction from the tail generally gave a
DNA yield of ~20µg from rats (0.5cm) and mice (0.5-1cm), whereas the spleen (~20mg) gave
somewhat higher amounts of ~30µg. A further, more cost-efficient, extraction protocol was developed to allow the analysis of large numbers of animals during the selectional breeding.
Tail tissue of mice and rats were digested in 700µl of tail buffer (Tris-HCl pH 8, 0,5M EDTA,
7M NaCl, 20% SDS) in the presence of 40µg proteinase K at 55°C overnight. 300µl of NaCl (7M) was added to the DNA, which was vortexed for 10min and centrifuged at 14,000rpm in a benchtop centrifuge for 10min. The upper aqueous layer was then added to 500µl isopropanol, which was mixed and centrifuged at again at 14,000rpm in a benchtop centrifuge for 5min to pellet the DNA. The pellet was then washed in 70% ethanol, dried and dissolved in TE buffer. DNA was also purified from samples of clotted blood using streptokinase. Streptokinase is a proteolytic enzyme, produced by haemolytic streptococci, that is capable of dissolving blood clots by converting plasminogen to plasmin. Briefly, a small amount (50µl) of clotted blood was incubated at 37°C overnight in the presence of 10U streptokinase, after which a spin column tissue extraction protocol (Qiagen) was followed.
Due to the relatively small size of rats and the presence of fur, collection of blood by hypodermic needle is not possible. Furthermore, it is not practical to take tail tips from rats over the age of 2 years due to the discomfort it causes. Therefore, a new method was designed in this study, circumventing these problems, utilizing faeces from the rats, which contain cells from the intestines as the source of DNA. Faeces are generally not a good source of pure DNA for the use in PCR procedures due to the presence of contaminating chemicals, which inhibit polymerases, and the high concentration of bacteria DNA. A method was devised involving the solid-phase chromatography principle of the spin column methods, but using streptavidin-coated magnetic poly(vinyl alcohol) (M-PVA) -beads to bind the DNA, allowing for more stringent washing steps. Briefly, faeces were taken from cages and DNA extracted following the Chemagenic kit instructions, except that the numbers of washes were increased by 5-fold, and DNA resuspended in 100µl water.
accepting the possibility of the very low levels of DNA, PCR amplification using 1µl of the
DNA in a 25µl PCR reaction (39 cycles with a 55°C annealing temperature) still proved possible (figure 4B).
Figure 4. DNA extraction and PCR results from rat faeces. (A) Agarose gel loaded with 3µl of spin column (tail tip) extracted DNA obtained from tail tip (+ve) and 3µl of faeces extracted DNA with increasing amounts of starting material (one wash of faeces with water, five washes, 0.005g, 0.05g and 0.1g). (B) PCR amplification reactions for a 550bp product (arrow) using the samples described in figure 4A performed in parallel. The first lane contains the spin column extracted DNA, the last lane the –ve control. Both gels, of A and B, are representative of three independent experiments.
Naturally, the PCR reactions were less efficient in the faeces extractions than the tail tip extractions, both in the quantity of PCR product and the success rate in PCR reactions. It also seems that using less starting material does not effect the functioning of the PCR, suggesting that the failure of the PCR was not caused by lack of starting material, but perhaps by contaminants still present in the DNA extract or an overwhelming concentration of bacterial DNA in the final DNA sample.
However, the finding that this method does result in enough detectible PCR product to allow restriction fragment length polymorphism (RFLP) analysis is testament to the use of this method as a real option for DNA extraction. Moreover, if DNA is required simply for the presence of genotyping one allele then this method represents an alternative to collecting tail tips or sacrificing animals solely for this purpose.
2.2.1.2 PCR
PCR was conducted on DNA extractions in order to amplify DNA for the use in sequencing, single strand conformation polymorphism (SSCP) analysis, cloning and RFLP genotyping.
Amplification reactions were carried out in a total volume of 25µl in the presence of 50ng of
0.25U of Taq (Thermus Aquaticus) DNA polymerase enzyme. For certain analyses outlined in
this study, such as the in vivo transcription experiments, the DNA polymerase Pfu
(Pyrococcus furiosus) was used, which is a high fidelity polymerase with a very low rate of nucleotide misincorporation. This enzyme also results in the production of blunt ended PCR products in contrast to Taq, which produces PCR products with a one base 3'-overhang.
Annealing temperature and numbers of cycles were optimised for each primer. After an initial denaturation step at 94°C for 2min, 30-35 cycles of 1min at 94°C, 1min at an optimised annealing temperature, 1min at 72°C were carried out, and a final extension period of 10min was performed at 72°C. Optimised annealing temperatures and numbers of cycles for each primer pair used in RFLPs are presented in Materials. Primers, used to amplify regions from
sequences deposited at GeneBank, were designed according to rules laid out by Innis and Gelfand (Innis and Gelfand, 1990); primers should be 18-25bp in length, GC content should be 40-60%, repetitive stretches of bases should be avoided, no 3’complimentarity between primers, if possible two cytosine or guanine residues should be present at the 3’end of each primer and the opportunity for internal secondary structure should be kept to a minimum. PCR fragments were analysed on agarose gels stained with ethidium bromide (EtBr) to check the quantity and quality of amplified product.
2.2.1.3 SSCP
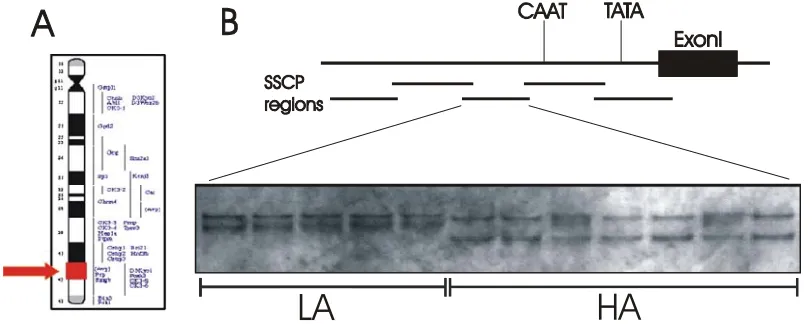
Twenty HAB and twenty LAB rats were used to search for polymorphisms in the coding and promoter regions of the AVP gene, oxytocin gene, and the CRH gene. Primers were designed
for SSCP analysis to produce overlapping PCR products of around 300bp long. 3-5µl of PCR product, depending on the concentration, were mixed with an equal volume of loading dye (10mM NaOH, 20mM EDTA, 95% formamide, 0.025% Bromophenol blue and 0.025%
2.2.1.4 Sequencing
Plasmid inserts were sequenced using Thermosequenase Cycle sequencing kit in conjunction with α-33PdATP. PCR products corresponding to genomic regions were sequenced using the Thermosequenase radiolabelled termination cycle sequencing kit and [α-33P]ddNTP. Although both protocols are based on the same traditional chain termination sequencing method (Sanger, 1977), the first method used for plasmid sequencing involves alkaline denaturation of samples, which proved inefficient for the separation of linear DNA fragments produced in PCR. Furthermore, the use of [α-33P]ddNTP in the second protocol, ensures the radiolabel is incorporated in the 3’ end, allowing longer stretches of DNA sequences to be read more cleanly with the occurrence of fewer compressions and BAFLs (Bands across four lanes). Primers used for sequencing (refer to section 2.1.10.2) were either complementary to inserted sequences or complementary to sequences found in the parent vector backbone.
Sequencing of plasmids was conducted by firstly denaturing 2-4µg of vector DNA (prepared from either maxi-preps or spin columns) in the presence of 1mM NaOH/0.001mM EDTA in a final volume of 20:l. The DNA is then precipitated in 3M NaAc (pH 5.2) and ethanol, washed in 70% ethanol and annealed with 2pM primer in the presence of sequenase buffer. The elongation reaction is performed by adding DTT, 1x label mix, α-33PdATP and 1.3U T7-Sequenase, which is terminated by the addition of ddNTP(G,A,T,C), and finally, formamide loading buffer. This reaction was performed on micro test plates.
PCR products were cleaned-up prior to sequencing by treating with ExoSAP-IT. ExoSAP-IT utilizes two hydrolytic enzymes, Exonuclease I and Shrimp Alkaline Phosphatase, to remove unwanted dNTPs and primers from PCR products. Exonuclease I removes residual single-stranded primers and any extraneous single-stranded DNA produced in the PCR. Shrimp Alkaline Phosphatase removes the remaining dNTPs from the PCR mixture. Following this, 100-200ng DNA was included in the Thermosequenase radiolabelled termination cycle sequencing reaction, which was performed as described in the manufacturers protocol. This reaction was performed in PCR tubes. Sequencing products from both reactions were, thereafter, treated the same. The reactions were heated to 75°C for 2min, to dentature the DNA, and loaded onto an 8% denaturing polyacrylamide gel (see
Materials). The gels were run in 0.5x TBE at 3,000V and 40-50W for between 1-3h at a
2.2.1.5 RFLP analysis
Polymorphisms detected in genomic DNA from the sequencing reactions described above were analysed, using the online DNA analysis program contained in webcutter2 (refer to section 2.2.6), to determine if a polymorphism affected a DNA site for a restriction endonuclease. Any polymorphisms resulting in differential digestion by a restriction endonuclease were used to genotype animals for the presence of the polymorphism concerned. This procedure using RFLP is far more cost and labour efficient than sequencing for the presence of a genotype in large numbers of animals. Primers are designed spanning the restriction site, to give a PCR product of between 300-500bp in length. Ideally, the polymorphism is usually located off centre, to allow for electrophoresis separation of both digested products; this and the presence of nearby restriction sites determines the positions on which the primers are designed. The DNA concentration of PCR products prior to enzyme digestion is estimated by agarose gel electrophoresis. Around 1µg DNA is digested in a reaction containing reaction buffer (with or without BSA) and between 1 and 5U restriction endonuclease. The reaction is then made up to an appropriate volume of between 10 and 20µl with distilled water. The digestion reactions are incubated at the optimal temperature required by the enzyme for between 8 and 24h. Generally, the whole digestion reaction is mixed with
1µl loading buffer (see Materials) and loaded on to either an agarose or polyacrylamide gel.
agarose present in the gel. The DNA bands are then photographed in the presence of UV light using Kodak Polaroid film.
Rat, mouse or human samples are genotyped at least twice to allow for inefficiencies in the digest that may lead to misanalysis. Furthermore, all digests are performed with control reactions containing the known polymorphism expected to lead to either absence of, or complete, cleavage. All RFLP analyses including the polymorphisms, primer pairs and restriction enzymes used in this study are listed in section 2.1.10.4.
2.2.1.6 Radioactive labelling
The Forward reaction was used for end labelling dsDNA and annealed oligonucleotides used in EMSA experiments, and were performed using fill-in end labelling. The oligonucleotides were annealed as described below in the EMSA. 1.5µl of the oligonucleotides were added
together with 2µl 10x Klenow buffer, 4µl dATG, dGTT, dTTP (5mM), 9-6.5µl H2O,
2.5-5µl 32P-dCT and 1µl Klenow enzyme. This was incubated at room temperature for 30min,
after which 4µl dCTP (5mM) was added and the reaction incubated again at room temperature for a further 5min. A Biospin column was used to clean up any free label. A working stock of
20,000cpm/µl was used for all reactions described.
The Exchange reaction was used for end labelling ssDNA oligonucleotides and was performed using the 5’ termini labelling Forward Reaction. The DNA needs to be dephosphorylated for this procedure, which is the case for ordered oligonucleotides that are supplied dephosphorylated. dsDNA was firstly dephosphorylated by CIAP. This 5’hydroxyl terminus, lacking a phosphate group, is then rephosphorylated by transferring the γ-phosphate using T4 polynucleotide kinase (PNK). Efficiency depends on the first residue and experimental design ensures this was usually a G, which is most efficient, followed by A or T, and C, which is the least efficient. The reaction comprises 20pM DNA, 2µl Reaction buffer A,
5µl (γ32P)ATP, 11µl H2O and 1µl T4 PNK, which was incubated for 1h at 37°C. The reaction
was terminated by addition of 1µl 0.5M EDTA(pH8.0), after which the unincorporated free
radionucleotide is removed using a Biospin column. A working stock of 20,000cpm/µl was used for all reactions described.
2.2.2 RNA analysis
2.2.2.1 RNA extraction
hypothalamic tissue expressing AVP can be used for RNA extraction. Rats were decapitated and the brains removed. A 2mm lateral slice is taken containing the hypothalamus, and from this the PVN and SON were dissected out under the guidance of the group of Professor Landgraf. The PVN/SON samples were kept on ice for up to 10min, until the extraction procedure was initiated. The acidic phenol method, developed by Chomczynski (Chomczynski and Sacchi, 1987) was used for the extraction procedure. Commercially available kits employing spin columns (Qiagen) were tested, though the acidic phenol kit proved to be the most efficient for the type and size of material used in this study.
The frozen brain tissue was crushed with a plastic mortar in a 1.5ml Eppendorf tube. To this was added solution D containing β-mecaptoethanol, which breaks down di-sulphide bridges, and the potent protein denaturant guanidium thiocyanate which denatures RNases present in the sample. The sample was then combined with 2M NaOAc (pH4), acidic phenol and chlorophorm/isoamyl and vortexed. This causes the partitioning of proteins, lipids, and importantly, DNA into the phenol layer. DNA shows a pH-dependent partitioning while RNA does not – when the aqueous phase of phenol is above pH7.5 DNA partitions with RNA into the aqueous layer. When low pH4 is used DNA partitions to the phenol layer, leaving only the RNA in the aqueous phase. The sample was centrifuged to aid partitioning of the phenol layer, and the upper phase removed and added to cold isopropanol to precipitate the RNA. This was centrifuged again, and the pellet dissolved in solution D to dissociate any further proteins carried with the RNA in the sample. Again the RNA was precipitated with cold isopropanol and then washed in 70% ethanol to remove salt. The RNA pellet was further dissolved in warm proteinase K buffer and digested with 1µl proteinase K (10mg/ml) at 55°C for 30min to enzymatically remove any residual RNases still present in the sample. The sample was then mixed with equal volume of phenol/chloroform/isoamyl to denature and remove the previously added proteinase K, and the upper layer mixed with 1/10 3M NaOAc (pH5.5) and 2.5x ethanol to precipitate the RNA which was again washed in 70% ethanol. The final pellet was dissolved in between 20-50µl DEPC water.
2.2.2.2 Riboprobe
To generate the CBF-A riboprobe, used in the in situ-hybridisation experiments, the plasmid
pBSK-CBF-A, containing the full length CBF-A cDNA cloned into the SmaI site (refer to section 2.2.3.2), was digested with BamHI and religated to contain only the 326bp N-terminal sequence of the CBF-A cDNA. To generate antisense probe, the plasmid was linearied with EcoRV, and for sense probe the plasmid was linearized with XbaI. The template DNA was then purified with a phenol/chlorophorm extraction and transcribed and labelled with 35S-UTP in a 30µl reaction mixture containing 20U of either T7 (sense probe) or T3 (antisense probe) RNA polymerase, 1x reaction buffer, 0.5M DTT, 10mM each of ATP, GTP, and CTP, 10µM 35S-thio-rUTP (12.5mCi/mM), 1.5 µg of linearized template DNA and 40U of recombinant RNasin RNase inhibitor. The reaction was incubated at 37°C for 3h after which the reactions were stopped by addition of 2U RNase-free DNase I. Unincorporated nucleotides were removed using the RNeasy kit following the clean up protocol.
2.2.2.3 In situ-hybridisation analysis
In situ-hybridisation was performed according to a protocol outlined by Cota et al., 2003.
Slide-mounted frozen brain sections were fixed for 10min in ice-cold 4% paraformaldehyde/PBS, rinsed in 1x PBS, suspended in 0.1 M triethanolamine at pH 8.0 and acetylated by addition of 0.25% acetic anhydride over 10min. Both the antisense and the control sense probes were applied to the slide-mounted sections in a volume of 100µl hybridisation buffer/section, containing 4–5×10⁶ cpm of 35S per section. Hybridisation buffer consisted of 50% formamide, 20mM Tris-HCl pH8.0, 0.3M NaCl, 5mM EDTA pH8.0, 10% dextran sulphate, 0.02% Ficoll 400, 0.02% polyvinylpyrrolidone, 0.02% BSA, 0.5mg/ml tRNA, 0.2mg/ml fragmented herring sperm DNA and 200mM DTT (Marsicano and Lutz, 1999). In control experiments slides were pretreated with RNAse A prior to hybridisation. All sections were incubated for 20h in a humid environment at 55°C, and then rinsed in 2× SSC, washed in a standard series of washes, and dehydrated in a graded series of ethanols. The resulting slides were exposed to X-ray film for 8 days.
counterstained in 1% tolurodine Blue for 3min and dehydrated in a graded series of ethanols. The sections werethen embedded in Roti-Histokitt (2 drops) followed by a cover slip.
2.2.2.4 Allele-specific transcription in vivo
RNA was extracted from the PVN of the hypothalamus of F1 animals, heterozygous for the two AVP promoter alleles, using the acidic phenol method (see above). Oxytocin and AVP heterogeneous RNA (hnRNA) was reverse transcribed and amplified using gene-specific primers in combination with the OneStep RT-PCR kit from Qiagen. The Qiagen OneStep RT-PCR enzyme mix contains enzymes for both reverse transcription and PCR amplification in the same tube. Omniscript reverse transcriptase is specially designed for reverse transcription of RNA amounts greater than 50ng, and Sensiscript reverse transcriptase is optimised for use with very small amounts of RNA (<50ng). This special enzyme combination provides highly efficient and sensitive reverse transcription of any RNA quantity from 1pg to 2µg. HotStarTaq DNA Polymerase provides hot-start PCR for highly specific amplification. During reverse transcription, HotStarTaq DNA Polymerase is completely inactive and does not interfere with the reverse-transcriptase reaction. After reverse transcription by Omniscript and Sensiscript reverse transcriptases, reactions are heated to 95°C for 15min to activate HotStarTaq DNA Polymerase and to simultaneously inactivate the reverse transcriptases. This hot-start procedure using HotStarTaq DNA Polymerase eliminates extension from non-specifically annealed primers and primer–dimers in the first cycle ensuring highly specific and reproducible PCR.
The design of gene-specific primers for the reverse transcription of the oxytocin and AVP genes was important. The primers were designed to be 18–30 nucleotides in length with a G/C content of 40–60%. The primers were designed with similar Tm values not lower than the reverse-transcription reaction temperature (e.g. 50°C). Furthermore, the primers were designed to avoid; (i) complementarity’s of two or more bases at the 3' end to reduce primer– dimer formation, (ii) mismatches between the 3' end of the primer, (iii) runs of 3 or more G or C nucleotides at the 3' end, (iv) a 3'- end T, (v) complementary sequences within a primer sequence and between the primers of a primer pair.
introns). Size difference in products is used to detect the presence of contaminating DNA. However, our study required the analysis of heterogenous prespliced mRNA (hnRNA) and, therefore, primers were designed to specifically anneal to sequences in intronic regions. Control reactions were used with each RT reaction to test for the presence of contaminating DNA in the reagents. Therefore, contaminating DNA in the RT-reaction from the sample was checked for by performing deoxyribonuclease I digestion of the RNA sample prior to reverse transcription. Briefly, 1µg of RNA was digested in a reaction volume of 10µl containing 10x reaction buffer with MgCl2 and 1U deoxyribonuclease I and incubated 37°C for 30min.
The reaction is stopped by the addition of 1µl 25mM EDTA and heating at 65°C for 10min to destroy the deoxyribonuclease.
Primer pairs were designed to anneal to the RNA from oxytocin and the prespliced hnRNA from AVP (figure 5). The forward primer for oxytocin (ATC TCG GAC TGA ACA CCA ACG C) locates to the 5’ untranslated region 2bp 5’ to the start codon and 20bp 5’ to the polymorphism. The gene-specific primer (CTG TGC ACA ATC CAT ATC GGG AC) locates to the first intron 28bp 5’ to the intronI/ExonII splice junction. This gives an expected cDNA product of 343bp. The forward primer (CCG ACA TGG AGC TGA GAC) and the gene-specific primer (TGA GCC TAG TGA CTG GAT TCC C) for AVP derived from sequences in exon I, 2bp 5’ to the exon I/intron I junction and the first intron.
PCR was performed under the following conditions: cDNA synthesis at 50°C for 30min for the reverse transcription, 94°C 15min to destroy the reverse transcriptase and activate the polymerase, amplification for 20 cycles with 94°C 30sec, 55°C 30sec, 68°C for 30sec. A further 20 cycles of PCR was performed on 1µl of the previous reaction using a nested primer and Pfu polymerase (NEB). Products were purified and cloned into the EcoRV site of the vector pBSKII (Stratagene). Following transformation into DH5α bacteria DNA was isolated from single colonies (Nucleospin miniprep kit, Macherey-Nagel) and sequenced to track the allele from which the RNA was transcribed. Every reaction included one negative control in every round of RT-PCR that lacked the template RNA in order to detect possible contamination of the reaction components.
2.2.3 Plasmids
2.2.3.1 Standard and parent plasmids
pBSKII is a high copy number ColE1-based phagemid with a large and versatile polylinker in two orientations to allow for the cloning of a wide variety of products. T3 and T7 promoters flanking the polylinker allow for in vitro transcription of RNA. The plasmid contains a gene
for Ampicillin-resistance in E. coli to allow for selection of transformed bacteria. The plasmid
further allows for the identification of recombinant clones containing inserts in the polylinker located in the β-gal gene, whose activity is destroyed in case inserts are incorporated.
pGEX-2-Tk vectors allow the construction of GST fusion proteins by inserting a cDNA inframe into the multiple cloning site. Expression is under the control of the tac promoter, which is induced by the lactose analogue isopropyl-β-d-thiogalactopyranoside (IPTG). The vector is also engineered with an internal lacIq gene coding for a repressor protein that binds to the operator region of the tac promoter, preventing expression until induction by IPTG, thus maintaining tight control over expression of the insert.
pRK8-PKA contains the catalytic subunit of PKA derived from rat under the control of the CMV promoter (Spengler et al., 1993).
size means it has less chance of interfering with the fusion protein’s function and transportation.
pGL2-Basic vector contains the coding region for firefly luciferase, but lacks eukaryotic promoter and enhancer sequences, allowing the cloning of putative regulatory sequences. Therefore, expression of luciferase activity in cells transfected with this plasmid depends on insertion and proper orientation of a functional promoter upstream from the luciferase gene. The vector also contains a high copy number prokaryotic origin of replication for maintenance in E. coli, and an ampicillin-resistance gene for selection.
2.2.3.2 cDNA constructs
pRSKII-CBF-A, which was used for the preparation of the riboprobe, contains CBF-A that was released from pSR-CBF-A-N (Kamada et al., 1992) using Tth111I and SacI, after which the ends were blunted by T4 DNA polymerase and cloned into the SmaI site of pBSKII.
2.2.3.3 Expression vectors
pCMV-YY1 contained the full length YY1 cDNA comprising 16bp of untranslated 5’ sequence and 28bp untranslated 3’ sequence. This was cloned into the BamH1 site of pCMV-NEO-BAM3 under the control of the CMV promoter.
pRK7-CBF-A expression vector was made by cloning the mouse cDNA for CBF-A (a kind gift from Akira Inoue (Osaka, Japan) and Shinji Kamada (La Jolla, USA)) into the pRK7 vector downstream the CMV promoter.
pRK8-PKAc expression vector contains the catalytic subunit of PKA derived from rat under the control of the CMV promoter (Spengler et al., 1993).
2.2.3.4 Recombinant protein constructs
pGST-2Tk-CBF-A was made by releasing CBF-A from pBSKII, by a partial BamHI and EcoRI digest, and inserting into pGEX-2TK digested with BamHI and EcoRI.
FLAG-CBF-A was obtained by ligating the CBF-A fragment, which was released from pBSKII-CBF-A by a partial BamHI digest and EcoRI digest, into the BamHI and EcoRI sites of pRK7-FLAG.
2.2.3.5 Reporter constructs
pGL2-AVP proximal vector contains the proximal AVP promoter. Fragments of the rat AVP gene were generated by PCR from genomic DNA purified from either a HAB or LAB animal. AVP promoter fragments were inserted into the polylinker site of pGL2. A proximal promoter fragment of 1146bp containing sequence -860bp (775bp after digestion) to +282bp relative to the start codon, was amplified (forward primer, ACA TCC ACT TCC CT CCT GC; reverse primer, CGT TCT GGG AAA CCC ATC TA). Pfu polymerase (NEB) was used in a 50µl PCR reaction (50ng DNA, 2mM MgSO4, 0.2mM each dNTP, 2.5U Taq, 1x High fidelity
PCR buffer). Amplification of the proximal promoter was performed using 15 cycles of 94°C 40sec, 58°C 40sec, 72°C 40sec, followed by 20 cycles of 94°C 40sec, 54°C 40sec and 68°C 2min, ending with 20min of 68°C. The PCR products were purified using Qiagen spin columns and the proximal promoter fragment was digested with KpnI and ScaI to give 931bp. Following separation by agarose gel electrophoresis, the proximal promoter fragments, from the HAB and LAB animals, were cloned into the pBSKII vector digested with KpnI and EcoRV. Recombinant plasmids were completely sequenced and inserts were released using KpnI and SmaI and then inserted into the pGL2 vector digested with KpnI and SmaI.
pGL2-AVPdistal vector contained the distal AVP promoter. To include additional upstream sequences genomic DNA was amplified (forward primer, GTA CCC CAT CCA CAC AGA CC; reverse primer, ATA TAA GAT AAC TGC TTC CTT C) to give a product of 3119bp harbouring 2797bp upstream from the AVP start codon. This distal promoter was amplified using the conditions of an initial 18 cycles 94°C 40sec, 59°C 40sec, 68°C 2min, then 12 cycles 94°C 40sec 56°C 40sec 68°C 3min, ending with 20min at 68°C. Both PCR products were purified using Qiagen spin columns and the distal promoter was digested by KpnI and HincII giving a 2950bp product. Following separation by agarose gel electrophoresis, the distal promoter fragments, from the HAB and LAB animals, were cloned into the pBSKII vector digested with KpnI and EcoRV. Recombinant plasmids were completely sequenced and inserts were released using KpnI and SmaI and then inserted into the pGL2 vector digested with KpnI and SmaI.
either of the following described pGL2 variants (figure 6). The oligonucleotides were annealed giving overhanging ends complementary to the digested ends of DNA products produced by the restriction enzymes KpnI and SacI. The LAB or HAB sense and antisense oligonucleotides (0.2µg) were mixed together, denatured at 85°C for 10min and then allowed to slowly cool to 37°C for efficient annealing. The oligonucleotides were then phosphorylated in the presence of 2U PNK, 250mM DTT, 50mM ATP and 10x PNK buffer in a reaction
mixture of 50µl. This was incubated at 37°C for 30min and placed on ice.
Figure 6. Sequence of the CArG cassette used for ligation into reporter plasmids. The LAB and HAB CArG elements were included with 8bp 5’ and 6bp 3’ of the rat AVP sequence. The 5’ end of the annealed oligonucleotides is complementary to the KpnI enzyme site, while the 3’ end contains sequence complementary enough to anneal to a SacI digested ‘sticky’ end DNA, without restoring the SacI site. This ensures correct orientation of the cassette in the vector. The XbaI site allows identification of recombinant clones using an enzyme digest of miniprep DNA, while the SacI site allows for further insertions of multiple copies of the cassette.
5’ pGL2 SacI
XbaI
KpnI
SacI
XbaI
KpnI
5’ pGL2
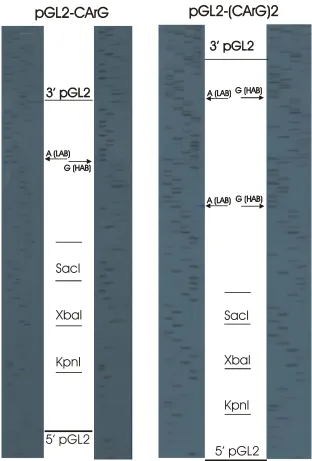
Figure 7. Sequences of the CArG ligated pGL2 vector – pGL2-CArG, pGL2-(CArG)2. Sequences were read from a sequencing primer located 5’ to the insertion site and luciferase gene. Lane order of the nucleotides is G, A, T and C. Further note the HAB and LAB polymorphic CArG sequences.
pGL2-SV40-(CArG)3 containing three copies of the CArG element was further constructed by repeating the procedure above starting with a KpnI/SacI digest of pGL2-SV40-(CArG)2 instead of pGL2-SV40-CArG.
pGL2-SV40early vector is derived from the pGL2SV40 vector which contains the intact SV40 promoter. The SV40 promoter is composed of two parts; the upstream ‘late’ enhancer and the downstream ‘early’ enhancer (figure 8). Since we wished to create a weakly active promoter we deleted the late enhancer by an SphI digest, of which two sites are found in the early/late promoter and a further site downstream in the vector (see below).
SphI SphI EcoRI SphI
Figure 8. Schematic diagram of the simian virus (SV40) promoter. The promoter is divided into two regions constituting the proximal Early enhancer and the distally located Late enhancer. Three SphI restriction sites are contained by the vector, one situated in the late enhancer, the other mapping to the late/early enhancer boundary, and a third upstream of the start codon before the SV40 promoter sequence begins. An EcoRI sequence also locates close in the vicinity of the third mentioned SphI site.
The larger fragment, containing the early enhancer was purified on an agarose gel and the overhanging ends created by the SphI sites were blunted by T4 polynucleotide kinase to create sites compatible with other blunt ended restriction fragments such as HincII. This fragment was then further digested with EcoRI and then cloned into a pBSKII vector digested with HincII and EcoRI.
pGL2-SV40early-CArG vector consisted of a series of either one, two or three CArG elements inserted into the pGL2-SV40early vector. This was performed by cutting out the CArG elements from the pGL2-SV40-(CArG)1,2 or 3 by DraIII and XhoI, lying either side of the elements and cloning them into the pGL2-SV40early vector digested by DraIII and XhoI. All LAB and HAB CArG constructs were verified by XbaI digests, as before.
The minimal promoter plasmid pGL2-TATA vector contains soley the TATA element derived from E1B (Hoffmann et al., 2003).
2.2.4 Cell culture and transfection experiments
2.2.4.1 Cell cultures
Saos-2, human osteosarcoma-like cells, (ATTC HTB-85) were established from the primary osteogenic sarcoma of an 11-year-old Caucasian female by J. Fogh and G. Trempe in 1977 (Fogh et al., 1977), and are epithelial in morphology. In this study, they were grown in Dulbecco’s Modified Eagle Medium (DMEM) supplemented with 10% foetal calf serum (FCS).
Lu-165, human small cell lung cancer cell line (a kind gift from Dr. T Terasaki, Tokyo, Japan), was established from a 50-year-old small cell lung cancer patient presenting with a syndrome of inappropriate anti-diuretic hormone secretion and the cells consequently produce a high quantity of anti-diuretic hormone (ADH, 2.8 µg protein) (Terasaki et al., 1994). The cells grow as multicellular suspended aggregates and retain their small cell carcinoma morphology. In this study, the cells were grown in RPMI1640 with L-Glutamine and 10% iron supplemented FCS. The cells grew very slowly and changes in media, including Optimum, and DMEM failed to speed up growth.
Neuro2a is a mouse neuroblastoma cell line established by R.J. Klebe and F.H. Ruddle in 1969 (Klebe RJ, 1969)from a spontaneous tumour of a strain A albino mouse (ATCC No. CCL-131) and are neuronal in morphology. The cell line does not express AVP but do produce large quantities of microtubular protein which is believed to play a role in a contractile system which is responsible for axoplasmic flow in nerve cells. They were grown in DMEM supplemented with 10% FCS.
HeLa cells are derived from a cervical epithelial adenocarcinoma of Henrietta Lacks, a 31 year old woman from Baltimore, USA, who died of cervical cancer in 1951 and established by F.W. Scherer (Scherer, 1954) (ATCC No. CCL-2). The cells retain an epithelia morphology and in this study were grown in DMEM supplemented with 10% FCS.
2.2.4.2 Transfection
Saos-2 cells were transfected by electroporation. Cells were seeded 12h before transfection. They were harvested by trypsinisation and resuspended in Electroporation buffer (EP) 1x (50mM K2HPO4, 20mM CH3KO2, 20mM KOH) to obtain a concentration of 2x10⁷
cells/ml. 1x10⁶ cells in 50µl of this was added to a 100µl mixture containing 1µg of
AVP-luciferase vector, 0.2µg pRK7-β-gal expression vector, 4µl MgSO4, 20µl EP5X, 3µg pGEM4
filling DNA, and water. This was incubated at room temperature for 10min, placed in a cuvette and then electroporated using a BTX 600 electroporator (290V, 500µF, 360Ω). After pulse delivery the cells were immediately transferred to 24-well culture dishes containing 1ml of DMEM+10% FCS and incubated overnight at 37°C 5% CO2.
Neuro2a cells were transfected using lipofectamine reagent. Cells (2x10⁵) were seeded onto 24-well tissue culture dishes in 0.5ml DMEM+10%FCS and grown until 50-80% confluence. The medium prior to transfection is removed and the cells rinsed with 200µl of DMEM without FCS. For each well 2µl of lipofectamine reagent was mixed with 1µg of
AVP-luciferase vector and 1µg pRK7-β-gal which was mixed in 50µl of serum free medium and incubated for 40min to allow complexes to form, after which a further 150µl of serum free DMEM was added. These complexes were added to the rinsed cells and incubated for 5h. After this 200µl of DMEM+20%FCS was added, and cells incubated overnight at 37°C.
Lu-165 cells were transfected using electroporation, as previously described (Coulson et al., 1999a). Briefly, 2x10⁵ cells were seeded onto 24-well tissue culture dishes in 0.5ml
DMEM+10%FCS and grown until 50-80% confluence. The medium prior to transfection was removed and the cells rinsed with 200µl of DMEM without FCS. For each well 2µl of lipofectamine reagent was mixed with 1µg of AVP-luciferase vector and 1µg pRK7-β-gal which was mixed in 50µl of serum free medium and incubated for 40min to allow complexes to form, after which a further 150µl of serum free DMEM was added. The reaction was added to the rinsed cells and incubated for 5h, after which 200µl of DMEM+20% FCS was added. Cells were incubated overnight at 37°C/5% CO2, and luciferase activity measured about 18h
later.
2.2.4.3 Luciferase assay
To measure promoter activity cells were washed twice with PBS and then thoroughly lysed in
100µl lysis buffer (75mM Tris-HCl, 10mM MgCl2, 1% Triton X-100, 2mM ATP, 1mM DTT).