Article
1
A Green Ultrasound-Assisted Extraction
2
Optimization of the Natural Antioxidant and
Anti-3
aging Flavonolignans from Milk Thistle Silybum
4
marianum (L.) Gaertn. Fruits for Cosmetic
5
Applications
6
Samantha Drouet 1,2, Emilie Leclerc 1,2, Laurine Garros 1,2, Duangjai Tungmunnithum 1,2,3, Atul Kabra
7
4,5, Bilal Haider Abbasi 1,2,6, Éric Lainé 1,2, Christophe Hano 1,2,*
8
9
1 Laboratoire de Biologie des Ligneux et des Grandes Cultures (LBLGC), INRA USC1328, Université
10
d’Orléans, Pôle Universitaire d’Eure et Loir, 21 rue de Loigny la Bataille, F-28000 Chartres, France;
11
samantha.drouet@univ-orleans.fr (S.D.); laurine.garros@univ-orleans.fr (L.G.);
emilie.leclerc@univ-12
orleans.fr (E.Le.); eric.laine@univ-orleans.fr (E.La.); hano@univ-orleans.fr (C.H.)
13
2 Bioactifs et Cosmetiques, CNRS GDR 3711 Orleans, 45067 Orléans Cedex 2, France
14
3 Department of Pharmaceutical Botany, Faculty of Pharmacy, Mahidol University, 447 Sri-Ayuthaya Road,
15
Rajathevi, Bangkok 10400, Thailand; duangjai.tun@mahidol.ac.th (D.T.)
16
4 I.K. Gujral Punjab Technical University, Kapurthala, Punjab 144603, India; atul.kbr@gmail.com (A.K.)
17
5 Kota College of Pharmacy, Kota Rajasthan 325003, India
18
6 Department of Biotechnology, Quaid-i-Azam University, Islamabad 45320, Pakistan; bhabbasi@qau.edu.pk
19
(B.H.A.)
20
* Correspondence: hano@univ-orleans.fr; Tel: +33 2 37 30 97 53; Fax: +33 2 37 91 08 63 (C.H.)
21
Abstract: Silybum marianum (L.) Gaertn. (aka milk thistle) constitute the almost exclusive source of
22
silymarin, a mixture of different flavonolignans, and is thus considered as a unique model for their
23
extraction. The present research deals with ultrasound-assisted extraction (UAE) of S. marianum
24
flavonolignans and their quantification using LC system. The optimal conditions for UAE were:
25
aqueous EtOH 54.5% (v/v) as solvent, applying an ultrasound frequency of 36.6 kHz during an
26
extraction time of 60 min at 45°C with a liquid to solid ratio of 25:1 ml/g DW. Following
27
optimization, the extraction method was validated according to international standards of the
28
association of analytical communities (AOAC) in order to ensure its precision and accuracy for the
29
quantitation of the individual silymarin components. The efficiency of UAE was compared with
30
maceration protocol of the same duration. The optimized and validated conditions allowed highest
31
extraction yields of flavonolignans in comparison to maceration. The antioxidant capacity of the
32
extracts was confirmed by the CUPRAC assays and inhibition of advanced glycation end products.
33
The skin anti-aging action was also confirmed toward the strong in vitro inhibition capacity of the
34
obtained extract against collagenase and elastase enzymes. The procedure presented here allows a
35
green efficient extraction and quantification of the main flavonolignans from the fruits of S.
36
marianum with attractive antioxidant and anti-aging activities for future cosmetic applications.
37
Keywords: Silybum marianum; silymarin; flavonolignans; ultrasound-assisted extraction; design of
38
experiement; antioxidant; anti-aging
39
1. Introduction
40
Silybum marianum (L.) Gaertn. aka Milk thistle (Asteraceae family) is one of the oldest of all
41
known herbal medicine. This plant is grown as an annual, winter annual and biennial herb depending
42
on climate [1]. In its seed it accumulates high levels of taxifolin-derived flavonolignans such as
43
silydianin (SILD), silychristin (SILC), silybins A (SILA) and B (SILB) and isosilybins A (ISILA) and B
44
(ISILB) (Figure 1) which mixture is named silymarin (SILM) [2,3]. These compounds result from the
45
oxidative coupling of a flavonoid part with coniferyl alcohol, the lignan precursor in plants [4]. S.
46
marianum constitute the almost unique source of these flavonolignans deriving from taxifolin and is
47
thus considered as the model plant for the study of their biosynthesis [5] as well as an attractive
48
resource in order to valorise these compounds for industrial applications, in particular as
49
cosmeceuticals.
50
51
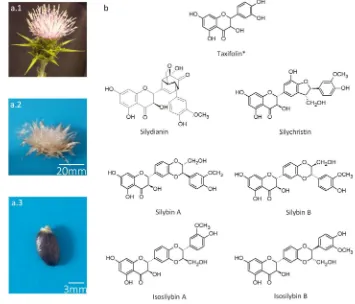
Figure 1. a.1. Representative picture of a flowering capitulum of milk thistle (Silybum marianum (L.)
52
Gaertn.); a.2. Representative picture of an open mature capitulum bearing mature fruit (achenes) of
53
milk thistle (Silybum marianum (L.) Gaertn.); a.3. Representative picture of a mature fruit (achene) of
54
milk thistle (Silybum marianum (L.) Gaertn.); b. Structures of the six flavonolignans (silychristin (SILC),
55
silydianin (SILD), silybin A (SILA), silybin B (SILB), isosilybin A (ISILA) and isosilybin B (ISILB)) and
56
one flavonoid (*, taxifolin, TAX)) from the silymarin (SILM) mixture extracted from milk thistle
57
(Silybum marianum (L.) Gaertn.) mature fruit (achene).
58
Milk thistle is one of oldest medicinal plants, used for centuries to cure various ailments and
59
traditionally used in the European pharmacopoeia as liver detoxifier [6-8] as well as a unique remedy
60
against Amanita phalloides intoxication [9,10]. For many decades, milk thistle grew in fields as a food
61
crop and for the cure of hepatobiliary diseases [11], and some established commercial cultivars are
62
available in Europe. Since that, multiple other biological activities of flavonolignans have been
63
described and investigated for numerous pharmacological action which could benefit to human
64
health for ovarian cancer [12] or breast cancer [13] for example. More recently, SILM and its
65
flavonolignans have received a growing interest for their potent antioxidant and anti-aging activities
66
relevant to cosmetic [14–19]. In particular, silybins are the most active compounds in SILM and
67
display a wide range of biological activities, such as antioxidant and skin anti-inflammatory [20]. In
68
cosmetic, the anti-aging activities of plant extracts have been ascribed to their capacity to decrease
69
the damages to the skin caused by reactive oxygen and/nitrogen species (ROS/RNS), along with their
70
aptitude to control the activity of various enzymes involved in skin aging progression. For example,
71
their capacity to inhibit elastase or collagenase involved in the cleavage of extracellular matrix
72
components. For instance, Vostalova et al. [15] have reported on the inhibitory actions of SILM, its
73
flavonolignans and some derivatives toward the collagenase and elastase and evidenced diverse
affinities against these enzymes. Moreover, SILM also confers UV-B protection [21] which could
75
result in an effective skin protection against sunburn or skin cancers [22]. All these biological activities
76
trigger the necessity to develop efficient green extraction protocols for SILM.
77
Many green extraction methods of plant natural products have already been published using
78
microwave-assisted extraction [23,24], pressured liquid extraction [25], cellulase-assisted [26] or
79
assisted extraction [27] for example. In the present study, we focused on
ultrasound-80
assisted extraction, which is one of the most simple and economic method for improving the
81
extraction yield of plant [28]. It has a short extraction time with a reduced amount of solvent making
82
it a green extraction procedure and can be rapidly upscaled for industrial purposes [29]. Ultrasounds
83
allow mass transfer intensification, cell disruption, better penetration of the solvent improving the
84
extraction and also capillary effects, limit the degradation of the herb constituents even with high
85
frequency ultrasound [30].
86
To obtain the optimal conditions for extraction yields, a response surface methodology (RSM)
87
(mathematical and statistical technique) has been used. The objective is to optimize a response
88
(extraction yield) influenced by several independent variables that are the extraction time,
89
concentration of EtOH and ultrasound power. Bioassays were performed to evaluate the antioxidant
90
and anti-aging activities of the extracts. These biological activities were correlated to the
91
phytochemical composition of the corresponding extracts.
92
2. Materials and Methods
93
2.1. Plant material
94
All milk thistle (Silybum marianum (L.) Gaertn.) seeds are lines and were provided by PMA28
95
(France).
96
2.2. Chemicals
97
All solvents and reagents for extraction and LC analysis were of analytical grade or the highest
98
available purity and were purchased from Fisher Scientific (Illkirch, France). Deionized water was
99
purified by a Milli-Q water-purification system from Millipore (Molsheim, France). All solutions
100
prepared for HPLC were filtered through 0.45 µm nylon syringe membranes prior to use. Standards
101
(silymarin, silybin B) and methoxyflavone (internal standard) were purchased from Sigma (France).
102
2.3. LC-MS
103
All flavonolignans and taxifoline were quantified using a LC-MS analysis performed on a Water
104
2695 Alliance coupled with a single quadrupole mass spectrometer ZQ. LC-ESI-MS. Data acquisition
105
and processing were performed with MassLynx 4.0 software. The separation was performed as
106
described in Drouet et al 2018 [31].
107
2.4. Extraction
108
2.4.1. Apparatus and general procedure
109
1000 mg milled achene or whole fruit was extracted in 40 mL of ethanol solvent. The ultrasonic
110
bath used was a USC1200TH (Prolabo; inner dimension: 300mm × 240mm × 200 mm) with a maximal
111
heating power of 400W (i.e. acoustic power of 1W/cm2), equipped with a digital timer, a frequency
112
and a temperature controller. The extraction was conducted during an extraction time ranging from
113
20 to 60 min at an operating temperature ranging from 25°C to 60°C. Prior to HPLC injection, the
114
extract supernatant was filtered through 0.45 µm nylon syringe membranes. The optimized USAE
115
method was compared with maceration in the same condition without ultrasound.
116
2.4.2. Experimental Design
A factorial experiment design and the resulting response surface plots were used to identify the
118
optimal extraction conditions for all flavonolignans using XLSTAT2015 software (Addinsoft, Paris,
119
France). Variables were coded at three levels (−1, 0 and +1; Table 1). The three independent variables
120
were EtOH concentration (X1 values were 50, 75 and 100%), ultrasound power (X2 values were 15,
121
30 and 45 kHz) and extraction time (X3 values were 20, 40 and 60 minutes) (Table 1). Here,
twenty-122
seven batches were obtained by using the DOE (design of experiment) function of XLSTAT 2019
123
which take values of selective variables at different levels (Table 2). The experiments were carried out
124
in triplicate. Equations of the models were calculated using XLSTAT 2019 DOE analysis tool. Surface
125
plots showing the response as a function of the simultaneous variation of the independent variables
126
were obtained with 3D option of XLSTAT 2019.
127
2.4.3. Method validation
128
The method precision, repeatability and stability were evaluated as described by Corbin et al.
129
[15]. The precision, repeatability and stability were expressed in content (mg/g) and relative standard
130
deviation (RSD, %).
131
2.5. Antioxidant activity
132
2.5.1. CUPRAC Assay
133
Cupric ion reducing antioxidant capacity (CUPRAC) was used [32]. Briefly, 10µl of an extract
134
was mixed with 190 µl of the CUPRAC solution (composed of 10mM Cu(II); 7.5mM neocuproine and
135
1M acetate buffer pH7; ratio 1:1:1 (v/v/v)). Following incubation during 15 minutes at room
136
temperature (25 ± 2 °C), the absorbance value at 450nm of the reaction mixture was measured (BioTek
137
ELX800 Absorbance Microplate Reader).
138
2.5.2. Inhibition of Advanced Glycation End Products (AGEs)
139
The inhibitory capacity of AGE formation was determined as described by Kaewseejan and
140
Siriamornpun [33] using a 20 mg/mL BSA (Sigma Aldrich) solution prepared in 0.1 M phosphate
141
buffer (pH 7.4), a 0.5 M glucose (Sigma Aldrich) solution prepared in phosphate buffer and a 0.1 M
142
phosphate buffer at pH 7.4 containing 0.02% (w/v) sodium azide. Incubation was performed at 37 °C
143
for five days in the dark. The amount of fluorescent resulting from the formation of AGEs was
144
determined using 330 nm excitation wavelength and 410nm emission wavelength conditions
145
(VersaFluor fluorometer; Bio-Rad, Marnes-la-Coquette, France). The percentage of anti-AGEs
146
formation was expressed as a % of inhibition relative to the control (addition of the same volume of
147
extraction solvent).
148
2.6. Anti-aging activity
149
2.6.1. Collagenase Assay
150
Collagenase from Clostridium histolyticum (Sigma Aldrich) was used. The collagenase activity
151
was determined using N-[3-(2-furyl) acryloyl]-Leu-Gly-Pro-Ala (FALGPA; Sigma Aldrich) as a
152
substrate following the protocol of Wittenauer et al. [34]. Absorbance decrease was followed at 335
153
nm during 20 min thank to a microplate reader (BioTek ELX800; BioTek Instruments, Colmar,
154
France). The collagenase activity in presence of each extraction conditions was determined in
155
triplicated and the anti-collagenase activity was expressed, for each extract, as an inhibition
156
percentage relative to corresponding control (adding same volume of extraction solvent).
157
2.6.2. Elastase Assay
158
Elastase assay was performed by using the porcine pancreatic elastase (Sigma Aldrich). The
159
elastase activity was determined using N-Succ-Ala-Ala-Ala-p-nitroanilide (AAAVPN; Sigma
160
Aldrich) as a substrate as described by Wittenauer et al. [34]. The release of p-nitroaniline at 410 nm
using a microplate reader (BioTek ELX800; BioTek Instruments). Triplicated measurements were
162
performed and the anti-elastase activity was expressed, for each extract, as an inhibition percentage
163
relative to the corresponding control (adding same volume of extraction solvent).
164
2.7. Statistical treatment of data
165
The means and the standard deviation were used to present the data composed of three to five
166
independent replicates. Student’s t-test was performed for comparative statistical analyses. Here,
167
significant thresholds at p < 0.05, 0.01 and 0.001 were used for all statistical tests and represented by
168
*, ** and *** respectively. Model analysis (ANOVA) and 3D plots resulting from the combination of
169
variables were conducted using XLSTAT 2019 and R. The correlation values and corresponding
p-170
values were obtained with Past by using the Pearson parametric correlation test.
171
3. Results
172
3.1. Preliminary single factor experiments and selection of limiting parameters
173
Several extraction parameters have been described to possibly affecting the extraction efficiency
174
of polyphenols from various plant matrixes [35]. Here, using a single-factor experiment approach,
175
the influence of 5 independent parameters (ethanol concentration, extraction duration, ultrasound
176
frequency, extraction temperature and liquid to solid ratio) on the SILM extraction yield from the
177
mature fruit of S. marianum were evaluated. The objective of these preliminary experiments being to
178
identify the extraction limiting factors.
179
180
Figure 2. Silymarin (SILM) contents extracted from mature fruits of S. marianum as of function of (a) aqueous
181
ethanol concentration (% (v/v)), (b) ultrasound frequency (kHz), (c) extraction duration (min), (d) extraction
182
temperature (°C) and (e) liquid to solid ratio (ml/g DW). The complete description of each extraction conditions
183
is presented in the text. Values are means ± SD of 6 independent replicates. Different letters (a-d) represent
184
significant differences between the various extraction conditions (p < 0.05).
185
186
0 2 4 6 8 Si ly m ar in co nt en t ( m g/ g DW ) 0 2 4 6 8 10 12 140 25 50 75 100
aqEtOH (%v/v) d bc a cd b
0 15 30 45
US frequency (KHz) ab
a
b
d
0 15 30 45 60
Extraction duration (min) 90 16 18 20 a 0 2 4 6 8 10 12 14 16 18 20 b c bc c d 0 2 4 6 8 10 12 14 16 18 20 0
30 40 50 60 70
Extraction temperature (°C) a a a a a Si ly m ar in co nt en t ( m g/ g DW ) 2 4 6 8 10 12 14 16 18 20 2 4 6 8 10 12 14 16 18 20
10:1 25:1 50:1
Liquide to Solid ratio (ml/g DW) 0
a a
a
a b c
The choice of the solvent is certainly the most important parameter to fix for the development of
187
an extraction method. In the literature, it appeared that several organic solvents can be considered
188
for the extraction of plant polyphenols. For this purpose, methanol, ethanol or acetone are the most
189
commonly considered extraction solvents [36]. Here, considering our objective to propose these
190
extracts for future cosmetic applications, and in respect with the development of a green chemistry
191
extraction method, ethanol was chosen. Indeed, ethanol is non-toxic to humans and an
192
environmentally friendly solvent [35]. Moreover, its extraction capacity and efficiency can be
193
modulated easily by the addition of water, thus making it an ideal solvent for the extraction of a wide
194
range of polyphenols with low to high polarity. Interestingly, these two universal solvents are
195
inexpensive, another reason for their common uses for food and/or cosmetic applications [35,36]. The
196
SILM extraction capacity of various ethanol: water mixtures were evaluated (Figure 2a). In these
197
preliminary experiments, 5 concentrations of aqueous ethanol solutions (0%, 25%, 50%, 75%, and
198
100% (v/v) ethanol in water) were assayed. The other extraction parameters were arbitrary fixed to:
199
25:1 mL/g DW liquid to solid (L/S) ratio, 30 minutes for the extraction duration, 30 kHz for the
200
ultrasound frequency and 45 °C for the extraction temperature. Ethanol concentration appeared to
201
significantly impact the SILM extraction yield from milk thistle fruits. An optimal extraction yield
202
was obtained for an ethanol concentration of 50% (v/v). Extreme values for the ethanol concentrations
203
(i.e., 0 and 100 % (v/v)) resulted in a 4- to 10-times decreases in SILM, respectively, whereas ethanol
204
concentrations of 25 and 75 % (v/v) resulted in intermediary SILM contents.
205
206
The ultrasound frequency is also known to potentially impact the extraction efficiency. This
207
parameter act though the modulation of both the cavitation effect and the diffusion coefficient of the
208
targeted compounds into the extraction solvent. This could result in an increased solubilization of
209
the target compound in the considered extraction solvent, and to an increase of the extraction
210
efficiency [36]. Moreover, the increase of ultrasound frequency could result in a decreased extraction
211
duration, and therefore of energy consumption [37]. However, application of high ultrasound
212
frequencies could also change or destroy the molecular structure of the targeted compound. This
213
could lead to a decrease in the extraction yield, but also a reduction (sometime a complete a loss) of
214
its biological activity [38]. As a consequence, the ultrasound frequency appears as a crucial parameter
215
to consider during the development of an UAE method. In our hands, we evaluated the impact of 4
216
different ultrasound frequencies on the SILM extraction yield (Figure 2b). The other extraction
217
parameters were arbitrary fixed to: 50% (v/v) aqueous ethanol concentration, 25:1 mL/g DW liquid
218
to solid (L/S) ratio, 30 minutes for the extraction duration and 45 °C for the extraction temperature.
219
A significant impact of ultrasound frequency was noted, with a highest yield observed for a 30 kHz
220
frequency. Lower US frequency (15 kHz) or even non application of US frequency resulted in a low
221
extraction efficiency, whereas highest US frequency (45 kHz) have led to a decreased SILM extraction
222
yield certainly because of a deterioration of these compounds.
223
224
To reduce energy consumption in a context of a green chemistry approach, optimizing extraction
225
duration is essential [37]. As already mentioned for US frequency, increasing extraction duration not
226
necessary results in a gain in terms of extraction yield since a prolonged duration to US can lead to a
227
deterioration of the compounds [38]. We considered 6 extraction duration (0, 15, 30, 45, 60 and 90
228
min) with the other parameters arbitrary fixed to: 50% (v/v) aqueous ethanol concentration, 25:1 mL/g
229
DW liquid to solid (L/S) ratio, 30 kHz US frequency duration and 45 °C for the extraction temperature.
230
Under these conditions, we observed a gradual increase of SILM extraction from milk thistle fruit,
231
with a maximum extraction efficiency after 45 min, followed by a significant decrease with 60 and 90
232
min extraction time using these conditions (Figure Figure 2c). This observation is in global agreement
233
with other studies that also report on a possible degradation of antioxidant phenolic compounds
234
following ultrasound treatment [35,37,38].
235
236
Different extraction temperature (30, 40, 50, 60 and 70 °C) were next evaluated for their influence
237
on SILM extraction yield (Figure Figure 2d). In our hands, using the other parameters fixed (ethanol
concentration 50% (v/v), S/M ratio 25:1 mL/g DW, extraction time 45 min and ultrasound frequency
239
30 kHz), the extraction temperature did not appeared as a limiting parameter significantly impacting
240
the SILM extraction yield. The hot spot theory could explain this observation. Indeed, according to
241
this theory, the cavitation bubbles are considered as a microreactor generating a local environment
242
in the surrounding liquid after their collapse with high temperature (ca 4500 °K) and pressure (ca
243
1000 atm) that could justify the low impact of few dozen temperature degrees [36].
244
245
Finally, the 3 liquid to solid (L/S) ratios (10:1, 25:1 and 50:1, in ml of 50 % (v/v) aqueous ethanol
246
per gram of DW material) evaluated (using an extraction time of 30 min, a sonication frequency of 30
247
kHz and a extraction temperature of 45 °C) only resulted in a slight non-significant difference in SILM
248
extraction yield with slightly best result for the ratio 25:1 (Figure Figure 2e). This ratio was therefore
249
used hereafter, but this parameter was not considered as limiting parameter, and as such not further
250
optimized.
251
252
3.2. Development of a Multifactorial Approach
253
The preliminary experiments evidenced the significant impacts of ethanol concentration,
254
extraction duration and US frequency (Figure 2) which were therefore selected for further
255
optimization. Here, in order to take into account, the possible interactive influence of these
256
parameters, we employed an experimental factorial design (design of experiment, DOE) with
257
statistical analysis. This strategy is known to be more effective, precise and rapid to integrate a large
258
number of extraction conditions allowing to evidence possible interaction between independent
259
variables as compared with a single factor approach [39]. Taking into account the preliminary
260
experiments, we decided to limit the 3 influencing variables as follow: the concentration of aqueous
261
ethanol (variable X1, ranging from 25 to 75 % (v/v)), the US frequency (variable X2, ranging from 15
262
to 45 kHz) and the extraction duration (variable X3, ranging from 20 to 60 min). Both their coded
263
levels and experimental values are presented in Table 1. Given the results of the preliminary
264
experiments, an L/S ratio of 25:1 and an extraction temperature of 45 °C were used.
265
266
Table 1. Identity, code unit, coded level and experimental values of the 3 independent variables.
267
Independent variable Code unit Coded variable levels -1 0 +1
ethanol concentration (% v/v)1 X1 25 50 75
US frequency (kHz) X2 15 30 45
Extraction duration (min) X3 20 40 60
1 % of ethanol concentration in mixture with HPLC grade ultrapure water.
268
269
A full factorial design was used to optimize this extraction process in owing to its high
270
reproducibility as a consequence of the real measurement of a large number of experimental
271
conditions compared to other DOE approaches [40]. In silico drove the 27 different bath conditions
272
(run ID) were determining with their corresponding independent process variables, and randomized
273
(run order) as presented in Table 2. Each batch condition was assayed in independent triplicates. The
274
SILM extraction yield (Table 2) as well as individual composition in each flavonolignan (Table S1)
275
were determined.
276
277
Following HPLC analyses (Figure 3), the SILM content extracted from mature fruit of S.
278
marianum ranged from 1.80 (run ID#13) to 17.98 (run ID#26) mg/g DW (Table 2). The individual
279
composition of the SILM of each extract was also determined. The separation was based on the
280
method described by Drouet et al. [14], here further optimized (see Materials and Methods, sections
281
2.3 and 2.4) to allow a higher resolution for the separation of the different peaks as shown on Figure
282
3.
284
Figure 3. Representative HPLC chromatogram of an extract prepared by USE of a mature fruits (achenes) of a
285
milk thistle (S. marianum (L.)) commercial cultivar. The main compounds considered in this study are the
286
flavonoid taxifolin (TAX) and the flavonolignans: silychristin (SILC), silydianin (SILD), silybin A (SILA), silybin
287
B (SILB), isosilybin A (ISILA) and isosilybin B (ISILB). Int Std: internal standard (6-methoxyflavone).
288
289
Table 2. Results of full factorial design experiments for the extraction of silymarin (SILM) from
290
mature fruits of S. marianum (L.).
291
Run ID Run order X1 X2 X3 SILM (mg/g DW)
Run ID#1 17 -1 -1 -1 2.24 ± 1.80
Run ID#2 24 0 -1 -1 6.99 ± 4.11
Run ID#3 26 +1 -1 -1 4.33 ± 3.09
Run ID#4 21 -1 0 -1 2.55 ± 4.61
Run ID#5 22 0 0 -1 9.66 ± 1.44
Run ID#6 6 +1 0 -1 6.51 ± 3.06
Run ID#7 10 -1 +1 -1 4.37 ± 1.72
Run ID#8 27 0 +1 -1 8.45 ± 4.48
Run ID#9 7 +1 +1 -1 6.88 ± 4.82
Run ID#10 18 -1 -1 0 3.21 ± 0.34
Run ID#11 12 0 -1 0 12.12 ± 1.57
Run ID#12 8 +1 -1 0 6.15 ± 1.08
Run ID#13 25 -1 0 0 1.80 ± 1.50
Run ID#14 1 0 0 0 14.25 ± 0.51
Run ID#15 16 +1 0 0 9.79 ± 2.47
Run ID#16 23 -1 +1 0 2.49 ± 1.59
Run ID#17 11 0 +1 0 12.88 ± 3.35
Run ID#18 14 +1 +1 0 9.13 ± 1.80
Run ID#19 15 -1 -1 +1 2.49 ± 0.33
Run ID#20 3 0 -1 +1 16.00 ± 0.35
Run ID#21 13 +1 -1 +1 7.27 ± 0.36
Run ID#22 9 -1 0 +1 4.20 ± 0.30
Run ID#23 5 0 0 +1 16.71 ± 0.19
Run ID#25 4 -1 +1 +1 4.04 ± 0.30
Run ID#26 20 0 +1 +1 17.98 ± 0.66
Run ID#27 2 +1 +1 +1 8.54 ± 0.94
Values are the mean ± RSD of 3 independent replicates except for *, which correspond to the highest
292
SILM content here determined by 6 independent experiments to confirm this value.
293
294
In regards to SILM composition from the most to the less abundant (Table S1):
295
- SILB was detected under each extraction condition and its contents ranged from 1.29 (run ID#1)
296
to 7.52 (run ID#26) mg/g DW;
297
- the detected SILD contents ranged from 0.40 (run ID# 13) to 4.21 (run ID#20) mg/g DW, whereas
298
SILC was not detected under one extraction condition (run ID#16). This run ID#16 presented the
299
combination of low ethanol concentration (25% (v/v)) and application of high US frequency (45 kHz);
300
- the detected ISILA contents ranged from 0.45 (run ID#3) to 2.49 (run ID#26) mg/g DW, whereas
301
ISILA was not detected under 9 extraction conditions (run ID#1, #4, #7, #10, #13, #16, #19, #22 and
302
#25). All these run IDs were obtained using with the same (lowest) aqueous ethanol concentration of
303
25% (v/v) as X1 extraction condition (X1 = -1, Table 1);
304
- the detected SILC contents ranged from 0.01 (run ID#19) to 1.52 (run ID#26) mg/g DW, whereas
305
SILD was not detected under 4 extraction conditions (run ID#7, #16, #22 and #25). Like run ID#16, the
306
run IDs#16 and #25 presented the same combination of low ethanol concentration (25% (v/v) in water,
307
X1 = -1, Table 1) and high ultrasound frequency of 45 kHz (X2 = +1, Table 1), whereas run ID#22
308
presented again low ethanol concentration (i.e. 25% (v/v), X1 = -1, Table 1) and intermediate
309
ultrasound frequency of 30 kHz (X2 = 0, Table 1), but during a prolonged period of time (X3 = +1 (i.e.,
310
60 min), Table 1);
311
- the detected SILA contents ranged from 0.01 (run ID#13) to 1.09 (run ID#26) mg/g DW, whereas
312
SILA was not detected under 3 extraction conditions (run ID#4, #16 and #24). These run IDs used the
313
same low ethanol concentration (i.e. 25% (v/v), X1 = -1, Table 1), whereas run ID#16 and #24 were
314
performed at high US frequency (X2 = +1, Table 1) during a prolonged period of 40 and 60 min,
315
respectively (X3 = 0 or +1, respectively, Table 1)
316
- TAX was detected under each extraction conditions and its content ranged from 0.16 (run ID#3)
317
to 0.68 (run ID#20);
318
- and finally, the detected ISILB contents ranged from 0.03 (run ID#9) to 0.55 (run ID#26) mg/g
319
DW, whereas SILA was not detected under 3 extraction conditions (run ID#1-4, #6, #7, #10, #12-16,
320
#19, #22, #24, #25 and #27). We observed that the use of an aqueous ethanol concentration of 25% (v/v)
321
always failed to extract ISILB. These results may also be related to the low accumulation of ISILB in
322
the mature fruit of the considered milk thistle cultivar.
323
324
To sum up these results, the hypothesis of low extraction yields of SILM and its constituents as
325
a consequence of their lower solubility in extraction solvent with high polarity and/or of destructive
326
extraction linked to too drastic (high and/or prolonged) US treatment can be made.
327
328
To analyse more deeply these results, a model of the SILM extraction yield as a function of the 3
329
different variables was obtained by multiple regression analysis (Table 3). Using the conditions
330
described in Table 1 and Table 2, the SILM extraction yield (YSILM) as a function of the 3 different
331
variables (X1: ethanol concentration, X2: ultrasound frequency and X3: extraction duration) in the
332
form of a polynomial equation was: YSILM = 13.52 + 2.29X1 + 0.78X2 + 1.96X3 – 7.45X12 -0.86X22 – 0.25X32
333
+ 0.32X1X2 + 0.55X1X3 – 0.11X2X3 (Table 3).
334
335
Table 3. Values, standard deviations and statistical analysis of the regression coefficients for the
336
SILM extraction yield (YSILM) from mature fruits of S. marianum (L.) as a function of the 3 different
337
variables (X1: ethanol concentration, X2: ultrasound frequency and X3: extraction duration)
338
Constant 13.52 1.0 13.75 < 0.0001***
X1 2.29 0.5 5.04 0.0001***
X2 0.78 0.5 1.70 0.11ns
X3 1.96 0.5 4.31 0.0004***
X12 -7.45 0.8 -9.44 < 0.0001***
X22 -0.86 0.8 -1.09 0.29ns
X32 -0.25 0.8 -0.31 0.76ns
X1X2 0.32 0.6 0.58 0.57ns
X1X3 0.55 0.6 0.98 0.34ns
X2X3 -0.11 0.6 -0.20 0.84ns
SD standard error; *** significant p < 0.001; ** significant p < 0.01; * significant p < 0.05; ns not significant.
339
340
The statistical analysis (Table 3) evidenced the significant impact on the SILM extraction
341
efficiency from mature fruit of S. marianum (L.) of the linear coefficients X1 (ethanol concentration)
342
and X2 (extraction time) and the quadratic coefficients X12. On the contrary, the other linear X3
343
(ultrasound frequency), quadratic X22 and X32 as well as interaction coefficients were not significant
344
(p > 0.05). Therefore, ethanol concentration (X1) as well extraction duration (X2) appeared to be the
345
most influent parameters for this extraction process over US frequency (X3) for SIM extraction. The
346
same trend was observed for the individual constituents of the SILM, with the exception of ISILB for
347
which the quadratic coefficients X12 was the sole significant coefficient (Table S2).
348
349
In addition to all these significant coefficients, SILB extraction was also significantly impacted
350
by the US frequency (linear coefficients X2). SILB was therefore the unique compound for which
351
extraction was significantly influenced by this US frequency variable. Nevertheless, we have to keep
352
in mind, here during the DOE in all the extraction conditions US were applied at 3 different
353
frequencies appearing to be in the best range in preliminary experiments. During these preliminary
354
experiments it also became clear that the absence of US treatment drastically reduced extraction
355
efficiency. So, here we can conclude that US frequency X3 variable did not significantly influenced
356
the SILM extraction yield in the selected range of values for this variable, whereas the absence of US
357
had clearly resulted in a less efficient extraction process during the preliminary experiments.
358
359
Results of the analysis of variance (ANOVA) and the fit for the models obtained for SILM and
360
its constituents are listed in Table 4 and Table S3, respectively. The high F-value (14.73) and the low
361
p-value (p < 0.0001) indicated that the model was highly significant and can predict the SILM content
362
as a function of the variable values with a great precision (Table 4). The same trend was recorded for
363
each individual constituent of the SILM (Table S3), with a lower but still significant precision for
364
ISILB. This was also confirmed by the low and non-significant lack of fit values. The model precision
365
in the prediction of the experimental values is evidenced by the predicted vs. experimental plot
366
presented in Figure S1, with determination coefficient R2 of 0.891 (adjusted value of 0.833) for SILM,
367
and ranging from 0.810 for TAX to 0.946 both for SILC and SILD, with the exception of ISILB
368
presenting an R2 value of 0.589 (Table 4 and Table S3). Finally, this was also confirmed by the
369
coefficient value (CV) indicating the adequacy between the model and experimental values.
370
371
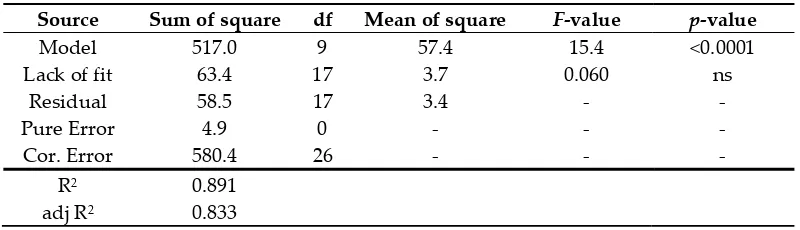
Table 4. ANOVA of the SILM extraction model.
372
Source Sum of square df Mean of square F-value p-value
Model 517.0 9 57.4 15.4 <0.0001
Lack of fit 63.4 17 3.7 0.060 ns
Residual 58.5 17 3.4 - -
Pure Error 4.9 0 - - -
Cor. Error 580.4 26 - - -
R2 0.891
CV % 0.238
df: degree of freedom; Cor. Error: corrected error; R2: determination coefficient; R2 adj: adjusted R2; CV
373
variation coefficient value; ns: non-significant.
374
375
In order to better understand the complexity of the model, 3D plots were drawn for SILM (Figure
376
4) and the individual constituents (Figures S2-8).
377
378
Figure 4. 3D plots from the model predicted SILM extracted quantities from mature fruits of S. marianum as a
379
function of (a) ethanol concentration and ultrasound frequency, (b) ethanol concentration and extraction
380
duration, and (c) ultrasound frequency and extraction duration.
381
382
The linear coefficients of the second-order polynomial equation for X1 ethanol concentration, X2
383
ultrasound frequency and X3 extraction duration, as well as the interaction coefficients X1X2 (ethanol
384
concentration and ultrasound frequency) and X1X3 (ethanol concentration and extraction duration)
385
were all positives, indicating that the increase of these parameters results in a favourable action on
386
the SILM extraction yield. But, their low values, in association with the negative values recorded for
387
their quadratic coefficients (i.e., X12, X22 and X32) as well as for the interaction coefficient between
388
ethanol concentration and US frequency X2X3 indicate that the extraction of SILM reaches a
389
maximum value before decreasing for higher values of these parameters. We can observe these
390
tendencies on the 3D plots with first a positive action on SILM extraction yield in increasing aqueous
391
ethanol concentration combined with higher US frequency and/or prolonged extraction duration
392
(Figure 4a, b). But, the highest aqueous ethanol concentration, on the one hand, as well as prolonged
393
extraction duration with high US frequency, on the other hand, resulted in a marked decline of SILM
394
extraction yields (Figure 4). Ethanol/water mixtures represent eco-friendly solvents able to extract a
395
wide range of polyphenols, however optimal ethanol/water ratio is highly dependent of the polarity
396
of the considered polyphenol [36]. Applying high ultrasound frequency for a prolonged period of
397
time is known to be potentially destructive and to induce oxidation of natural products, especially
398
when water is used as solvent (or present as mixture with ethanol) that could lead to a decrease in
399
extraction yield as well as to the loss of the biological activities of the compound [27,36,38,41].
400
According to the adjusted second order polynomial equation, optimal conditions were a USE with
401
54.5% (v/v) aqueous EtOH as solvent, applying an ultrasound frequency of 36.6 kHz during an
402
extraction time of 60 min, with a fixed extraction temperature of 45°C and liquid to solid ratio of 25:1
403
ml/g DW. Adjusted to the material, an US frequency of 30 kHz was used. Under these optimized
404
conditions, SYLM extraction yield from the mature fruit of Silybum marianum AJQ cultivar reached
405
20.28 ± 0.41 mg/g DW.
406
407
3.3. Validation of the Extraction Method
408
As shown in Figure 3, the identification and quantification of the SILM different constituents
409
were using the validated separation method described by Drouet et al. [14] by comparison with an
410
authentic commercial standards, and further confirmed by LC-MS. Here, the separation resolution
was further ameliorated following slight modification of the mobile phase (see Materials and
412
Methods, section 2.4), thus allowing a precise quantification of each compound. Coupled with the
413
present optimized extraction method, in order to certify accuracy and precision, the method was then
414
validated according to the recommendations of the association of analytical communities (AOAC)
415
(http://www.aoac.org). The parameter values of this validation procedure are satisfactory in terms of
416
precision, repeatability and stability according to AOAC standards and are presented in Table 5.
417
418
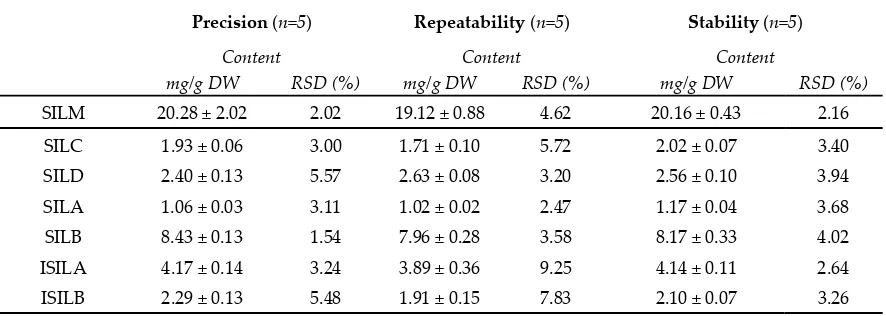
Table 5: Precision, repeatability and stability validation parameters of the method.
419
Precision (n=5) Repeatability (n=5) Stability (n=5)
Content Content Content
mg/g DW RSD (%) mg/g DW RSD (%) mg/g DW RSD (%)
SILM 20.28 ± 2.02 2.02 19.12 ± 0.88 4.62 20.16 ± 0.43 2.16 SILC 1.93 ± 0.06 3.00 1.71 ± 0.10 5.72 2.02 ± 0.07 3.40 SILD 2.40 ± 0.13 5.57 2.63 ± 0.08 3.20 2.56 ± 0.10 3.94 SILA 1.06 ± 0.03 3.11 1.02 ± 0.02 2.47 1.17 ± 0.04 3.68 SILB 8.43 ± 0.13 1.54 7.96 ± 0.28 3.58 8.17 ± 0.33 4.02 ISILA 4.17 ± 0.14 3.24 3.89 ± 0.36 9.25 4.14 ± 0.11 2.64 ISILB 2.29 ± 0.13 5.48 1.91 ± 0.15 7.83 2.10 ± 0.07 3.26
RSD: relative standard deviation (expressed in %).
420
3.4. Evaluation of the biological activities of the extracts relevant to cosmetic
421
To evaluate the influence of the extraction process, to ensure that the biological activity is
422
retained during this process and to correlate the biological activity with the phytochemicals of the
423
extract, we next determined the antioxidant and anti-aging potential relevant to cosmetic of each of
424
the 27 run ID. Indeed, SILM and its flavonolignans have received a recent interest for their potent
425
antioxidant and anti-aging activities relevant to cosmetic [14–19].
426
CUPRAC assay have been reported to effectively evidence the antioxidant activity of milk thistle
427
extracts [20]. Here, the antioxidant activity evaluated by the CUPRAC assay ranged from 51.33 (run
428
ID#10 – SILM content of 3.21 mg/g DW) to 183.80 (run ID#26 – SILM content of 17.98 mg/g DW) µM
429
AEAC (Figure 5, Table S4). Oxidative stress has been associated with aging and could lead to the
430
formation of advanced glycation end products (AGEs) [42]. Here, the strong inhibition of AGEs
431
formation confirmed the antioxidant capacity of these extract evidenced by the CUPRAC assay. The
432
inhibition of AGEs formation ranged from 6.64 (run ID#13 – SILM content of 1.80 mg/g DW) to 74.31
433
(run ID#26 – SILM content of 17.98 mg/g DW) % of inhibition (Figure 5, Table S4). A strong significant
434
correlation was observed between SILM content and CUPRAC antioxidant activity (PCC=0.862) as
435
well as between SILM content and AGEs inhibitory action (PCC=0.997) (Table 6).
437
Figure 5. Heatmap showing the phytochemical composition and biological activities relevant to cosmetic of the
438
27 extracts from S. marianum (L.) mature fruit following USE. Two antioxidant assays were conducted: CUPRAC
439
(expressed as ascorbic acid equivalent antioxidant capacity (AEAC, in µM AEAC)) and the inhibition of
440
advanced glycation end product (AGE) formation (expressed in % of inhibition relative to a control obtained by
441
measuring the activity of the corresponding extraction solvent). Two anti-aging assays were conducted by
442
determining the inhibition activity of each extracts toward collagenase (COL) and elastase (ELA) enzymes
443
(expressed in % of inhibition relative to a control obtained by measuring the activity of the corresponding
444
extraction solvent).
445
446
Table 6: Pearson coefficient correlation (PCC) linking SILM and its constituents to their antioxidant
447
and anti-aging activities.
448
SILM TAX SILC SILD SILA SILB ISILA ISILB
CUPRAC 0.862*** 0.500* 0.768* 0.776* 0.806* 0.887* 0.827** 0.697* AGE 0.997*** 0.604* 0.930** 0.942** 0.976* 0.979*** 0.960** 0.766* COLA 0.976** 0.659** 0.957** 0.927** 0.968** 0.928*** 0.908** 0.801* ELA 0.922** 0.702** 0.893** 0.843* 0.910** 0.894* 0.830* 0.843*
*** significant p < 0.001; ** significant p < 0.01; * significant p < 0.05
449
All the SILM constituents were also correlated to these antioxidant activities (Table 6). The SILM
450
content and composition of wild ecotypes of S. marianum from Pakistan have been correlated with
451
their antioxidant activity measured by CUPRAC assay [14]. Natural antioxidant have attracted a
452
growing interest over the last decade because of their possible use as alternative to the potentially
453
harmful, synthetic antioxidant like butylated hydroxyanisole (BHA) or butylated hydroxytoluene
454
(BHT) in different formulations [43–45]. Recently, a SILB palmitate derivative has been synthesized
455
and displayed a pronounced anti-lipoperoxidant activity, inhibiting the formation of conjugated
456
diene production in two different lipophilic media (bulk oil and o/w emulsion) subjected to
457
accelerated storage test [45]. Here, this antioxidant action in vitro is further confirmed by the CUPRAC
458
assay correlated to the SILM and SILB contents. In addition, oxidative stress has been associated with
459
aging and age-related diseases [46], in particular leading to the formation of AGE [47]. The ability of
460
natural compounds to inhibit their formation have therefore attracted increasing attention in
461
cosmetic. The high inhibition of AGE formation correlated with SILM content, in particular with SILA
462
and SILB which is of special interest for future applications.
463
1 2 3 4 5 6 7 8 9 10 11 12 13 14 15 16 17 18 19 20 21 22 23 24 25 26 27
SILM
TAX SILD SILC SILA SILB ISILA ISILB
CUPRAC AGE
COLA ELA
SILM: 2 18 mg/g DW FLAVO: 0 8 mg/g DW CUPRAC: 50 200 AEAC AGE/AGING: 0 75 % inhibition
▼ ▼
FL
A
VO
A
G
IN
G
Run ID#
A
N
TI
O
Next step was to evaluate the inhibitory activity of the extracts toward collagenase and elastase.
464
Indeed, the potent inhibitory action of SILM and its flavonolignans toward these enzymes has been
465
recently evidenced [15]. A strong inhibitory effect was observed for collagenase, whereas it was less
466
marked for elastase (Figure 5, Table S4). Indeed, collagenase inhibition ranged from 4.21 (run ID#16
467
– SILM content of 2.49 mg/g DW) to 49.13 (run ID#26 – SILM content of 17.98 mg/g DW) % of
468
inhibition, while, elastase inhibition ranged from 6.84 (run ID#13 – SILM content of 1.80 mg/g DW)
469
to 22.93 (run ID#26 – SILM content of 17.98 mg/g DW) % of inhibition. However, a strong significant
470
correlation was measured for both enzymatic inhibitory action with SILM content (Table 6). Elastase
471
and collagenase are enzymes acting on the remodelling and/or degradation of the extracellular matrix
472
components in the dermis, thus potentially leading to skin alterations such as skin tonus decrease,
473
formation of deep wrinkles and resilience losses [48–50]. Our results confirmed the potential of
474
silymarin and its constituent as inhibitor of collagenase, and to a less extend elastase. Work aiming
475
at elucidating the inhibition mechanism of each flavonolignans would be of particular interest for
476
future applications.
477
478
3.5. Comparison with Conventional Maceration Protocol
479
To evaluate the efficiency of the present optimized green US extraction procedure, we compare
480
it with a conventional heat reflux extraction method. For this purpose, we used the same aqueous
481
ethanol concentration of 54.5 % (v/v), extraction duration of 60 min, temperature of 45 °C and L/S
482
ration of 25:1. The difference between the two extractions was the application of US frequency at 30
483
kHz for the optimized US extraction procedure, while for maceration a classical water bath (i.e. no
484
US applied) was used. The results of these extractions are presented in Table 7.
485
486
Table 7: Comparison between conventional the present optimized ultrasound-assisted extraction vs
487
conventional heat reflux method.
488
USE Maceration (MAC) USE/MAC Ratio SILM 20.28 ± 0.41 3.40 ± 0.14 5.96***
SILC 2.40 ± 0.13 0.94 ± 0.04 2.56*** SILD 1.93 ± 0.06 0.68 ± 0.04 2.84*** SILA 1.06 ± 0.03 0.11 ± 0.02 9.32*** SILB 8.43 ± 0.13 1.31 ± 0.04 6.41*** ISILA 4.17 ± 0.13 0.30 ± 0.01 13.84*** ISILB 2.29 ± 0.12 0.06 ± 0.01 40.37***
Values are the mean ± RSD of three independent replicates expressed in mg/g DW. *** indicate significant
489
differences (p < 0.001) between conditions
490
491
The results of these two different extraction processes demonstrated that the application our
492
USE protocol resulted in a significant ca 6-times gain in SILM extraction yield compared to
493
maceration. The gains in extraction yields ranged from 2.56 for SILC to 40.37 for ISILB (Table 7). Note
494
that higher extraction yields were obtained when increasing the extraction duration of maceration,
495
but still without reaching values observed with the USE (data not shown). This protocol is therefore
496
of special interest, in the context of green chemistry, in term of reducing energy consumption by
497
using this innovative technology, but also for industrial process. It allows high extraction yields of
498
milk thistle flavonolignans with a reduced extraction costs (reduction in terms of treatment duration
499
and solvent consumption). This efficiency of USE could be a consequence of the hot spot hypothesis:
500
cavitation bubbles acting as a microreactor generating a high temperature and pressure local
501
environment in the surrounding liquid after their collapse resulting in a more efficient rupture of the
502
plant tissue, and therefore a more efficient release and solubilization of the phytochemicals [36].
3.6. Comparison of the SILM variations in commercial cultivars vs wild ecotypes
505
Taking advantage of this optimized and validated USE protocol, we finally applied it to compare
506
the content and composition of SILM of 4 commercial cultivars. The results of these extractions are
507
presented in Table 8.
508
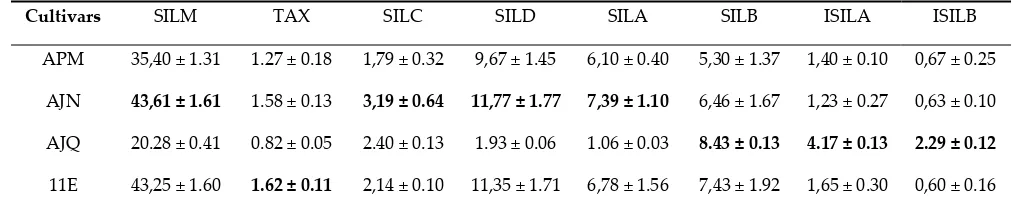
Table 8: Contents of SILM constituents of 4 French commercial milk thistle cultivars.
509
Cultivars SILM TAX SILC SILD SILA SILB ISILA ISILB
APM 35,40 ± 1.31 1.27 ± 0.18 1,79 ± 0.32 9,67 ± 1.45 6,10 ± 0.40 5,30 ± 1.37 1,40 ± 0.10 0,67 ± 0.25
AJN 43,61 ± 1.61 1.58 ± 0.13 3,19 ± 0.64 11,77 ± 1.77 7,39 ± 1.10 6,46 ± 1.67 1,23 ± 0.27 0,63 ± 0.10
AJQ 20.28 ± 0.41 0.82 ± 0.05 2.40 ± 0.13 1.93 ± 0.06 1.06 ± 0.03 8.43 ± 0.13 4.17 ± 0.13 2.29 ± 0.12
11E 43,25 ± 1.60 1.62 ± 0.11 2,14 ± 0.10 11,35 ± 1.71 6,78 ± 1.56 7,43 ± 1.92 1,65 ± 0.30 0,60 ± 0.16
Values are the mean ± RSD of three independent replicates expressed in mg/g DW.
510
AJN cultivar is the richest in SILM contents, and accumulated the highest contents in SILC, SILD
511
and SILA, whereas AJQ was the richest in SILB, ISILA and ISILB. The highest accumulation in TAX
512
was measured in 11E. Here, we observed quite restricted variation ranges compared to our previous
513
study with wild ecotypes from Pakistan [14]. It is accepted that the SILM content and composition
514
could vary according to both genetic background and culture conditions [14,51–53]. Strong variations
515
in SILM content and composition was reported for wild ecotypes from Egypt [54], Iran [52], Greece
516
[55] as well as from Poland, Hungary, Bulgaria, and Germany [51]. Culture conditions of the
517
commercial crop are probably more homogenous than natural conditions which could partly explain
518
this led wide range of contents. Here the observed stability in the SILM contents and composition is
519
an important feature for these established cultivars cultivated for commercial purposes. However,
520
the information on the wide range of variations observed in wild ecotypes in relevant for the
521
generation of new cultivars in future breeding strategies for more specific applications.
522
523
4. Conclusions
524
Silybum marianum (L.) (milk thistle) constitutes a unique source of silymarin (SILM), and thus is
525
an attractive starting material for their extraction. SILM is a mixture of flavonolignans accumulated
526
in the mature fruits of S. marianum. These compounds have attracted a recent interest for cosmetic
527
applications, and therefore deserve the development of optimized and validated green extraction
528
process. Here, we developed an ultrasound-assisted extraction (UAE) of SILM from mature fruits of
529
S. marianum using a design of experiment strategy. The optimal conditions for UAE were: aqueous
530
EtOH 54.5% (v/v) as solvent, an ultrasound frequency of 36.6 kHz during an extraction time of 60
531
min, at a temperature of 45°C and with a liquid to solid ration of 25:1 ml/g DW. Following
532
optimization, the extraction method was validated according to international standards of the
533
association of analytical communities (AOAC) in order to ensure its precision and accuracy for the
534
quantitation of the individual silymarin components. The efficiency of UAE allowed substantial gains
535
in terms of extraction yields of flavonolignans in comparison to maceration of the same duration. It
536
also allows an efficient extraction in a reduced extraction time. Thus, the present method is of
537
particular interest in a green chemistry context in terms of reducing energy consumption and with
538
the use of a green solvent. High antioxidant capacity of the extracts was evidenced by the in vitro
539
CUPRAC assays and inhibition of advanced glycation end products (AGEs). The skin anti-aging
540
action was also confirmed by the strong in vitro inhibition capacity of the obtained extract against
541
collagenase and elastase enzymes. The procedure presented here allows a green efficient extraction
542
of native bioactive flavonolignans from the fruits of S. marianum with potent antioxidant and
anti-543
aging activities. Altogether these results prove that the US extraction method presented here resulted
544
in high extraction capacity of SILM and its constituents, but also that the native biological activities
of these compounds is retained during extraction. We anticipate that it could allow fast, easy efficient
546
and reproducible extraction of these compounds for future cosmetic applications.
547
Supplementary Materials: The following are available online at www.mdpi.com/xxx/s1, Figure S1 Biplot
548
representation of the linear relation between predicted vs measured SILM contents in the 27 sample extracts.
549
Light blue contours represented p = 0.05. Figure S2 3D plots from the model predicted TAX extracted quantities
550
from mature fruits of S. marianum as a function of (a) ethanol concentration and ultrasound frequency, (b) ethanol
551
concentration and extraction duration, and (c) ultrasound frequency and extraction duration. Figure S3 3D plots
552
from the model predicted SILC extracted quantities from mature fruits of S. marianum as a function of (a) ethanol
553
concentration and ultrasound frequency, (b) ethanol concentration and extraction duration, and (c) ultrasound
554
frequency and extraction duration. Figure S4 3D plots from the model predicted SILD extracted quantities from
555
mature fruits of S. marianum as a function of (a) ethanol concentration and ultrasound frequency, (b) ethanol
556
concentration and extraction duration, and (c) ultrasound frequency and extraction duration. Figure S5 3D plots
557
from the model predicted SILA extracted quantities from mature fruits of S. marianum as a function of (a) ethanol
558
concentration and ultrasound frequency, (b) ethanol concentration and extraction duration, and (c) ultrasound
559
frequency and extraction duration. Figure S6 3D plots from the model predicted SILB extracted quantities from
560
mature fruits of S. marianum as a function of (a) ethanol concentration and ultrasound frequency, (b) ethanol
561
concentration and extraction duration, and (c) ultrasound frequency and extraction duration. Figure S7 3D plots
562
from the model predicted ISILA extracted quantities from mature fruits of S. marianum as a function of (a) ethanol
563
concentration and ultrasound frequency, (b) ethanol concentration and extraction duration, and (c) ultrasound
564
frequency and extraction duration. Figure S8 3D plots from the model predicted ISILB extracted quantities from
565
mature fruits of S. marianum as a function of (a) ethanol concentration and ultrasound frequency, (b) ethanol
566
concentration and extraction duration, and (c) ultrasound frequency and extraction duration. Table S1 Results
567
of full factorial design experiments for the extraction of TAX, SILC, SILD, SILA, SILB, ISILA and ISILB from
568
mature fruits of S. marianum. Table S2 Values, standard deviations and statistical analysis of the regression
569
coefficients for the TAX, SILC, SILD, SILA, SILB, ISILA and ISILB extraction yield from mature fruits of S.
570
marianum as a function of the 3 different variables (X1: ethanol concentration, X2: ultrasound frequency and X3:
571
extraction duration). Table S3 ANOVA results of the TAX, SILC, SILD, SILA, SILB, ISILA and ISILB extraction
572
models. Table S4 Individual antioxidant and anti-aging activities of the 27 US extract samples.
573
Author Contributions: conceptualization, C.H. and E.La.; methodology, S.D., E.Le., L.G. and D.T.; formal
574
analysis, C.H.; investigation, S.D., E.Le., L.G., D.T. and A.K.; resources, C.H.; data curation, C.H., D.T., B.H.A
575
and E.La.; writing—original draft preparation, C.H.; writing—review and editing, C.H., E.La., D.T., A.K. and
576
B.H.A; visualization, S.D. and C.H.; supervision, C.H. and E.La.; project administration, C.H.; funding
577
acquisition, C.H.
578
Funding: This research was part of the MariLine program focusing on the cosmetic application of the milk thistle
579
flavonolignans, supported by Cosmetosciences, a global training and research program dedicated to the
580
cosmetic industry. Located in the heart of the cosmetic valley, this program led by University of Orléans is
581
funded by the Region Centre-Val de Loire.
582
Acknowledgments: S.D. and L.G. acknowledge research fellowships of Loire Valley Region. D.T. gratefully
583
acknowledges the support of French government via the French Embassy in Thailand in the form of Junior
584
Research Fellowship Program 2018. B.H.A. gratefully acknowledges the support of Cosmetosciences and Le
585
Studium Institute for Advance Study International Research Fellow funded by Region Centre-Val de Loire.
586
Conflicts of Interest: The authors declare no conflict of interest. The funders had no role in the design of the
587
study; in the collection, analyses, or interpretation of data; in the writing of the manuscript, or in the decision to
588
publish the results.
589
590
References
591
1. Corchete, P. Silybum marianum ( L .) Gaertn : the Source of Silymarin. In Bioactive Molecules and Medicinal
592
Plants; Ramawat, K.G., Merillon, J.M., Eds.; Springer, Berlin, 2008; pp. 123–148 ISBN 9783540746034.
593
2. Kurkin, V.A. Saint-Mary thistle : A source of medicinals. Pharm. Chem. J.2003, 37, 25–32.
594
3. Gažák, R.; Walterová, D.; Křen, V. Silybin and Silymarin – New and Emerging Applications in Medicine.
595
Curr. Med. Chem.2007, 14, 315–338.
596
4. Pelter, A.; Hansel, R. The structure of silybin (Silybum substance E6), the first flavonolignan. Tetrahedron
597
Lett.1968, 1, 2911–2916.
598
5. Torres, M.; Corchete, P. Gene expression and flavonolignan production in fruits and cell cultures of