Presentation a new method for determining of bridge
condition index by using analytical hierarchy process
Saeid Darban
1, Hosein Ghasemzadeh Tehrani
2, Nader Karballaeezadeh
2*1 Department of Engineering, Islamic Azad University of Shahrood, Shahrood, P.O.B. 3619943189, Iran 2 Department of Civil Engineering, Shahrood University of Technology, Shahrood, P.O.B. 3619995161, Iran * Corresponding author, e-mail: [email protected]
Abstract
This paper proposes a method for determining the bridge condition index (BCI) in concrete bridges, which is based on the views of bridge experts. First, eight indices were defined for a concrete bridge including structure, hydrology, safety, load impact, geotechnical and seismicity, strategic importance, facilities, and finally traffic and pavement. Each index consists of several sub-indices. Next, a series of questionnaires about the relative importance of indices and their sub-indices were prepared and distributed among bridge experts. Experts’ views were analyzed by Expert Choice software and the relative importance (weight) of each index and each sub-index was determined using the analytical hierarchy process (AHP). Then, based on experts’ views, an average score was assigned to each sub-index for any condition. Now the bridge inspectors can examine the bridge and determine the scores of sub-indices. Each index’s score is the sum of the weighted score assigned to its’ sub-indices and BCI is the sum of weighted scores assigned to indices. Higher values of BCI indicate a better condition. Therefore, bridges with lower BCI take priority in maintenance activities. To apply the proposed method, five bridges were selected in Semnan province, Iran, and BCI calculation of these bridges were conducted.
Keywords
transportation infrastructure, bridge management system, concrete bridges, bridge condition index, analytical hierarchy process, expert system
1 Introduction
The transportation system is one of the prerequisites of national economic development, and a large portion of national resources of each country is invested in this area.
The economic importance of a country is heavily influenced by the quality and quantity of its transportation system. The transportation system consists of various components
(roads, bridges, railways, etc.), among which bridges play a major role[1]. The bridge conditions in the transportation networks are so important that the costs incurred by out of
service bridges are exorbitant. Therefore, repair and maintenance of operating bridges is integral to management plans. In light of the above points and the economic
constraints of responsible organizations, further attention should be paid to the development of a Bridge Management
System (BMS)[2].
The first step in the BMS is to prepare a technical profile for all bridges in the network. This profile contains
technical information such as the name of a bridge, its location, construction method, etc. It is in fact the starting point of BMS. The next step in BMS is assessment, including structural and seismic assessment, hydrological
assessment, facility evaluation, safety assessment and
pavement and traffic evaluation. Bridge inspection methods are divided into four general categories: 1. Visual assessment, 2. Evaluation by non-destructive tests, 3. Sampling and destructive tests, and 4. Health assessment.
Another major step of BMS is bridge maintenance. The maintenance involves a variety of operations that continuously ensure the safety and serviceability of a bridge
over its lifetime. The prioritization of bridge maintenance, including repairs or reinforcement, is the cornerstone of the BMS. Traditionally, the prioritization of bridge
maintenance projects was carried out based on engineer’s assessment for small-sized bridges and for large and old bridge networks, it was conducted in accordance with
concepts and principles of optimization in project budget allocation. Today, the bridge condition index (BCI) is used
for this purpose. BCI is a good benchmark for prioritizing BMS[3].
In this paper, the main goal is to present a new method
for determining concrete bridges condition index in Iran. For this purpose, first eight indices were selected. These indices consisted of structure, hydrology, climate and hydrology, safety, load impact, geotechnical and seismicity,
strategic importance, facilities, and finally traffic and
pavement. Each index comprises of a number of sub-indices. In the next step, a series of questionnaires were developed, which contained questions about the relative importance of the indices and their sub-indices, and distributed among bridge experts. Experts’ views and feedbacks were analyzed by Expert Choice software and the relative importance (weight) of each index and each sub-index was determined using analytical hierarchy process (AHP). In the end, bridge experts filled another questionnaire related to condition score of each sub-index, which was equal to the average of scores assigned by all experts. The score of each index is the sum of condition scores assigned to its sub-indices. This score is multiplied by weight index. Finally, BCI is calculated as the sum of weighted scores assigned to indices. BCI is a value between 0 and 100, with higher values indicating a better bridge condition. Therefore, bridges with lower BCI take priority in terms of repair and maintenance. To test the proposed method in practice, five bridges in Semnan province, in Iran, were inspected and their BCI was determined to prioritize bridges in terms of maintenance requirements.
This paper is organized as follows: Next section presents a literature review of BCI. Section "Methodology" introduces the study methodology, which is further divided into three general sections entitled BCI, AHP, and sub-indices. The results are presented and discussed in section "Result and discussion". Final section offers a summary of
results and conclusions.
2 Literature review
Sanjay and Kumar developed a BHI using AHP. They divided the elements of a bridge into seven broad
categories. Then, they drafted a questionnaire and distributed it among engineers and experts. The results of the questionnaire were incorporated in determining the
relative importance of diverse bridge elements and their importance weight. They also considered a numerical value for each type of damage. The condition of various bridge
elements was assessed by visual inspection. Finally, BHI was developed by summing the score of all bridge
elements[4]. In the Fig. 1, the decision tree of this research is presented.
Fig. 1 Decision tree in Sanjay and Kumar research[4]. The Ministry of Transport of the People’s Republic of China uses Dr index to assess the conditions of a bridge.
This index, which is derived from aggregating the weights of various bridge elements is presented in Eq. (1)[5]:
𝐷𝑟= 𝐵𝐷𝐶𝐼 × 𝑊𝐷+ 𝑆𝑃𝐶𝐼 × 𝑊𝑆𝑃+ 𝑆𝐵𝐶𝐼 × 𝑊𝑆𝐵 (1)
where Dr is bridge condition rating, BDCI is bridge Deck Condition Index, SPCI is bridge Superstructure Condition Index, SBCI is bridge Substructure Condition Index, WD,
WSP, and WSB are the weight of BDCI, SPCI, and SBCI indicators, respectively.
It should be noted that the Ministry of Housing and
Urban-Rural Development of China has also provided a definition identical to Eq. 1 for assessing bridge conditions, which is shown in Eq. (2) [6]:
𝐵𝐶𝐼 = 𝐵𝐶𝐼𝑑× 𝜔𝑑+ 𝐵𝐶𝐼𝑠𝑝× 𝜔𝑠𝑝+ 𝐵𝐶𝐼𝑠𝑏× 𝜔𝑠𝑏 (2)
where BCI is bridge conditions index, BCId is bridge deck condition index, BCIsp is bridge superstructure condition index, BCIsb is bridge substructure condition
index and ω – the weight of a bridge element.
The bridge condition can be classified into grades A, B, C, D, and E, or range of 1 to 5 according to Dr and BCI
indices. The above classification is shown in Table 1.
Table 1 Assessment of bridge condition based on Dr and BCI indices in China[5, 6].
Ministry of Transport of the People’s Republic of China
Rate Dr condition
1 95 ≤ Dr< 100 Perfect
2 80 ≤ Dr< 95 Minor damage, no effects on its function
3 60 ≤ Dr< 80 Mediate damage, but still functional
4 40 ≤ Dr< 60 Great damage, affecting bridge functions
5 0 < Dr< 40
Table 1 Continued.
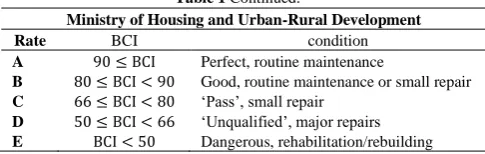
Ministry of Housing and Urban-Rural Development
Rate BCI condition
A 90 ≤ BCI Perfect, routine maintenance
B 80 ≤ BCI < 90 Good, routine maintenance or small repair C 66 ≤ BCI < 80 ‘Pass’, small repair
D 50 ≤ BCI < 66 ‘Unqualified’, major repairs E BCI < 50 Dangerous, rehabilitation/rebuilding
In Japan, no specific formula or equation is used to evaluate the condition of a bridge. For each bridge, first one of status shown in Table 2 is assigned to each element based on the assessment of the bridge inspector, and then the bridge general conditions are described in accordance with Table 3 [7].
Table 2 Assessment of maintenance urgency for bridge element in Japan[7].
Rate Condition
A No repair needed
B No immediate repairs needed
C1 Immediate repairs needed from standpoint of preventative
maintenance
C2 Immediate repairs needed from standpoint of structural safety
E1 Immediate actions needed from standpoint of structural safety
E2 Immediate actions needed in tandem with other factors
M Repairs needed during regular maintenance work
S1 In-depth investigations needed
S2 Follow-up investigations needed
Table 3 Bridge soundness in Japan[7].
State Condition Description
1 Good No problems in bridge’s functions
2 Preventative
maintenance
No problems in bridge’s functions but maintenance required from standpoint of preventive maintenance
3 Early action Possibility of problems in bridge’s
functions, need for early action
4 Emergency
action
Possibility of problems or existing problems in bridge’s functions, need for emergency actions
In Korea, a damage index (DI) is used to assess bridge conditions. It is the normalized index obtained from the evaluation of all bridge elements. The DI index is shown in Eq. (3) [8]:
{𝐷𝐼 =
1
100∑ (𝐶𝑅𝑖× 𝑊𝐹𝑖)
𝑛 𝑖=1
∑𝑛𝑖=1(𝑊𝐹𝑖)= 100
(3)
where DI is damage index, CRi is condition evaluation of ith element and WFi is the weight factor of ith element.
Based on the DI index, a bridge condition could be described with grades A to E. Table 4 displays this classification.
Table 4 Assessment of bridge condition in Korea[8].
Rate DI Description
A 0 ≤ DI < 0.13 Perfect
B 0.13 ≤ DI < 0.26 Minor problem in secondary elements C 0.26 ≤ DI < 0.49 Minor problem in primary elements D 0.49 ≤ DI < 0.79 Problem in primary elements E 0.79 ≤ DI Serious problem in primary elements
The California Department of Transportation (Caltrans) defines BHI according to Eq. (4). This index varies from 0 for the worst bridge condition to 100 for the healthiest bridge condition[9].
𝐵𝐻𝐼 =∑ 𝐶𝐸𝑉
∑ 𝑇𝐸𝑉× 100 (4)
where BHI is bridge Health Index, CEV is current element value and TEV is total element value.
CEV and TEV can be calculated according to the following equations[9]:
𝐶𝐸𝑉 = ∑(𝑄𝐶𝑆𝑖× 𝑊𝐹𝑖) × 𝐹𝐶 (5)
TEV = TEQ × FC (6)
where TEQ is total element quantity, FC is failure costs of element, QCSi is quantity in condition state I and WF is weight factor.
In the United States, transportation departments report a set of data called national bridge inspection (NBI). Based on the physical condition of the bridge, the bridge is assigned score in the range of 0 to 9 [10]. The assessment procedure is presented in Table 5.
Table 5 Assessment of bridge condition based on NBI[10]
Rate State Description
9 Excellent A new bridge
8 Very good No problems noted
7 Good Some minor problems
6 Satisfactory Structural elements show some minor
deterioration
5 Fair
All primary structural elements are sound but may have minor section loss, deterioration, spalling or scour
4 Poor Advanced section loss, deterioration, spalling,
scour
3 Serious
Loss of section, etc., has affected primary structural components; Local failures are possible. Fatigue cracks in steel or shear cracks in concrete may be present
2 Critical
Advanced deterioration of primary structural elements. Fatigue cracks in steel or shear cracks in concrete may be present or scour may have removed structural support. Unless closely monitored it may be necessary to close the bridge until corrective action is taken
1 Imminent
failure
vertical or horizontal movement affecting structural stability. Bridge is closed to traffic but corrective action may allow it to be returned to light service
0 Failed Out of service. Beyond corrective action
The US Departments of Transportation often uses a computer program to assess bridge conditions. This program is based on Eq. (7)[10].
𝑆𝑅 = 𝑆1+ 𝑆2+ 𝑆3− 𝑆4 (7)
where SR is Sufficiency rating, S1 is the parameter related to structural safety, S2 is the parameter related to bridge serviceability and functionality, S3 is the parameter related to user requirements and S4 is the parameter related to reductive coefficients based on structure type and traffic safety.
SR indicates the bridge sufficiency to remain in service, where SR has a maximum rating of 100%, indicating complete bridge sufficiency, and a minimum rating of 0%, indicating complete bridge deficiency. The parameters S1,
S2, S3 and S4 have a weight importance of 55%, 30%, 15%
and 13%, respectively. FHWA uses SR to allocate rebuilding funds so that[10]:
• If SR <50, the bridge is eligible for replacement;
• If 50 <SR<80, the bridge is eligible for rehabilitation. In Australia, Rashidi et al. presented a model for prioritizing bridges in terms of maintenance. This model is depicted in Eq. (8)[11]:
𝑃𝐼 = 0.6(𝑆𝐸) + 0.2(𝐹𝐸) + 0.2(𝐶𝐼𝐹) (8)
where PI is priority indexi, SE is structural efficiency index, FE is functional efficiency and CIF is client impact factor.
A bridge with higher PI takes priority for maintenance. SE is a numerical value between 1 and 4 which, can be calculated according to Eq. (9)[11]:
𝑆𝐸 =𝐶𝐹×∑𝑛𝑖=1(𝑀𝑖×𝑆𝑖×𝐸𝑆𝐶𝐼𝑖)
16𝑛 (9)
where Mi is the factor related to type of material, Si is the factor related to element importance, CF is causal factor and
ESCIi is the element structural condition index for each element of the bridge.
CF and ESCIi are obtained from Eqs. (10) and (11),
respectively[11].
𝐶𝐹 = 0.411𝐴 + 0.12𝐸 + 0.107𝑅 + 0.362𝐼 (10)
where A is age of structure, E is environmental factor, R
is road class and I is quality of inspection.
𝐸𝑆𝐶𝐼 =∑𝑛𝑖=1(𝑞𝑖×𝐶𝑖) ∑𝑛𝑖=1(𝑞𝑖)
(11)
where qi is the values reported for the bridge element under Ci conditions.
Also, FE can be calculated from Eq. (12)[11]:
𝐹𝐸 = 0.7𝐿𝐶+ 0.1𝑉𝐶+ 0.1𝑊𝑏+ 0.05𝐵𝑏+ 0.05𝐷𝑆 (12)
where LC is bridge load-bearing capacity, VC is bridge vertical clearance, Wb is width of bridge, Bb is bridge barrier and DS is bridge drainage system.
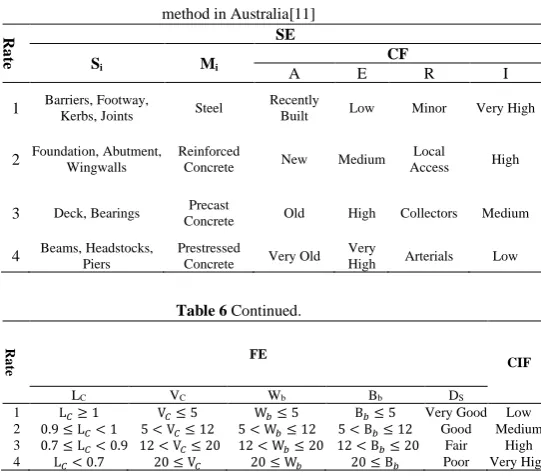
Moreover, CIF is the importance of bridge in terms of economic, social, political and historical considerations. The main reason for incorporating this parameter is to alleviate negative feedbacks from road users and their political representatives at the management level. Table 6 provides further information on the method proposed by Rashidi et al.
Table 6 Supplementary information of bridge maintenance prioritization method in Australia[11]
R
a
te
SE
Si Mi
CF
A E R I
1 Barriers, Footway, Kerbs, Joints Steel Recently
Built Low Minor Very High
2 Foundation, Abutment, Wingwalls Reinforced Concrete New Medium Local
Access High
3 Deck, Bearings Precast
Concrete Old High Collectors Medium
4 Beams, Headstocks, Piers Prestressed Concrete Very Old Very
High Arterials Low
Table 6 Continued.
Rat
e FE CIF
LC VC Wb Bb DS
1 L𝐶≥ 1 V𝐶≤ 5 W𝑏≤ 5 B𝑏≤ 5 Very Good Low
2 0.9 ≤ L𝐶< 1 5 < V𝐶≤ 12 5 < W𝑏≤ 12 5 < B𝑏≤ 12 Good Medium 3 0.7 ≤ L𝐶< 0.9 12 < V𝐶≤ 20 12 < W𝑏≤ 20 12 < B𝑏≤ 20 Fair High
4 L𝐶< 0.7 20 ≤ V𝐶 20 ≤ W𝑏 20 ≤ B𝑏 Poor Very High
In Turkey, the following technique is used for the assessment of a bridge conditions and its elements[12]:
𝐶𝑅(𝑒)𝑒𝑙𝑒𝑚𝑒𝑛𝑡,𝑊= ∑𝑆𝑗=1𝑗
∑𝑑𝑖=1(𝑊𝑃𝑑𝑡,𝑖,𝑗×𝑟𝑗)
∑𝑠𝑛=1∑𝑑𝑖=1(𝑊𝑃𝑑𝑡,𝑖,𝑛×𝑟𝑛)
(13)
𝐶𝑅(𝑏)𝑏𝑟𝑖𝑑𝑔𝑒,𝑊=
1
100∑ 𝑊𝑒× 𝐶𝑅(𝑒)𝑒𝑙𝑒𝑚𝑒𝑛𝑡,𝑊
𝑛𝑒
𝑒=1 (14)
where CR(e)element,W is weighted assessment of conditions for element e, ne is total number of bridge elements, WP(dt,i,j)
is weighted percentages for damage type i under condition j, s is total conditions, d is total number of damages, rj is damage impact distribution coefficient, CR(b)bridge,W is weighted assessment of bridge b and We is weight importance of rj element.
Fig. 2 Weight importance of elements for a conventional concrete bridge[12]
In 2015, Rashidi et al. proposed an indicator called priority index (PI). In this research, all identified parameters were weighed and eventually merged. PI is a number that enables decision makers to identify and compare the global conditions of a series of bridges in the road network. This index consisted of three main indicators[13]:
• Structural sufficiency: includes age, inspection, environment, and type of road.
• Functional sufficiency: includes load-bearing capacity, drainage system, vertical clearance, width of bridge, railings and bridge fences.
• Client Impact Factor: Includes social factors, hereditary issues, economics and political pressures. Today, artificial neural networks, fuzzy logic or a combination of both are commonly used to assess bridge conditions, but these methods have certain drawbacks[14]:
• Neural network is a powerful machine learning tool, but its inference process is similar to a black box. In addition, the calculation of neural network is highly reliant on the accuracy of samples, whereas the assessment process of bridges is inevitably associated with uncertainties.
• The fuzzy logic theory can be used to express uncertainties in a more realistic manner. In fuzzy inference, fuzzy membership functions are used to predict critical indices, but they are artificially determined in practice and inevitably affected by subjective factors.
Hanbing et al. used the optimized Fuzzy c-means clustering algorithm with Particle swarm optimisation to assess the conditions of existing reinforced concrete bridges with the aim of overcoming these deficiencies. A fuzzy clustering algorithm is a data analysis method in which the unsupervised learning method is employed to classify information into groups of identical characteristics. FCM is
a local search algorithm developed from the conventional C-means algorithm, in which the optimal solution is obtained based on the gradient descent algorithm. Therefore, the chief drawback of this method is that it is prone to local minima when the center of the primary cluster is adjacent to the local optimal condition. To address this shortcoming, researchers have proposed several artificial intelligence algorithms for optimizing FCM algorithm that enhance its function, including genetic algorithm, ant colony optimization algorithm and particle swarm optimization algorithm, among other things[15].
Hanbing et al. first defined an index system for assessing elements of reinforced concrete bridges. Meanwhile, a number of old bridges (training) were selected as clustering goals. Then, for these samples, the number of optimum clusters was determined based on the Xie-Beni’s validity index. They also computed cluster centers and fuzzy membership matrices based on the fuzzy c-mean clustering optimized by particle swarm optimization (FCM-PSO) algorithm. In the next step, the score of conditions and the corresponding cluster centers were determined according to technical conditions of the bridge. Finally, the experimental sample conditions were evaluated by fuzzy membership clustering[16].
The service life of a bridge is divided into four different phases[17]:
• Design and construction
• Start of damages (early damage stages)
• The spread of damages
• The expansion of damages
Under the famous Law of Five, each dollar spent on the first phase will equal $5 in the second phase, $25 in the third phase, and $125 in the fourth phase[17]. According to this
law, any miscalculated decisions about Maintenance, Repair and Rehabilitation (MR&R) in bridges would incur surplus costs. With this in mind, there is a need for Decision
Support System (DSS). The aim of DDS is to improve and enhance the bridge network and to allocate budget appropriately[18]. Most of BMSs are founded upon
processes that optimize the cost of a lifecycle and tend to overlook factors such as environmental impacts and social
impacts. This gives rise to a number of problems, especially when the existing financial resources are higher or lower than the cost of computational life cycle[19].
two conventional decision-making methods, AHP and SMART, they used a simplified hierarchical analysis process to make decisions about repairing and reconstruction of concrete bridges. Their goal was to retain bridges at acceptable safety and service levels. In the S-AHP method, the problem is modeled in a hierarchical order. This hierarchy consists of at least three main levels: 1. Goal, 2. Criteria and 3. Alternative[20]. Fig. 3 illustrates this structure in the research of Rashidi et al.
Fig. 3 AHP structure in the research of Rashidi et al. [20]. The indicators considered by Rashidi et al. in implementing S-AHP consisted of service life, safety, costs, environmental impact, traffic disruption and political issues and laws[20].
3 Methodology
3.1 Bridge condition index (BCI)
One of the major concerns of organizations in charge of bridges is that repairs and maintenance of bridges should be implemented with respect to financial constraints. The bridge maintenance is a costly and long-term project, which has led to the development of various scientific tools and methods for optimal budget allocation. Before allocating any budget, it is necessary to determine the current condition of the bridge and its present and possibly future needs. The key to successful assessment of a bridge condition is to recognize various damages. Bridge damage is a slow, progressive and continuous process that is influenced by the imposing load, conditions of various bridge components, environmental factors and the properties of materials[4].
Many researchers have argued that the damage process is a blend of several mechanisms, such as corrosion, creep, shrinkage, cracking, fatigue, etc. [21]. The bridge damage is induced by a host of factors such as traffic, rainfall, freezing and melting cycles, climate change and pollution, which can eventually lead to bridge failure[4]. The bridge failure can be either structural or functional. The methods
for assessing various components of a bridge and their relative significance are key concepts in BMS[22].
Different countries employ diverse methods to evaluate bridges so that they can develop a priority plan for bridge repair and maintenance with respect to budget constraints. Using a series of indicators is one of the most commonly used decision-making methods to prioritize maintenance. One perquisite of such indicators is determining the relative importance of different bridge components. Indicators can be categorized into two broad categories[4]:
1. Bridge Health Index (BHI) 2. Maintenance Priority Index (MPI)
The BHI is generally calculated as follows[4]:
𝐵𝐻𝐼 = ∑𝑛𝑖=1𝑊𝑖× 𝐶𝑖 (15)
where BHI is bridge health index, Wi is the weight of ith
element, Ci is the condition of ith element and n is the
number of bridge elements.
Moreover, MPI is usually calculated using the following equation[23]:
MPI = ∑ Ki i× Fi(a, b, c, … ) (16)
where MPI is maintenance priority index, Ki is the weight of ith damage, Fi is ith damage and a, b, c, etc. are
damage characteristics.
3.2 Analytical hierarchy process (AHP)
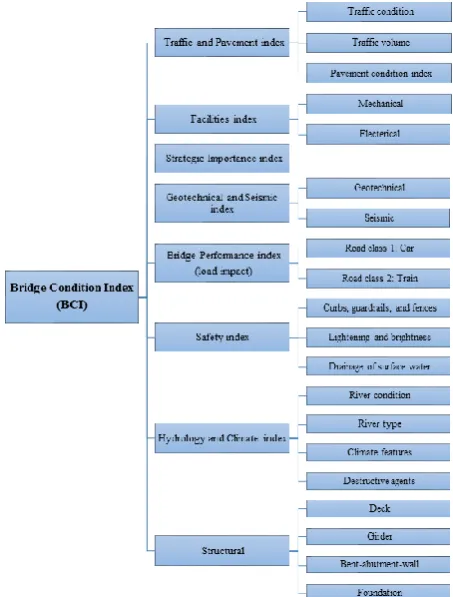
The purpose of this study is to present a Bridge Condition Index (BCI) for evaluating and prioritizing MR&R programs. For this purpose, at first eight indices
affecting the quality of the bridge are introduced: Structural index, Hydrology and Climate index, Safety index, Bridge Performance index (load impact), Geotechnical and
Seismic index, Strategic Importance index, Facilities index, and Traffic and Pavement index.
To determine BCI, we need to evaluate the relative
importance of these Indices. In this study, the relative importance of indices is expressed in terms of weights, which are measured using Analytical Hierarchy Process
(AHP) method. AHP is an analytical method that allows making appropriate decisions by considering qualitative, quantitative and mixed criteria. This is based on a dual
comparison system that allows users to obtain indicators and select the target[24]. In cases where AHP is used for
decision-making, first a proper hierarchy tree should be designed. This hierarchy tree has different levels depending on the type of problem under investigation. The first level
Fig. 4 Initial decision tree in this study.
In the next step, a series of questionnaires about the relative importance of indices are designed and distributed among experts. The experts group participating in this study comprises of a number of specialists and advisors involved in maintenance and reinforcement of bridges as well as university professors with relevant expertise. In these questionnaires, which are in form of tables, experts are asked to assign a value between 0 to 10 based on their technical experience and expertise to dual comparisons in each row of the table. Table 7 shows the final results of this survey. Each table cell displays the relative importance of a row proportional to its corresponding column.
Table 7 Relative importance of indices based on a survey of experts.
Index S tr u c tu ral Hyd rolo gy an d Cl im a te S af et y B rid ge P er for m an ce (load im p ac t) Geot ec h n ical an d S eis m ic S tr at eg ic Im p or tan ce F ac il it ies T raf fic an d P ave m en t
Structural 1 5.271 3.152 4.581 1.877 3.13 6.075 3.578 Hydrology and Climate 1 1.037 1.382 0.788 1.377 1.871 0.941
Safety 1 2.613 1.633 1.489 3.318 2.074
Bridge Performance (load
impact) 1 0.761 1.164 2 1.154
Geotechnical and Seismic 1 2.859 3.133 2.216
Strategic Importance 1 2.766 1.75
Facilities 1 0.975
Traffic and Pavement 1
In Table 7, if a row index outweighs a column index, a value between 1 and 10, and if the column index outweighs the row index, a value between 0 and 1 is assigned and value 1 is used at the diameter of table. It should also be noted that numbers in Table 7 represent the average views of experts. In next step, values shown in Table 7 are entered in Expert Choice software to calculate the relative weights of each index (see Table 8).
Table 8 Relative weights of indices and compatibility rating
Index S tr u c tu ral Hyd rolo gy an d Cl im a te S af et y B rid ge P er for m an ce (load im p ac t) Geot ec h n ical an d S eis m ic S tr at eg ic Im p or tan ce F ac il it ies T raf fic an d P ave m en t
Relative weight 0.331 0.097 0.146 0.080 0.143 0.088 0.046 0.068
compatibility rating 0.03
As indicated in Table 8, the relative weight of indices
was calculated. This table contains additional information called compatibility rating. It is the mechanism that
determines the adaptability of comparisons, indicating the extent to which the priorities selected by the group or the priorities of the mixed table are reliable. According to the
experience, if the compatibility rate is less than 0.1, the adaptability of comparisons is acceptable; otherwise, the comparisons need be repeated.
After the relative weight of indices is determined, they are scored in terms of bridge conditions. First, each index is divided into a number of sub-indices. Fig. 5 shows the
completed decision tree in this study.
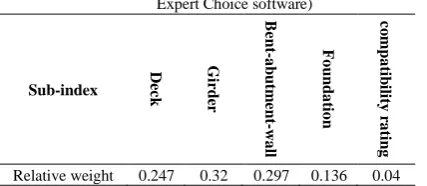
Then, all damage types are defined for each sub-index. Finally, a series of questionnaires about damage scores are designed and distributed among the experts. They express their views about damage scores based on their experience and expertise. The scores collected in this step represent the average scores of all questionnaires. The numerical values of scores are in the range of 0 to 100. This process is carried out for each sub-index and the results are presented in next subsections. With the exception of the structural index, sub-indices of each index are of the same importance. The structural index consists of four sub-indices (deck, girder, bent-abutment-wall, and foundation). To determine the relative weights of these sub-indices, a new questionnaire was designed and distributed among experts. By gathering the experts’ views and analyzing them using Experts Choice software, the relative weights of mentioned sub-indices were calculated.
In the final step, the bridge condition index can be calculated by the following Eq. (17):
BCI = ∑8i=1(Xi× Wi) (17)
where BCI is the bridge condition index, Xi is the score of ith index and Wi is the weight of ith index.
For each bridge, each sub-index score is determined based on the bridge inspection. After determining sub-indices scores, Xi is calculated for each index.
3.3 Sub-indices
3.3.1 Structural index
The structural index describes the bridge condition in terms of the damage to the structural elements of the bridge. In other words, it evaluates the structural condition of the
bridge. For structural analysis, a bridge is divided into four sub-indices including deck, girder, bent, abutment, wall and foundation. It should be noted that the joints are classified
under the deck sub-index and bearing and support in the sub-index of bent-abutment-wall.
First, the relative weights of these four sub-indices are
determined similar to relative weighting of eight main indices. Tables 9 and 10 present the relative importance and relative weight of sub-indices, respectively.
Table 9 Relative importance of sub-indices in structural index based on a survey of experts
Sub-index Deck Girder Bent-abutment-wall Foundation
Deck 1 1 0.84 1.476
Girder 1 1.644 1.94
Bent-abutment-wall 1 3.204
Foundation 1
Table 10 Relative weight of sub-indices in structural index (Results of Expert Choice software)
Sub-index
D
ec
k
Gi
rd
er
B
en
t-a
b
u
tm
en
t-w
a
ll
Fo
u
n
d
a
tio
n
co
mpa
tib
ili
ty
r
a
tin
g
Relative weight 0.247 0.32 0.297 0.136 0.04
After determining the weight importance of each of these four sub-indices, they are assigned a score based on the extent and severity of the damage. Table 11 shows the score of each sub-indices for different conditions. The scores of Table 11 are based on a survey of experts.
Table 11 Scores of Structural index based on a survey of experts
Damage intensity
Score (in the range of 0- 100)
Deck Girder
Bent-abutment-wall Foundation
Low 95 95 90 95
Mediate 70 65 60 75
High 30 30 25 35
The structural index score is the sum of weighted scores of all four sub-indices. Given that the bridge maintenance program usually includes suggestions for repairing, rehabilitation or reinforcement of bridge elements, greater attention was allocated to structural sub-indices and they
were included with greater details in the assessment. In other indices, however, evaluations were more general.
3.3.2 Hydrology and Climate Index
One of the factors determining bridge condition is
hydrology and environmental factors affecting the bridge. This index focuses on river conditions, river type, climatic features of the region, and the concentration of destructive
matters (such as sulfates) in the water, soil and air of the region. In this index, four scores for river conditions, river type, climatic features, and concentration of destructive
Table 12 Scores of hydrology and climate index based on a survey of experts (sub-indices of river conditions and river type) (in the range of 0
to 100)
River conditions River type
Description Score Type Score
There is no erosion in the riverbed or the erosion is trivial. The amount of sedimentation and debris is negligible
98
Area under the bridge is not a river path
98
The riverbed has eroded slightly. There are signs of depositions in the upstream and downstream. Further analysis is required to detect failures 58 There is seasonal river flowing under the bridge. 59
The erosion of the riverbed is critical and concerning. There are enormous amounts of
sedimentations around the bridge. Serious measures have to be taken. 14 There is permanent river flowing under the bridge. 8
Table 12 Continued.
Climatic features Destructive agents
Description Score
Quality of protection against destructive matters
Score
Mild (there are no invasive agents such as moisture, transpiration, freezing and melting cycle, corrosive substances, etc.)
93 Very good 95
Medium (conditions that are occasionally exposed to moisture and transpiration, and elements that are permanently exposed to non-invasive soils and water, or underwater with a PH>5)
80 Good 76
Severe (extreme humidity or transpiration, or freezing and thawing cycle, elements immersed in water, such that one surface is exposed to air, elements in chlorine ion air, elements exposed to corrosion caused by the use of anti-freezing agents)
54 Medium 49
Extremely severe (conditions that are exposed to gases, water and static sewage with a PH of up to 5, corrosive matters, moisture with extreme icing and melting)
35 Bad 14
Exceptionally severe (conditions subject to extreme erosion, flowing water and sewage with a maximum pH of 5)
20
It should be noted that if there is no river in the path under the bridge, the sub-indices of river conditions and destructive matters would be removed.
3.3.3 Safety index
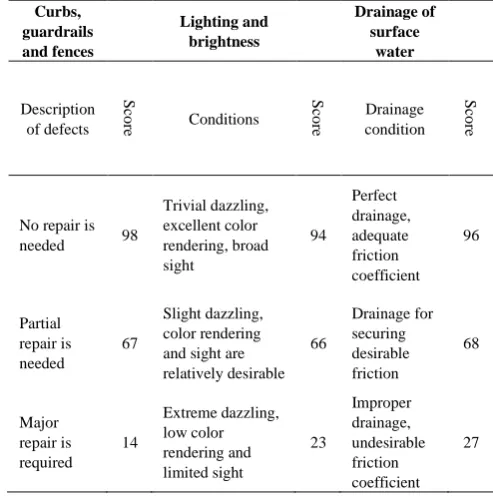
This index includes parameters that affect the safety of the bridge. Examples include the beauty and proper serviceability of curbs, absence of any crack, fracture and delaminated curbs, proper functioning of the guardrails and fences, lighting and brightness and the efficiency of the drainage system to provide sufficient friction coefficient. The score of this index was calculated based on Table 14. The safety rating score is the average score of the three sub-indices in Table 13.
Table 13 Safety index Scores based on a survey of experts (on a scale of 0- 100) Curbs, guardrails and fences Lighting and brightness Drainage of surface water Description of defects S co re Conditions S co
re Drainage condition
S
co
re
No repair is
needed 98
Trivial dazzling, excellent color rendering, broad sight 94 Perfect drainage, adequate friction coefficient 96 Partial repair is needed 67 Slight dazzling, color rendering and sight are relatively desirable 66 Drainage for securing desirable friction 68 Major repair is required 14 Extreme dazzling, low color rendering and limited sight 23 Improper drainage, undesirable friction coefficient 27
3.3.4 Load impact index
Table 14 Load impact index scores based on a survey of experts (on a scale of 0 to 100)
Road class Car Train
Freeway 40 30
Highway and major
road 45 40
Minor road 70 60
Rural road 85
Metro and monorail 70
3.3.5 Geotechnical and seismic index
The quality of soil under bridge foundation, seismicity of the region and its geological structure affect the behavior of the bridge during an earthquake and its settlement, which consequently affect the bridge condition. This index is calculated based on Table 15.
Table 15 Geotechnical and seismic index scores based on a survey of experts (on a scale of 0 to 100)
Geotechnical Seismic
Earth type Score Seismic area type Score
I 92 Low relative risk 80
II 71 Medium relative risk 63
III 47 High relative risk 40
IV 26 Very high relative risk 23
3.3.6 Strategic importance index
This index indicates the importance of the bridge location in terms of regional, strategic and political considerations. The score of this index is computed according to Table 16.
Table 16 Scores of the strategic importance index based on a survey of experts (on a scale of 0 to 100)
The importance of strategic bridge Score
High importance (links two strategic areas) 89
Medium importance (links streets and non-strategic arterial) 55
Low importance (other bridges) 29
Strategic areas include hospitals (with more than 500 beds), military centers, crisis management centers, and fire stations.
3.3.7 Facilities Index
This index is composed of two parts, mechanical facilities and electrical facilities. Facilities index, which demonstrates the need of electric or mechanical bridge facilities for repair, is computed as the mean score of mechanical and electrical facilities, which can be deduced from Table 17.
Table 17 Scores of the facilities index based on a survey of experts (on a scale of 0 to 100)
Mechanical facilities Electrical facilities
Drainage system Score Lighting condition Score
Fair 97 Good 92
Critical 62 Medium 62
Inappropriate 30 Unfair 29
3.3.8 Traffic and pavement index
One of the main parameters affecting bridge condition is traffic and pavement. The score of traffic sub-index is computed using Table 18. We also apply scores of pavement sub-index based on the PCI index. That is, the value of PCI is equal to the pavement score. Finally, the average of scores obtained from traffic and pavements indices with the same weight is derived.
Table 18 Scores of traffic sub-index based on a survey of experts (on a scale of 0 to 100)
Traffic conditions Score Traffic volume score
Very good (traffic facilities are perfectly working, full sight distance and the number of lanes is standard)
95 Low 89
Good (traffic facilities are in relatively good condition, sight distance is desirable in most areas and the number of lanes is appropriate)
74 medium 68
Moderate (Some of traffic facilities are in bad conditions and the bridge has an undesirable curve)
51 Heavy 51
Bad (lanes are not enough, traffic facilities are not working, the bridge has a horizontal and vertical curve together, the sight distance is not appropriate).
12 Very heavy 26
4 Results and discussion
In this research, five bridges in Semnan province were selected and after initial inspection, their condition index was determined using the above method. These bridges are the bridge of Shahmirzad road intersection, the bridge of Sari road intersection, the bridge on 73rd km of
Semnan-Damghan road, the bridge on 6th km of Semnan-Jandaq road
and the bridge on 12th km of Semnan-Jandaq road.
4.1 The bridge of Shahmirzad road intersection
Mashhad-Tehran highway. The bridge is 45 m in length and 23 m in width with 3 lanes in each direction. The BCI of this bridge is shown in Table 19.
Table 19 BCI calculation of Shahmirzad road intersection bridge
Index Wi Xi 𝐖𝐢× 𝐗𝐢 𝐁𝐂𝐈 = ∑(𝐗𝐢× 𝐖𝐢) 𝟖
𝐢=𝟏
1 Structural 0.331 93.765 31.036
72.849 2 Hydrology
and Climate 0.097 95.5 9.264
3 Safety 0.146 66 9.636
4 Bridge Performance (load impact)
0.08 45 3.6
5 Geotechnical
and Seismic 0.143 55.5 7.937
6 Strategic
Importance 0.088 55 4.84
7 Facilities 0.046 46 2.116
8 Traffic and
Pavement 0.068 65 4.42
4.2 The bridge of Sari road intersection
The bridge is located in the Damghan city at the
intersection of the Damghan Road and Damghan-Sari Road. It has two spans and two lanes. The bridge is 25 m in length and 9 m in width. A summary of the BCI calculation of this
bridge is prsented in Table 20.
Table 20 BCI calculation of Sari road intersection bridge
Index Wi Xi 𝐖𝐢× 𝐗𝐢 𝐁𝐂𝐈 = ∑(𝐗𝐢× 𝐖𝐢) 𝟖
𝐢=𝟏
1 Structural 0.331 93.765 31.036
73.221 2 Hydrology
and Climate 0.097 95.5 9.264
3 Safety 0.146 63 9.198
4 Bridge Performance (load impact)
0.08 45 3.6
5 Geotechnical
and Seismic 0.143 55.5 7.937
6 Strategic
Importance 0.088 55 4.84
7 Facilities 0.046 30 1.38
8 Traffic and
Pavement 0.068 87.67 5.962
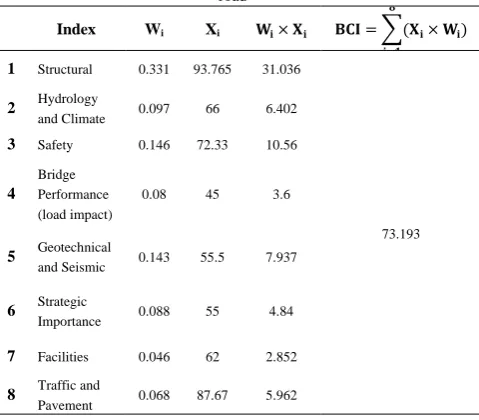
4.3 Bridge on 73rd km of Semnan-Damghan road
This bridge is located at 73rd km of Semnan-Damghan
road. The bridge has 5 spans with a total length of 60 m and
a width of 10 m in two lanes. A summary of the BCI calculation of this bridge is depicted in Table 21.
Table 21 BCI calculation of the bridge on 73rd km of Semnan-Damghan road
Index Wi Xi 𝐖𝐢× 𝐗𝐢 𝐁𝐂𝐈 = ∑(𝐗𝐢× 𝐖𝐢) 𝟖
𝐢=𝟏
1 Structural 0.331 93.765 31.036
73.193 2 Hydrology
and Climate 0.097 66 6.402
3 Safety 0.146 72.33 10.56
4 Bridge Performance
(load impact)
0.08 45 3.6
5 Geotechnical
and Seismic 0.143 55.5 7.937
6 Strategic
Importance 0.088 55 4.84
7 Facilities 0.046 62 2.852
8 Traffic and
Pavement 0.068 87.67 5.962
4.4 Bridge on 6th km of Semnan-Jandaq road
The bridge is located at 6th km of Semnan-Jandaq road.
It has one span with a length of 8 m and width of 7 m in two lanes. Table 22 shows a summary of the BCI calculation of this bridge.
Table 22 BCI calculation of the bridge on 6th km of Semnan-Jandaq road
Index Wi Xi 𝐖𝐢× 𝐗𝐢 𝐁𝐂𝐈 = ∑(𝐗𝐢× 𝐖𝐢) 𝟖
𝐢=𝟏
1 Structural 0.331 86.355 28.583
62.172 2 Hydrology
and Climate 0.097 62.75 6.087
3 Safety 0.146 52.67 7.69
4 Bridge Performance (load impact)
0.08 70 5.6
5 Geotechnical
and Seismic 0.143 43.5 6.22
6 Strategic
Importance 0.088 29 2.552
7 Facilities 0.046 30 1.38
8 Traffic and
Pavement 0.068 45 3.06
4.5 Bridge on 12th km of Semnan-Jandaq road
This bridge is located at 12th km of Semnan-Jandaq road.
of 8 m in two lanes. In Table 23, the BCI of this bridge has been shown.
Table 23 BCI calculation of the bridge on 12th km of Semnan-Jandaq road
Index Wi Xi 𝐖𝐢× 𝐗𝐢 𝐁𝐂𝐈 = ∑(𝐗𝐢× 𝐖𝐢) 𝟖
𝐢=𝟏
1 Structural 0.331 83.635 27.683
56.768 2 Hydrology
and Climate 0.097 52.75 5.117
3 Safety 0.146 35 5.11
4 Bridge Performance (load impact)
0.08 70 5.6
5 Geotechnical
and Seismic 0.143 43.5 6.22
6 Strategic
Importance 0.088 29 2.552
7 Facilities 0.046 30 1.38
8 Traffic and
Pavement 0.068 45.67 3.106
According to Tables 19 to 23, the bridge on 12th km of
Semnan-Jandaq road with BCI=56.8 has the lowest BCI among the five studied bridges and it takes highest priority for maintenance. The second priority is related to the bridge on 6th km of Semnan-Jandaq road with BCI=62.2. The
bridge at the beginning of Shahmirzad road with BCI=72.8 takes the third priority and two other bridges with BCI=73.2 takes the lowest maintenance priority.
5 Conclusions
This study presents a new method for estimation of BCI in concrete bridges. BCI constitutes from eight indices that majority of them includes a series of sub-indices. Inspector assigns a score to each sub-index based on its condition. Index score is equal with the weighted average of sub-indices scores. Finally, by summing the weighted scores of indices, BCI will be determined. The necessity of this research could be justified in the absence of any proper system or index for assessing the bridge conditions in Iran. Due to financial constraints and the lack of qualified specialists, it is also crucial to provide solutions to overcome these shortcomings. Therefore, in this research, attempts were made to provide a new method for assessing bridge condition in order to optimize the management activities. The novelty of this study is in the scoring system because the scoring system is constructed by native experts' views. On the other hand, lack of a comprehensive and proper index in Iran, this paper is considered innovative. To
test the proposed method in practice, five bridges in Semnan province were inspected and their BCI were determined to prioritize bridges. The method proposed in this paper does not require the application of non-destructive equipment or laboratory tests, and it allows measuring BCI and prioritizing bridges for maintenance based on the visual evaluation of the damages and general characteristics of the bridge and its performance. The experts' views, scores and coefficients of relative importance may vary in different organizations or countries. Thus, it should be calibrated by a questionnaire survey prior to application. At the same time, only concrete bridges were studied in this study. This method can be applied or extended to the steel and stone (old) bridges to embrace all bridges.
References
1. Jeong, Y., et al., Bridge inspection practices and bridge
management programs in China, Japan, Korea, and US.
Journal of Structural Integrity and Maintenance, 2018. 3(2): p.
126-135.
2. Ryall, M., Bridge management. 2009: CRC Press.
3. Moodi, F., Development of a Knowledge Based Expert System
for the Repair and Maintenance of Concrete Structures. 2001, PhD. Thesis, Newcastle upon Tyne University, Newcastle upon Tyne, UK.
4. Wakchaure, S.S. and K.N. Jha, Determination of bridge health
index using analytical hierarchy process. Construction
Management and Economics, 2012. 30(2): p. 133-149.
5. MOT, Standards for technical condition evaluation of highway
bridges-JTG/T H21-2011. 2011, The Ministry of Transportation: Beijing, China.
6. MHURD, Technical code of maintenance for city bridge
(CJJ99-2003). 2003: Beijing, China: Ministry of Housing and Urban-Rural Development.
7. MLIT, Manual for Bridge Periodic Inspection. 2014: Tokyo,
Japan: Ministry of Land, Infrastructure, Transportation, and Tourism.
8. MOLIT, Guideline of safety inspection and in-depth safety
inspection for structures. 2012: Sejong, South Korea: Ministry of Land, Infrastructure, and Transport.
9. Shepard, R.W. and M.B. Johnson, California bridge health
index: A diagnostic tool to maximize bridge longevity, investment. TR News, 2001(215).
10. FHWA, Bridge inspector’s reference manual. FHWA NHI
12-049, 2012.
11. Rashidi, M., P. Gibson, and T.K. Ho, A New Approach to
Bridge Infrastructure Management. 2013.
12. Akgul, F., Bridge management in Turkey: a BMS design with
customised functionalities. Structure and Infrastructure
Engineering, 2016. 12(5): p. 647-666.
13. Rashidi, M., B. Samali, and P. Sharafi, A new model for bridge
management: Part A: condition assessment and priority ranking of bridges. Australian Journal of Civil Engineering,
2016. 14(1): p. 35-45.
14. Anoop, M., B. Raghuprasad, and K. Balaji Rao, A refined
methodology for durability‐based service life estimation of reinforced concrete structural elements considering fuzzy and random uncertainties. Computer‐Aided Civil and
Infrastructure Engineering, 2012. 27(3): p. 170-186.
15. Niknam, T., J. Olamaie, and B. Amiri, A hybrid evolutionary
algorithm based on ACO and SA for cluster analysis. Journal
of Applied Science, 2008. 8(15): p. 2695-2702.
16. Liu, H., et al., Condition evaluation for existing reinforced
by particle swarm optimisation. Structure and Infrastructure
Engineering, 2017. 13(7): p. 955-965.
17. Rashidi, M. and P. Gibson, A methodology for bridge condition
evaluation. 2012.
18. Wu, H.-C., A multi-objective decision support model for
maintenance and repair strategies in bridge networks. 2008: Columbia University.
19. Abu Dabous, S. and S. Alkass, Decision support method for
multi‐criteria selection of bridge rehabilitation strategy.
Construction Management and Economics, 2008. 26(8): p.
883-893.
20. Rashidi, M., B. Samali, and P. Sharafi, A new model for bridge
management: Part B: decision support system for remediation planning. Australian Journal of Civil Engineering, 2016. 14(1): p. 46-53.
21. Agrawal, A.K., A. Kawaguchi, and Z. Chen, Deterioration
rates of typical bridge elements in New York. Journal of Bridge
Engineering, 2010. 15(4): p. 419-429.
22. Hsu, H., et al., Small and medium size bridge maintenance
sequence analysis by optimization technique, in Advances in Bridge Maintenance, Safety Management, and Life-Cycle Performance, Set of Book & CD-ROM. 2015, CRC Press. p. 139-140.
23. Hearn, G., Condition data and bridge management systems.
Structural engineering international, 1998. 8(3): p. 221-225.
24. Kuzman, M.K., et al., Comparison of passive house
construction types using analytic hierarchy process. Energy
and Buildings, 2013. 64: p. 258-263.
![Fig. 1 Decision tree in Sanjay and Kumar research[4].](https://thumb-us.123doks.com/thumbv2/123dok_us/7945100.1318759/2.595.313.554.651.739/fig-decision-tree-sanjay-kumar-research.webp)
![Fig. 2 Weight importance of elements for a conventional concrete bridge[12]](https://thumb-us.123doks.com/thumbv2/123dok_us/7945100.1318759/5.595.58.291.113.236/fig-weight-importance-elements-conventional-concrete-bridge.webp)
![Fig. 3 AHP structure in the research of Rashidi et al. [20].](https://thumb-us.123doks.com/thumbv2/123dok_us/7945100.1318759/6.595.48.291.241.358/fig-ahp-structure-in-the-research-of-rashidi.webp)