Deep learning method to remove chemical, kinetic
and electric artifacts on ISEs
Abstract— We suggest a deep learning based sensor signal processing method to remove chemical, kinetic and electrical artifacts from ion selective electrodes’ measured values. An ISE is used to investigate the concentration of a specific ion from aqueous solution, by measuring the Nernst potential along the glass membrane. However, application of ISE on a mixture of multiple ion has some problem. First problem is a chemical artifact which is called ion interference effect. Electrically charged particles interact with each other and flows through the glass membrane of different ISEs. Second problem is the kinetic artifact caused by the movement of the liquid. Water molecules collide with the glass membrane causing abnormal peak values of voltage. The last artifact is the interference of ISEs. When multiple ISEs are dipped into same solution, one electrode’s signal emission interference voltage measurement of other electrodes. Therefore, an ISE is recommended to be applied on single-ion solution, without any other sensors applied at the same time. Deep learning approach can remove both 3 artifacts at the same time. The proposed method used 5 layers of artificial neural networks to regress correct signal to remove complex artifacts with one-shot calculation. Its MAPE was less than 1.8% and R2 of regression was 0.997. A randomly chosen value of AI-processed data has MAPE less than 5% (p-value 0.016).
Keywords—AI, Machine Learning, ISE, Analog Signal Processing, Horticulture, Aqua Culture
I. INTRODUCTION
Convergence of IT with horticulture is not surprising anymore. Propagation of farming technology is the main trend of agricultural industry around the world. The first approach trend was to precise control of farming environment. It started from basic IoT systems in 10 years ago, but AI based facility control is not special today. [1]
The trend of automation of human labors is now changing into automation of knowledge and information. Traditional cultivation methods highly depend on the experience of a farmer. Nowadays, the replacement of experience based know-how is main trend of Farm-tech area. [2, 3]
On fertilization area, the hottest application is hydroponics aqua culture). Open hydroponic system does not recycle the nutrient solution while closed hydroponic system does. Closed
system is very popular around the world today [4], because opened system has the possibility of pollution such as eutrophication.
Recently, many researchers have suggested an ISE based hydroponic approaches in order to measure individual ion concentrations rather than EC or TDS. [5-7]
An ISE measures concentration of a specific ion by acquisition of membrane voltage, induced by target ions. The Nernst potential E along a thin membrane is defined as equation ln ([ ]
[ ]
), where R is gas constant,
T is temperature, z is the number of ions which pass through the membrane, and F is faraday constant. This nature of an ion selective electrode causes 3 kinds of artifacts.
A. Ion Interference Effect
Nernst potential is induced by ion-exchange through the glass membrane with small hole which is designed for a specific target ion. This phenomenon is interfered by other ions. This artifact is described with Nikolsky-Eisenman Equation [8], provided as equation (1), where a is the thermodynamic activity of ion, ki is the selectivity coefficient and zi is the exchange of interfering ion i through glass membranes.
E = +
ln + ∑
(1)
We need to know the thermodynamic activity parameter ai and selectivity coefficient ki for every ion involved in the solution to predict the magnitude of this artifact. Parameter a is defined as equation (2), where is molar chemical potential, is the chemical potential under some standard condition.
a= exp (
) (2)
The activity value changes along temperature. Therefore, measurements of molar chemical potential in not-standard condition for all individual ions are required to predict the magnitude of ion interference effect, with equation (1). This work was supported by Agriculture, Food and Rural Affairs
Convergence Technologies Program for Educating Creative Global Leader funded by the Ministry of Agriculture, Food and Rural Affairs (MAFRA, Korea). [Project Number 1545020852].
Donghun Ryu
Future Farming Team
Imagination Garden Inc.
Andong Si, Republic of Korea [email protected]
Byunghyun Ban*
Future Farming Team
Imagination Garden Inc.
Andong Si, Republic of Korea [email protected]
Minwoo Lee
Future Farming Team
Imagination Garden Inc.
Andong Si, Republic of Korea [email protected]
This is not feasible in agricultural applications because most solutions used in crop cultivation area contains a variety of ions. For example, Yamazaki’s solution, which is the simplest nutrient solution for leafy vegetable, has 23 different ions. [9] And the total ion composition of water used to make fertilizer should be known.
B. Kinetic Artifacts
Movement of solution physically interferes the glass membrane of electrode. Therefore, ISEs are recommended to be applied on a non-flowing solution and to wait around 1~10 minutes before measurement to make electrode stable. Even a drop of water make inaccurate measurement.
C. Electrode Interference
If two or more ISEs are applied on the same solution, an electrode’s electrical signal may interfere other sensors. This artifact is a problem of real-time measurement.
Liberti et al. provided readjustment method with Gran’s plots to remove ion interference effect but it also require prior knowledge of ions. [10] We suggested a machine learning approach to remove the ion interference effect performing 91.5~97.8% accuracy on test cases [11], but failed to remove the artifact from movement of solution. A distorted signal caused by drop of water made the regression fail. Recently, Woo-jae Cho et al. suggested a deep learning approach to calibrate ISE signal which showed better performance than traditional 3 pointed calibration. [4] However, the experiment was conducted with living plant whose nutrient solution is thin. Our previous work was performed from that concentration, to 10 times thicker solution. As the ion interference effect becomes greater in higher concentration, Cho’s work need additional verification on thicker solution.
II. ISEMEASUREMENT
An experiment with an array of ISEs was performed to acquire training/test data and to figure out the magnitude of ion interference effect.
A. Equipments
Vernier’s Go Direct® ISE series were used to measure the concentration of ions. K+, Ca++, NO
3-, NH4+ ions are measured with corresponding ion selective electrodes. The sensors were dipped into the same solution at the same time and connected to same computer, sharing same power source to remove artifacts from electricity supply.
B. Chemical Solutions
We used Yamazaki’s nutrient solution for lettuce [9] because it is very popular around the world and its chemical phenomenon and interactions of every solvent are fully understood. [2]
But We did not applied some ions whose population is very little. KNO3, Ca(NO3)2-4H2O and NH4H2PO4 were used to make the nutrient solution. HxPO43-x families builds complex sediments reactions but not measurable with ISEs.
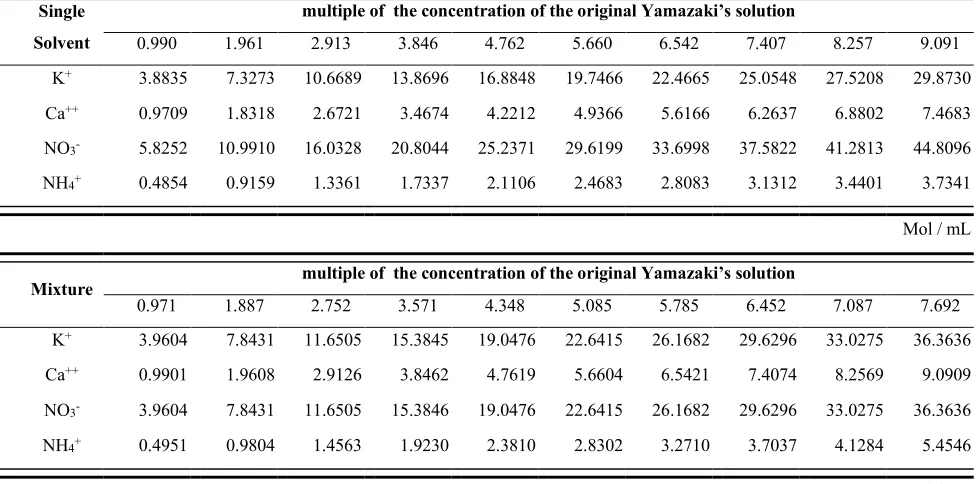
We prepared the solution with 10 different concentrations. We set the concentration of the original Yamazaki’s solution as 1. The experiment condition is described on Table 1.
C. Method
Two measurement experiments were conducted. For each experiment, ISEs are dipped into a 1 L beaker filled with distilled water at first. Then droplets of highly concentrated Single
Solvent
multiple of the concentration of the original Yamazaki’s solution
0.990 1.961 2.913 3.846 4.762 5.660 6.542 7.407 8.257 9.091
K+ 3.8835 7.3273 10.6689 13.8696 16.8848 19.7466 22.4665 25.0548 27.5208 29.8730
Ca++ 0.9709 1.8318 2.6721 3.4674 4.2212 4.9366 5.6166 6.2637 6.8802 7.4683
NO3- 5.8252 10.9910 16.0328 20.8044 25.2371 29.6199 33.6998 37.5822 41.2813 44.8096
NH4+ 0.4854 0.9159 1.3361 1.7337 2.1106 2.4683 2.8083 3.1312 3.4401 3.7341
Mol / mL
Mixture
multiple of the concentration of the original Yamazaki’s solution
0.971 1.887 2.752 3.571 4.348 5.085 5.785 6.452 7.087 7.692
K+ 3.9604 7.8431 11.6505 15.3845 19.0476 22.6415 26.1682 29.6296 33.0275 36.3636
Ca++ 0.9901 1.9608 2.9126 3.8462 4.7619 5.6604 6.5421 7.4074 8.2569 9.0909
NO3- 3.9604 7.8431 11.6505 15.3846 19.0476 22.6415 26.1682 29.6296 33.0275 36.3636
NH4+ 0.4951 0.9804 1.4563 1.9230 2.3810 2.8302 3.2710 3.7037 4.1284 5.4546
Mol / mL
chemical solution is added to the beaker in order to induce the kinetic artifact.
For single solvent experiment for ISE calibration, only one solvent such as KNO3 was taken into the solution to avoid ion interference effect and electrode interference.
During the ion mixture experiment, multiple ISEs measured the concentration at the same, taken into one beaker together, to induce ion interference effect.
Both processes were repeated 10 times.
D. Calibration
For each ions, exponential regression on whole data was performed to calibrate the sensors because the Nernst potential is induced by the log of concentration. Each ISE was calibrated with 10-theoretically different concentration, with data point more than 10 thousands.
Calibration equation format is described as equation (3), where Ci is the ISE-measured concentration, is the membrane voltage from ISE, and a and b are parameters for regression. The results of regressions are provided on Table 2.
C= a (3)
E. Artifacts
Applying the calibration equation (3) with coefficients from Table 2, the result from ion mixture experiment were
analyzed. Error between theoretical value and ISE-measured values are evaluated on Table 3. MAPE score is especially larger than other measurement.
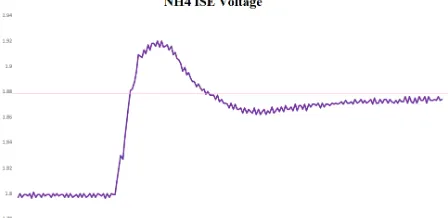
Kinetic artifacts measured from the experiment is described in Figure 1.
III. METHOD
A. Equipments and Library
NVIDA’s GPU GTX1080TI (11 Gb VRAM) was used with KERAS (tensorflow backend). The source code of the proposed method is available at the author’s Github repository
(https://github.com/needleworm/ion_interference)
B. Data
Experiment data from mixture of ions is used. 20% of the data was randomly selected to be used as test data, and the others are used as training data.
Just a scale normalization was done on the experimental data before feeding into the neural network. The whole data was divided with the maximum value of the data. That value was stored on the memory and multiplied on the output values of the neural networks. Any other normalization method is not applied to train a robust model.
C. Objective Function & Optimization
Mean absolute percentage error(MAPE) was used as loss function. MAPE is defined as equation (4). Ygt is ground truth data and Ypredict is model-predicted data.
MAPE = ∑
% (4)
We avoided squared error based approach such as mean squared error because the scale of error would become too small, yielding small gradient.
ADAM optimizer [12] was used to optimize the weight parameters. Initial learning rate was 1e-4 but we also applied learning rate decay as 1e-7 per epoch. Because the model seemed to converge fast at first but failed to find sophisticated convergence point.
Ion a b R2 Data size
K+ 4e-08 5.4996 0.957 20,590
Ca++ 2e-15 16.697 0.9631 16,379
NO3- 73.727 -5.748 0.965 26,042
NH4+ 2e-07 4.8642 0.9441 26,045
Table 2. Regression result for calibrations
MSE MAPE R2
2.000e-5 56.460% 0.879
Table 3. Error analysis
Figure 1. Kinetic Artifact The kinetic artifact caused by droplet is measured. This picture is taken from a part of NH4+ ISE’s measurement result. Purple line is measured voltage and pink line is theoretical value. The measured kinetic artifacts tended to distort the voltage graph similar to the transient response.
Model
Number Model Arcitecture MAPE
1 128-128-128-4 7.885
2 128-128-128-128-4 7.745
3 256-256-128-64-4 5.371
4 256-256-256-128-4 5.662
5* 256-256-256-256-4 1.779
* Suggested Model
D. Neural Network Models
The structures of models used for experiment is described on Table 4. MAPE values at convergence state are also provided. All layers are simple fully connected networks. ReLu function and batch normalization [13] are applied on every layer except the output layer. The activation function of output layer was sigmoid function because the training and test data are normalized into a value between 0 ~ 1.
IV. EXPERIMENT
The models were trained with minibatch size 64. After training, test data was directly fed into the model to make artifact-removed data. The weight variable and prediction result files are also provided with the source code, at the author’s Github repository.
V. RESULT Results are summarized on Table 5.
Our previous work with quadratic regression model [11] was applied on the experiment data for comparison. It failed to remove artifacts and even increased error dramatically. The value of MSE was 1.004e-3, R2 was -5.092 and MAPE was 321.79%. Concerning the MAPE values on Table 4, models
with higher variance with lower bias performed better regression result. It implies that quadratic model’s variance was too small to regress the experimental data with 3 different artifacts. It worked well on static and stable condition, but the result shows that it is not appropriate for real-time measurement of chemical solutions which has kinetic artifacts.
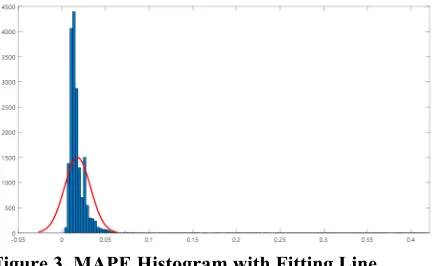
Comparison between 10 point calibration result and suggested method are plotted on Figure 2. The MAPE score of suggested method is plotted on Figure 3. It showed mean 1.17881% with standard deviation 0.014943. The hypothesis that any randomly chosen value has MAPE less than 0.05 had p-value 0.016.
VI.CONCLUSION
A deep learning approach with MAPE loss to remove multiple artifact on ISEs was introduced. Measurement with ion selective electrodes on a chemical solution which has different ions has 3 major artifacts: ion interference effect, kinetic artifact and electrode interference. Proposed method successfully removed them with a single scalar regression task. Not only removing 3 artifacts, this model also performed a calibration to convert voltage into molarity. Previous method with quadratic regression model is not suitable to remove those 3 artifacts at the same time but proposed method removed 3 different artifacts and restored the data with mean absolute percentage error less than 1.8%. For a real-time measurement of complex solution, we recommend a high-variance model such as deep neural networks remove multiple artifacts rather than simple regression models.
ACKNOWLEDGMENT (Heading 5)
This work was supported by Agriculture, Food and Rural Affairs Convergence Technologies Program for Educating Creative Global Leader funded by the Ministry of Agriculture, Food and Rural Affairs (MAFRA, Korea). [Project Number 1545020852].
We are grateful to all members of Imagination Garden Inc. for their trust on our project.
Figure 2. MSE Box Plot Mean square errors between predicted values and theoretical values are measured.
Figure 3. MAPE Histogram with Fitting Line
Method MSE R2 MAPE (%)
10 Point
Calibration 2.00e-5 0.879 56.458
Quadratic
Model [11] 1.00e-3 -5.092 321.786
Proposed
Method* 1.85e-7 0.997 1.779
REFERENCES
[1] B. Ban and S. Kim, Control of nonlinear, complex and black-boxed greenhouse system with reinforcement learning, 2017 International Conference on Information and Communication Technology Convergence (ICTC), Jeju, 2017, pp. 913-918.
https://doi.org/10.1109/ICTC.2017.8190813
[2] B. Ban, M. Lee and D. Ryu, ODE Network Model for Nonlinear and Complex Agricultural Nutrient Solution System, 2019 International Conference on Information and Communication Technology Convergence (ICTC), Jeju Island, Korea (South), 2019, pp. 996-1001. https://doi.org/10.1109/ICTC46691.2019.8939946
[3] Ban, B. Mathematical Model for Secondary Transport of Cations at the Root of Plants, Preprints 2019, 2019090219
https://doi.org/10.20944/preprints201909.0219.v1
[4] Cho W J, Kim H J, Jung D H, Kim D W, Ahn T I, Son J E. On-site ion monitoring system for precision hydroponic nutrient management. Comput Electron AGR. 2018; 146: 51-58.
https://doi.org/10.1016/j.compag.2018.01.019
[5] Kim H J, Son D W, Kwon S G, Roh M Y, Kang C I, Jung H S. PVC membrane-based portable ion analyzer for hydroponic and water monitoring. Comput Electron Agric. 2017; 140: 374-385.
https://doi.org/10.1016/j.compag.2017.06.015
[6] Ryan S Knight, Mark Lefsrud. Automated Nutrient Sensing and Recycling. 2017 ASABE Annual International Meeting. 2017; 1701609. https://doi.org/10.13031/aim.201701609
[7] CHO, Woo-Jae, et al. Hybrid Signal-Processing Method Based on Neural Network for Prediction of NO3, K, Ca, and Mg Ions in Hydroponic Solutions Using an Array of Ion-Selective Electrodes. Sensors, 2019, 19.24: 5508.
https://doi.org/10.3390/s19245508
[8] Hall, Denver G. Ion-selective membrane electrodes: a general limiting treatment of interference effects. The Journal of Physical Chemistry 100.17 (1996): 7230-7236. https://doi.org/10.1021/jp9603039 [9] Yamazaki K. Nutrient solution culture. Tokyo, Japan: Pak-kyo Co;
1982. Japanese
[10] Liberti, Arnaldo, and Marco Mascini. "Anion determination with ion selective electrodes using Gran's plots. Application to fluoride." Analytical Chemistry 41.4 (1969): 676-679.
[11] B. Ban, D. Ryu and M. Lee, "Machine Learning Approach to Remove Ion Interference Effect in Agricultural Nutrient Solutions," 2019 International Conference on Information and Communication Technology Convergence (ICTC), Jeju Island, Korea (South), 2019, pp. 1156-1161. https://doi.org/10.1109/ICTC46691.2019.8939812 [12] Kingma, Diederik P., and Jimmy Ba. "Adam: A method for stochastic
optimization." arXiv preprint arXiv:1412.6980 (2014).
https://arxiv.org/abs/1412.6980
[13] Ioffe, Sergey, and Christian Szegedy. "Batch normalization: Accelerating deep network training by reducing internal covariate shift." arXiv preprint arXiv:1502.03167 (2015).