Flooding Based DDoS Attacks and Their Influence
on Web Services
Sunil Kumar1, Mandeep Singh2, Monika Sachdeva3, and Dr. Krishan Kumar4
1
M.Tech Scholar, 2Assistant Professor, Department of Computer Science & Engineering, Bhai Maha Singh College of Engineering, Sri Muktsar Sahib, Punjab, India
3
Assistant Professor, 4Head, Department of Computer Science & Engineering, SBS College of Engineering & Technology, Ferozepur, Punjab, India
Abstract: In present era, the world is highly dependent on the Internet and it is considered as main infrastructure of the global information society. Therefore, the Availability of information and services is very critical for the socio-economic growth of the society. However, the inherent vulnerabilities of the Internet architecture provide opportunities for a lot of attacks on its infrastructure and services. Distributed denial-of-service (DDoS) attack is one such kind of attack, which poses an immense threat to the availability of the Internet. These attacks not only congest a Server by their attack, but also affect the performance of other Servers on the entire network also, which are connected to Backbone Link directly or indirectly. To measure the impact of DDoS attack on web services, precise and comprehensive DDoS impact metrics are required. In this paper, we have used emulation to generate network topology. Legitimate and attack traffic is generated on this emulated topology. The impact of attack traffic is measured in terms of metrics such as Throughput, Response Time, Normal Packet Survival Ratio and Backbone Link Utilization.
Keywords: DDoS, Throughput, Response Time, Backbone Link Utilization, Normal Packet Survival Ratio.
1.INTRODUCTION
The “availability” means that the information, the computing systems, and the security controls are all accessible and operable in committed state at some random point of time [1]. Threat to the Internet availability is a big issue which is hampering growth and survival of E-business and other Internet based applications. Internet failures can be accidental or intentional. The Internet design concentrates mainly on providing functionality though a little attention has been given on designing strategies for controlling accidental failures. On the other hand, intentional attacks by malicious users have no answer in the original Internet design. A denial-of-service (DoS) is such an intentional attempt by malicious users / attackers to completely disrupt or degrade (compromise)
Holes, Octopus, Snork, ARP Cache Poisoning and the Misdirection. DoS attacks exploit weaknesses in Internet protocols, applications, operating systems, and protocol implementation in operating systems.
Distributed denial-of-service attacks (DDoS) degrade or completely disrupt services to legitimate users by expending communication and/or computational resources of the target. Mirkovic et al. [3] and Chen et al. [4] described DDoS attacks as amplified form of DoS attacks, where attackers direct hundreds or even thousands of compromised hosts called zombies against a single target. There are varieties of DDoS attacks as classified in [3] [5]. However, the most common form of DDoS attacks is a packet-flooding attack, in which a large number of seemingly legitimate TCP, User Datagram Protocol (UDP), or Internet Control Message Protocol (ICMP) packets are directed to a specific destination. As per Moore et al. [6], defending against these attacks is challenging for mainly two reasons. First, the number of zombies involved in a DDoS attack is very large and deployment of these zombies spans large geographical areas. The volume of traffic sent by a single zombie might be small, but the volume of aggregated traffic arriving at the victim host is overwhelming. Second, zombies usually spoof their IP addresses under the control of attacker, which makes it very difficult to trace the attack traffic back even to zombies. According to the Internet architecture working group [7], the percentage of spoofed attacks is declining, but the sheer volume and distributed nature of DDoS attack traffic still thwart design of an effective defence.
2.DDOSATTACKS
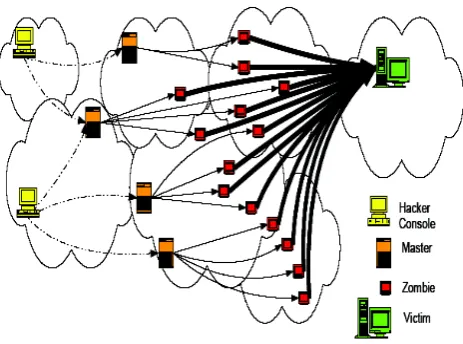
called bots and the attack network is called botnet in hacker’s community. Hackers send control instructions to masters, which in turn communicate it to zombies for launching attack. The zombie machines under control of masters/handlers (running control mechanism) as shown in Figure 1 transmit attack packets, which converge at victim or its network to exhaust either its communication or computational resources.
Figure 1: Attack Modus Operandi
Mirkovic et al. [3] have classified DDOS attacks into two broad categories: flooding attacks and vulnerability attacks. Flooding DDoS attacks consume resources such as network bandwidth by overwhelming Backbone link with a high volume of packets. Vulnerability attacks use the expected behaviour of protocols such as TCP and HTTP to the attacker’s advantage.
Flooding DDoS is basically a resource overloading problem. The resource can be bandwidth, memory, CPU cycles, file descriptors and buffers etc. A flood of packets congests the link between ISP’s edge router and border router of victim domain [8].
The congestion and flow control signals force legitimate clients to decrease their rate of sending requests, whereas attack packets keep coming. Finally, a stage comes when only attack traffic is reaching at the server. Thus, service is denied to legitimate clients. Moreover Robinson et al. [9] stated that as attack strength grows by using multiple sources, the computational requirements of even filtering traffic of malicious flows become a burden at the target.
3.RELATED WORK
DDoS attack’s impact metrics are closely related with measuring effectiveness of DDoS defense approaches. At
present there are no benchmarks [10], [11] in terms of effective metrics for evaluating DDoS attack impact and defense strategies. Most of the existing strategies compare goodput without attack, under attack, and with defense [12]. Some of recent measurements [13] have also concentrated on response time. Though measuring legitimate packets survival ration proves to be most important as it clearly reflects accuracy of the defense and Legitimate packet loss index [14], [15].
Jelena et al. [16], [17] have used percentage of failed transactions (transactions that do not follow QoS thresholds) as a metric to measure DDoS impact. They define a threshold-based model for the relevant traffic measurements, which is application specific. When a measurement exceeds its threshold, it indicates poor services quality. But since transaction duration depends on the volume of data being transferred and network load, so absolute duration threshold cannot be set. Server timeout has been used as a metric in [18]. However collateral damage in terms of legitimate traffic drop is not indicated. Sachdeva et al. [19] have used good put, mean time between failure and average response time as performance metrics whereas Krishan et al. [20] have used two statistical metrics namely, Volume and Flow to detect DDoS attacks.
As per [16] metrics such as goodput, badput, response time, number of active connections , ratio of average serve rate and request rate, and Normal Packet Survival index [15] properly signal denial of service for HTTP, FTP and DNS, but not for media traffic.
4.PERFORMANCE METRICS
Many companies reaping the benefits of Internet commerce do not understand the true costs that are associated with the growing number of DoS and DDOS attacks. Even a few minutes of downtime can be expensive when millions of dollars of business transactions is shut down as a result of a hacker attack [21]. Just one attack that takes longer to detect and rectify can be even more disastrous, not just in terms of lost revenue but in terms of intangibles such as loss of customer confidence, the distinct possibility of unfavourable media coverage, potential legal liability and reduction in employee productivity.
Web experienced at least one DoS attack, with a total cost in hundreds of millions of dollars [12]. We have measured impact of DDoS attack on following metrics:
A. Throughput: - Throughput is no. of bits a network pass per second (bit/s). Throughput is divided into good-put and bad-put respectively. Good-put is defined as no. of bits per second of legitimate traffic that are carried by the backbone link, whereas bad-put gives no. of bits per second of attack traffic that flow through the backbone Link.
B. Response Time: - The elapsed time between the end of an inquiry or demand on a computer system and the beginning of a response; for example, The time taken for a packet to travel from client to server (TCS)+ server delay(TS)+ time required
for packet to reach to client from server(Tsc). So RT= TCS+
TS+ TSC. 3GPP [22] has given response time for various
applications.
C. Backbone Link Utilization: - Backbone Link Utilization is defined as percentage of bandwidth that is being used for good put.
D. Normal Packet Survival Ratio: - It is a good metric to measure impact of attack as we can measure impact of attack as a percentage of legitimate packets delivered during the attack. If this percentage is high, arguably service continues with little interruption.
5.EVALUATION IN TEST BED EXPERIMENTS
We evaluate our metrics in experiments on the DETER test-bed using SEER GUI BETA6 environment [23] [24]. The test bed is located at the USC Information Sciences Institute and UC Berkeley, and allows security researchers to evaluate attacks and defenses in a controlled environment.
A. Experimental Topology
Figure 2 shows our experimental topology definition and Figure 3 shows the experimental topology. Three legitimate networks, one attack network and one Servers network are connected via two core routers. Each legitimate network has five legitimate client nodes, and is connected to the core via an access router. Links between the access router and the core have 100 Mbps bandwidth; the backbone bandwidth is chosen to mimic Flash Event.
B. Background Traffic
Each client generates Web traffic. We have generated realistic traffic. Clients talk with Web server ‘V’ in server network. All attacks target the server ‘S’ and cross its backbone link, so the web traffic coming at Server ‘V’ should be impacted by the attacks.
Here, we have shown a different approach where Victim is not being attacked directly, but Victim is affected at a large scale due to attack on other server in its network, because, in actual the backbone Link is being attacked. We have created this topology to create more realistic attack conditions.
Figure 3: Experimental Topology set ns [new Simulator]
source tb_compat.tcl #Create the topology nodes
foreach node { V S R1 R2 R3 R4 R5 R6 L1 L2 L3 L4 L5 L6 L7 L8 L9 L10 L11 L12 L13 L14 L15 A1 A2 A3 A4 A5 control } {
set $node [$ns node]
tb-set-node-os [set $node] FC4-STD tb-set-node-startcmd [set $node] "sudo python /share/seer/v160/experiment-setup.py Basic" }
set linkRV [$ns duplex-link $V $R1 100Mb 3ms DropTail] set linkRS [$ns duplex-link $S $R1 100Mb 3ms DropTail] set linkRR2 [$ns duplex-link $R2 $R1 500Kb 0ms DropTail] set lannet0 [$ns make-lan "$L1 $L2 $L3 $L4 $L5 $R3 " 100Mb 0ms] set lannet1 [$ns make-lan "$L6 $L7 $L8 $L9 $L10 $R4 "100Mb 0ms] set lannet2 [$ns make-lan "$L11 $L12 $L13 $L14 $L15 $R5"100Mb 0ms]
set lannet3 [$ns make-lan "$A1 $A2 $A3 $A4 $A5 $R6 " 100Mb 0ms] set linkRR3 [$ns duplex-link $R3 $R2 100Mb 3ms DropTail] set linkRR4 [$ns duplex-link $R4 $R2 100Mb 3ms DropTail] set linkRR5 [$ns duplex-link $R5 $R2 100Mb 3ms DropTail] set linkRR6 [$ns duplex-link $R6 $R2 100Mb 3ms DropTail] $ns rtproto Static
$ns run
Table 1: Basic Parameters of Experiment.
Parameters Values Experiment OS Type FC4-STD
Legitimate Traffic Type http Legitimate Packet Size 175 bytes Attack Packet Size Variable IP Spoofing for Attack Enabled Legitimate Clients 15 No. of Attack Hosts 5
Attack Traffic Type UDP, TCP and ICMP Access Bandwidth 100 Mbps
Backbone Bandwidth 500 Kbps
Server Delay 3ms
Access Link Delay 3ms Backbone Link Delay 0ms
C. Attack Traffic
We have used UDP, TCP, and ICMP traffic for generating DDoS flood. Flooding attacks can deny service in two ways: (1) by generating a huge volume of traffic that exhausts bandwidth on the backbone links, (2) by generating a high packet rate that exhausts the CPU at an intermediate router or the target host. In this experiment, we have generated UDP, TCP and ICMP bandwidth flood with FLAT, PULSE and RAMP distributions to achieve attacks in different scenarios.
6.RESULTS AND DISCUSSIONS
The effect of DDoS attacks on the performance of web service is analysed below:-
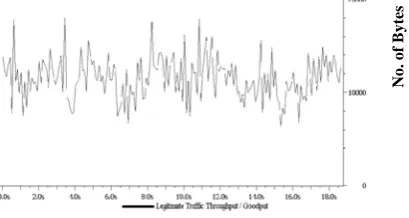
6.1. Throughput
During a DDoS attack, backbone link is attacked to force the edge router at the ISP of victim end to drop most legitimate packets. In the following explanations, we concentrate on the Throughput Line as well as Good-put Line to get the measure of actual loss.
No
. o
f By
tes
Time (in Seconds)Legitimate traffic only
No
. o
f By
tes
Time (in Seconds) ICMP Flat Attack
No
. o
f By
tes
Time (in Seconds) UDP Pulse Attack
No
. o
f By
tes
Time (in Seconds) TCP Pulse Attack
No
. o
f By
tes
Time (in Seconds) UDP Flat Attack
No
. o
f By
tes
Time (in Seconds)TCP Flat Attack
No
. o
f By
tes
No
. o
f By
tes
Time (in Seconds) UDP Ramp Attack
No
. o
f By
tes
Time (in Seconds) TCP Ramp Attack
Figure 4: Throughput and Good-put Measurement Through backbone
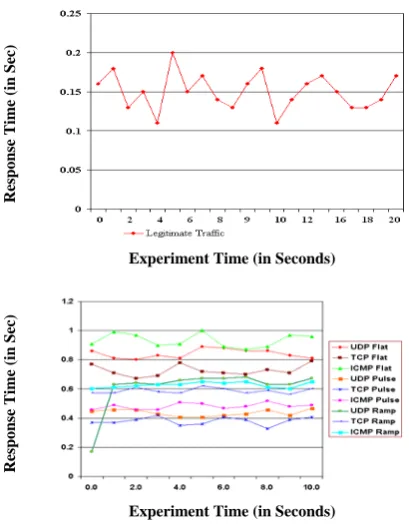
6.2. Average Response Time
Web services need minimum response time to finish an HTTP transaction. HTTP transaction is considered a successful one it is completed in less than 10 seconds Calvin et. Al. [18] Therefore, we calculate the average Response Time based on HTTP transactions which finish in 10 seconds.
Response Time
(i
n Sec)
Experiment Time (in Seconds)
Response Time
(i
n Sec)
Experiment Time (in Seconds)
Figure 5: Average Response Time of Legitimate clients
The average Response Time is increased almost 3 to 5 times during the attack as compared to legitimate.
6.3 Average Ratio of Normal Packet Survival
NPSR is defined as ratio of good-put and throughput. This is percentage of legitimate packets that can survive during attack. NPSR should be high. We can measure impact of attack as a percentage of legitimate packets delivered during the attack. If this percentage is high, service continues with little interruption. NPSR starts decreasing with increased rate of attack traffic and as bandwidth of the link is limited, so legitimate packets starts dropping.
Normal Packet
S
u
rvival ratio
Time (in Seconds)
Figure 6: Average Ratio of Normal Packet Survival during attack
6.4 Average Backbone Link Utilization
Backbone Link utilization is defined as percentage of bandwidth that is carrying legitimate traffic.
Backbone B.W.
U
tilization
Time (Sec)
Figure 7: Avg. Backbone Link Utilization
As shown in Figure 7, Backbone Link utilization is nearly 100% without attack. During Attack, Backbone Link utilization drops more than 50%.
7.CONCLUSIONS AND FUTURE SCOPE
in this work. We evaluate our metrics in experiments on the DETER test-bed [23] [24]. We generated attacks at different strengths so that DDoS attacks’ impact can be measured at different scenarios of attack. The future scope of this work is summarized as below: -
Computing the cumulative effect by combining weight of all the metrics.
Comparison of various DDoS Defense Mechanism using weighted metrics.
Building a new ISPs’ cooperation based defense mechanism.
ACKNOWLEDGMENT
We would like to express our gratitude to all those who gave us the possibility to complete this experimental work.
We are extremely thankful to all the colleagues and faculty members for their constructive criticism and guidelines.
REFERENCES
[1] Tipton H. F. and Krause M., “Information Security Management
Handbook”, CRC Press, 2004
[2] Criscuolo P.J, “Distributed Denial of Service Trin00, Tribe Flood Network,
Tribe Flood Network 2000, and Stacheldraht CIAC-2319”, Department of
Energy computer Incident Advisory (CIAC), UCRL-ID-136939, Rev. 1,
Lawrence Livermore National Laboratory, February 14, 2000.
http://ftp.se.kde.org/pub/security/csir/ciac/ciacdocs/ciac2319.txt.
[3] Mirkovic J., and Reiher P., “A Taxonomy of DDoS Attack and DDoS
Defense Mechanisms,” ACM SIGCOMM Computer Communications
Review, Volume 34, No. 2, pp. 39-53, April, 2004.
[4] Chen R., Park J., and Marchany R., “A Divide-and-Conquer Strategy for
Thwarting Distributed Denial-of-Service Attacks,” IEEE Transactions on
Parallel and Distributed Systems, Vol. 18, No. 5, pp. 577-588, May 2007.
[5] Douligeris C. and Mitrokotsa A., “DDoS attacks and defense mechanisms:
classification and state-of-the-art,” Computer Networks, Vol. 44, No. 5, pp.
643–666, April 2004.
[6] Moore D., Shannon C., Brown D. J. , Voelker G., and Savage S.,
“Inferring Internet Denial-of-Service Activity,” ACM Transactions on
Computer Systems, Vol. 24, No. 2, pp. 115–139, May 2006
[7] Handley M., Internet Architecture WG: DoS-resistant Internet subgroup
report, 2005.
http://www.communications.net/object/download/1543/doc/mjh-dos-summary.pdf.
[8] Kumar K., Joshi R. C., and Singh, K., “An Integrated Approach for
Defending against Distributed Denial-of-Service (DDoS) Attacks,”
IRISS-2006, IIT Madras. Available at: http://www.cs.iitm.ernet.in/~iriss06/paper.
html
[9] Robinson M., Mirkovic J., Schnaider M., Michel S., and Reiher P.,
“Challenges and principles of DDoS defense,” ACM SIGCOMM, 2003.
[10] J. Mirkovic and P. Reiher. “Benchmarks for DDoS Defense Evaluation”,
A University of Delaware.
www.lasr.cs.ucla.edu/Benchmarks_DDoS_Def_Eval.html
[11] J. Mirkovic, E Arikan, S. Wei, R. Thomas, S. Fahmy, and P. Reiher,
“Benchmarks for DDOS Defense Evaluation”, In Proceedings of Military
Communications Conference (MILCOM), pp. 1-10, 2006
[12] Y. You, “A defense framework for flooding based DDoS Attacks”, M. S.
Thesis, Queen’s University, Canada.
[13] J. Mirkovic, P. Reiher,S. Fahmy, R. Thomas, A. Hussain, S. Schwab,
“Measuring denial of service”, 2nd ACM workshop on Quality of protection
QoP, pp. 53 – 58, 2006.
[14] A. Hussian, S. Schwab, R. Thomas, S. Fahmy, and J.Mirkovic, “DDoS
Experiment Methodology”, DETER Community Workshop, June 15-16, 2006
[15] K. Kumar, “Protection from Distributed Denial of Service (DDoS)
Attacks in ISP Domain”, Ph.D. Thesis, Indian Indian Institute of Technology,
Roorkee, India, 2007.
[16] J. Mirkovic, A. Hussain, B. Wilson, S. Fahmy, P. Reiher, R Thomas, W.
M. Yao, S Schwab, “Towards user-centric metrics for denial-of-service
measurement”, Proceedings of the 2007 workshop on Experimental computer
science, San Diego, California.
[17] J. Mirkovic, S. Fahmy, P. Reiher, R. Thomas, A. Hussain, S. Schwab,
and C. Ko, “Measuring Impact of DoS Attacks”, Proceedings of the DETER
Community Workshop on Cyber Security Experimentation, June 2006
[18] C. Ko, A. Hussain, S. Schwab, R. Thomas, and B. Wilson. “Towards
systematic IDS evaluation", Proceedings of DETER Community Workshop,
pp. 20-23, June 2006
[19] Monika Sachdeva, Gurvinder Singh, Krishan Kumar and Kuldip Singh,
“A Comprehensive Survey of Distributed Defense Techniques against DDoS
attacks,” International Journal of Computer Science and Network Security
(IJCSNS), ISSN : 1738-7906, 9(12), pp. 7-15, December (2009)
[20] Krishan Kumar, R.C. Joshi, and Kuldip Singh, “An ISP Level
Distributed approach to detect DDoS Attacks,” Innovative Algorithms and
Techniques in Automation, Industrial Electronics and Telecommunications,
ISBN: 978-1-4020-6265-0 (Print) 978-1-4020-6266-7 (Online), Springer
Netherlands, DOI 10.1007/978-1-4020-6266-7, Pages 235-240, September 04
(2007).
[21] CSI/FBI Computer Crime and Security Survey. Computer Crime
Research Center, 2004, Available at:
http://www.crime-research.org/news/11.06.2004/423/.
[22] 3GPP, the 3rd Generation Partnership Project (3GPP).
[23] T. Benzel, R. Braden, D. Kim, C. Neuman, A. Joseph, K. Sklower, R.
Ostrenga, and S. Schwab, “Experiences With DETER: A Testbed for Security
Research”.
[24] J. Mirkovic, S. Wei, A. Hussain, B. Wilson, R. Thomas, S. Schwab, S.
Fahmy, R. Chertov, and P. Reiher. “DDoS Benchmarks and Experimenter’s