Article
1
Combining spherical-cap and Taylor bubble fluid
2
dynamics with plume measurements to characterize
3
basaltic degassing
4
Tom D. Pering1, Andrew J. S. McGonigle1,2,3,
5
1 University of Sheffield, Department of Geography, Winter Street, Sheffield, UK; [email protected]
6
2 Istituto Nazionale di Geofisica e Vulcanologia, Sezione di Palermo, Via Ugo La Malfa, 153, 90146, Palermo,
7
Italy.
8
3 School of Geosciences, The University of Sydney, NSW2006, Australia
9
* Correspondence: [email protected]; Tel.: +44-1142-227961
10
11
Abstract: Basaltic activity is the most common class of volcanism on Earth, characterized by magmas
12
of sufficiently low viscosities such that bubbles can move independently of the melt. Following
13
exsolution, spherical bubbles can then expand and/or coalesce to generate larger bubbles of
14
spherical-cap or Taylor bubble (slug) morphologies. Puffing and strombolian explosive activity are
15
driven by bursting of these larger bubbles at the surface. Here, we present the first combined model
16
classification of spherical-cap and Taylor bubble driven puffing and strombolian activity modes on
17
volcanoes. We furthermore incorporate the possibility that neighboring bubbles might coalesce,
18
leading to elevated strombolian explosivity. The model categorizes behavior in terms of the
19
temporal separation between the arrival of successive bubbles at the surface and bubble gas volume
20
or length, with the output presented on visually intuitive two-dimensional plots. The categorized
21
behavior is grouped into the following regimes: puffing from a) cap bubbles; and b)
non-22
overpressurised Taylor bubbles; and c) Taylor bubble driven strombolian explosions; each of these
23
regimes is further subdivided into scenarios whereby inter-bubble interaction does/doesn't occur.
24
The model performance is corroborated using field data from Stromboli (Aeolian Islands, Italy),
25
Etna (Sicily, Italy) and Yasur (Vanuatu), representing one of the very first studies, focused on
26
combining high temporal resolution degassing data with fluid dynamics, as a means of deepening
27
our understanding of the processes which drive basaltic volcanism.
28
Keywords: strombolian, puffing, Taylor bubble, gas slug, spherical-cap bubble, basaltic volcanism
29
30
1. Introduction
31
Basaltic volcanism is characterized by magmas of low viscosity, ranging 101 – 104 Pa s [1], which
32
enable free flow of gas bubbles within the melt, in contrast to the behavior of more viscous silicic
33
systems [2]. In basaltic magmas spherical bubbles are generated, following exsolution of gas from the
34
melt [3]. These bubbles grow via diffusion, decompression based expansion or coalesce to form
non-35
spherical bubbles, e.g., of spherical-cap morphology [4-6], which can transition into Taylor bubbles
36
(also called gas slugs), which nearly span the conduit width, and are of length ≥ the conduit diameter
37
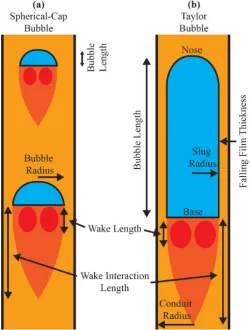
(see Fig. 1 for further detail on the morphological characteristics of spherical-cap and Taylor bubbles)
38
[4,7,8]. These distinct bubble morphologies give rise to a variety of potential classes of surface
39
degassing activity, specifically: passive degassing of spherical bubbles [2]; puffing, from bursting of
40
non-spherical bubbles or non-pressurized Taylor bubbles [9-11]; and explosions from
over-41
pressurized Taylor bubbles [12-14]. The latter scenario is associated with strombolian volcanism, as
42
manifested on the eponymous Stromboli volcano, e.g., [9,15], where the activity has been well
43
characterised through measurements of the erupted gas masses, e.g., [11,16-18], and studies into the
44
explosive dynamics, e.g., [19-21].
45
A number of other targets worldwide also exhibit strombolian volcanism, e.g., Yasur [22],
46
Villarica [23], Etna [24], and Pacaya [25]. Similarly, puffing activity on volcanoes has been well
47
studied, using video, thermal imagery and gas measurement approaches, particularly on Stromboli,
48
e.g., [10,11,26,27].
49
50
Figure 1. An illustration of (a) spherical-cap and (b) Taylor bubble morphologies including the bubble
51
features relevant to the model described here. Any bubble falling within the wake length of the bubble
52
ahead of it is considered liable for imminent coalescence. Any bubble beyond the interaction length
53
would be considered to flow independently (e.g., in the single regions of the model outputs shown in
54
Figs. 2 and 3). Bubbles within the interaction length are affected by the leading bubble (e.g., falling
55
within the rapid regions of Figs. 2 and 3).
56
Hitherto, considerable attention has been devoted to the fluid dynamics of discrete aspects of slug
57
flow on volcanoes, via mathematical, numerical and laboratory modelling approaches. In particular,
58
James et al. [13] investigated the evolution of Taylor bubble pressure and length during the ascent
59
process. Furthermore, James et al. [28] developed a criterion to quantify the transition between
60
puffing and explosive bursting, and Del Bello et al. [14] developed a static-pressure model for
61
bursting Taylor bubbles. However, to date there has been very little consideration of the fluid
62
dynamics of spherical-cap bubbles in a volcanic scenario, bar the work of Bouche et al. [29].
Spherical-63
cap bubbles can be considered a transitionary morphology with characteristic shape (see Fig. 1), prior
64
to the formation of Taylor bubbles. These bubbles are characterised by a quasi-hemispherical nose
65
and horizontal base and, unlike slugs, have lengths ≤ the conduit width, and have yet to develop a
66
full falling film, as is the case with Taylor bubbles. There has also been very little attention devoted
67
to resolving the implications of inter-bubble interactions within these volcanic bubble flow regimes.
68
Recently we have highlighted the importance of coalescence between multiple rising Taylor bubbles,
69
in modulating the timing and intensity of high temporal resolution strombolian explosions, based on
70
field observations on Mt. Etna [24], and laboratory experiments [30]; the potential importance of this
71
Here we present, for the first time, a combined model description, of the fluid dynamics of
73
puffing and strombolian volcanism, driven by spherical-cap and Taylor bubbles. This has been
74
achieved by: a) bringing together prior model treatments of individual aspects of Taylor bubble flow
75
from the volcanic and fluid dynamics literature; b) considering, for the first time, spherical-cap
76
bubbles in a volcanic scenario; and c) including the previously little considered (with notable
77
exceptions including [31,32]) possibility that bubbles might interact with one another to coalesce and
78
generate larger, e.g., more explosive masses. The model is also compared against degassing field data
79
from Stromboli [11,17,18], Etna [24] and Yasur [33] volcanoes. This is one of the very first attempts to
80
study volcanic degassing dynamics using a combination of modelling and gas flux time series [18],
81
expedited by the advent of ≈1 Hz time resolution UV imaging of volcanic SO2 fluxes which enables
82
capture of rapid degassing phenomena in unprecedented detail [34-36]. This work is also one of only
83
a few in recent years, focused on defining transitions between basaltic degassing modes, building on
84
pioneering work performed in this area a number of decades ago, e.g., [37], that of Palma et al. [38]
85
who identified the relationship between bubble bursting strength and duration of the styles of
86
basaltic volcanic activity relevant to this study, and the more recent work of Gaudin et al. [26] who
87
categorized explosions based on bubble sizes and eruptive properties.
88
2. Modelling transitions between spherical, non-spherical and Taylor bubble flow regimes
89
The model classifies strombolian and puffing degassing regimes as distinct areas on plots of
90
inter-bubble burst spacing vs. bubble volume; this is illustrated schematically in Fig. 2. In particular,
91
the activity is categorized within the following classes: puffing from spherical-cap bubbles; puffing
92
from Taylor bubbles; and Taylor bubble driven strombolian explosions. There is also a further
93
subdivision of these classes into scenarios whereby the bubbles can/cannot interact with one another,
94
i.e., “single” and “rapid” bursting regimes, and a region where bubble coalescence would inhibit the
95
presence of independent bubbles. The model (available as an Excel Spreadsheet) is contained within
96
the supplementary material, with the underlying mathematics detailed below. In this section,
97
transitions between bubble morphologies will be considered, i.e., the zonation with respect to bubble
98
volume and length. In the following sections, the categorization in terms of inter-bubble spacing will
99
be covered, specifically in terms of when inter-bubble interactions may occur.
100
Firstly, the degassing regimes are classified according to bubble volume (note that volume and
101
length here are interchangeable using the formula for the volume of a cylinder, assuming a
quasi-102
cylindrical geometry, and that data on bubble volume are often more readily acquirable than bubble
103
lengths). Bubbles in basalts cease to act as spherical bubbles (e.g., following Stokes law) at low
104
Reynolds numbers ( ), e.g., <0.3 [39], such that:
105
106
=
(Eq. 1)107
108
where is the melt density, the melt viscosity, the bubble length and is the spherical
109
bubble rise speed, from Stokes law:
110
111
=
(Eq. 2)112
113
where is the density of the gas phase and g gravitational acceleration. The at which a bubble
114
ceases to be spherical can therefore be defined, enabling demarcation of the length (i.e., bubble
115
volume) at which non-spherical bubbles form in Fig. 2. Any bubbles smaller than this size would lead
116
118
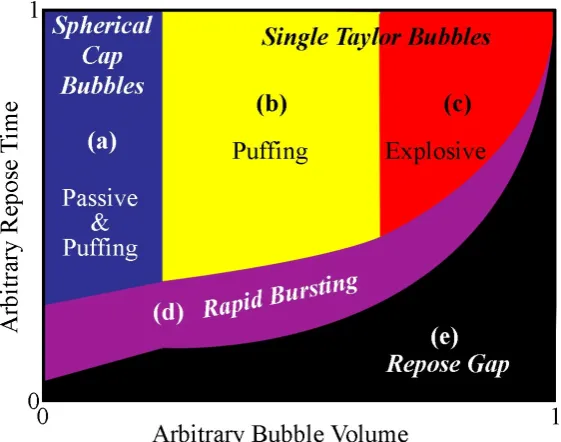
Figure 2. Illustrative example of the zonation between activity classes associated with the model,
119
plotted on arbitrary inter-bubble repose time vs. bubble volume axes. Within area (a) are
spherical-120
cap bubbles, which produce passive activity or light puffing, (b) and (c) are Taylor bubble flow
121
scenarios resulting in non-explosive and explosively bursting scenarios, respectively. Area (d)
122
represents cases where bubbles rise in sufficient proximity to one another to affect one another’s fluid
123
dynamics, while (f) corresponds to a region in which independent bubble bursting is unlikely due to
124
coalescence between neighboring bubbles.
125
The non-spherical bubble regime is dominated by spherical-cap and Taylor bubbles, particularly
126
at targets such as Stromboli, therefore our attention here will be focused on these bubble classes [5].
127
Spherical-cap bubbles burst passively at the magma surface or, as observed on Stromboli, can
128
generate puffing, e.g., [10,11,19,26,27]. At larger bubble dimensions, spherical-cap bubbles transition
129
into Taylor bubbles, when the bubble length exceeds that of the conduit diameter, e.g., [7]. Hence,
130
areas are defined to the right of Fig. 2 relating to Taylor bubble driven activity involving puffing or
131
strombolian explosions, depending on whether overpressure develops at the nose, e.g., [13]. This
132
boundary has been defined by James et al. [28], who used the term, ∗ , which characterises burst
133
vigour, and is ≥ 1 for explosive gas release. Here we adopt Eq. 13 from [28], to define this transition,
134
for a Taylor bubble reaching the magma surface at a pressure equal to surface atmospheric pressure,
135
, giving:
136
137
∗
= 1 =
(Eq. 3)138
139
where:
140
141
= 1 −
,
(Eq. 4)142
143
such that: is the Taylor bubble radius, which is the conduit radius, e.g., minus , where
144
is the thickness of falling film surrounding the Taylor bubble. The falling film thickness is found,
145
as per Llewellin et al. [43], from:
146
147
= 0.204 + 0.123tanh(2.66 − 1.15 log ) (Eq. 5)
148
149
151
= (2 ) (Eq. 6)
152
153
Hence, following Eq. 3, the length, (and volume) at which slugs transition to explosive activity
154
can be determined. The second element of the model is to consider the significance of inter-bubble
155
spacing, in terms of determining whether spherical-cap and Taylor bubbles rise independently of one
156
another or whether interaction, which might lead to coalescence could occur. This is considered in
157
the following sections.
158
159
2.1. Interactions between Taylor bubbles
160
161
The ascent velocity of a Taylor bubble base is determined using the Froude Number, e.g.,
162
[43,44]:
163
164
= 0.34 1 + . .
.
(Eq. 7)
165
166
such that:
167
168
= 2 (Eq. 8)
169
170
This speed is taken to be the average bulk rise velocity of a Taylor bubble [44] during ascent in
171
a volcanic conduit, as expansion, which causes acceleration of the nose, occurs closer to the surface
172
[13].
173
Other properties of Taylor bubbles are also important here, in particular, the wake length ,
174
and the wake interaction length . The wake length, which is typically around four times shorter
175
than the wake interaction length, defines an area within which any trailing bubble will undergo
near-176
instantaneous coalescence with the leading Taylor bubble, as per [45]:
177
178
= 2 0.30 + 1.22 × 10
.
(Eq. 9)179
180
The wake interaction length defines an area of fluidic disturbance beneath the Taylor bubble,
181
within which any following bubble will be affected by the leading Taylor bubble e.g., such that the
182
trailing bubble will no longer act independently [46]:
183
184
= 2 (1.46 + 4.75 × 10 ). (Eq. 10)
185
186
2.2. Interactions between spherical-cap bubbles
187
188
Spherical-cap bubbles can also be characterized in terms of Reynolds number, in this case
189
appropriate to the length scale of these bubbles. This scale is determined by the equivalent diameter,
190
for bubbles of volume [46]:
191
192
= . (Eq. 11)
193
194
Such that the Reynolds number in this case is defined as follows [46]:
195
196
= , (Eq. 12)
197
For u we use the ascent velocity of the Taylor bubble base (e.g., , to estimate the Re characteristics
199
of the system using a known velocity including effects of pipe diameter). The bubble drag coefficient
200
( ) is then calculated following [46]:
201
202
= 2.67 . + . . (Eq. 13)
203
204
This relationship is applicable for regimes with Morton numbers > 4 x 10⁻³, a condition satisfied
205
in volcanic scenarios, e.g., [14]. Spherical-cap bubble rise velocity ( ) can then be calculated using
206
the following relationship, rearranged from Joseph [47], Eq. 2.1:
207
208
= / (Eq. 14)
209
210
Coalescence between two spherical-cap bubbles occurs in the same manner as for Taylor bubbles
211
[6,48]. To consider this, is firstly converted to bubble diameter ( ) using the constant 0.57 [4],
212
which accounts for the non-spherical morphology of these bubbles:
213
214
= . (Eq. 15)
215
216
The wake length of spherical-cap bubbles, , applicable for Re < 200 (e.g., appropriate to
217
basaltic systems) is then determined as per Komasawa et al. [48]. Firstly, using bubble volume, ,
218
we can calculate the volume of the wake [48]:
219
220
= . (Eq. 16)
221
222
which is then used to determine the wake length, from the following relationship:
223
224
= × ( − ), (Eq. 17)
225
226
where, is the maximum wake diameter, which is taken as , and is the length of the cap
227
bubble (taken as db / 2) [48]. For spherical-cap interaction length ( ), there is no available prior
228
modelling literature to refer to here, hence we take this to be four times greater than , as this is
229
the approximate scaling between wake and wake interaction lengths in the Taylor bubble case,
230
although, as spherical-cap bubble volume decreases the influence of the interaction length will also
231
decrease.
232
233
2.3. Bubble interactions
234
235
Using the theory presented in 2.1 and 2.2 a temporal inter-bubble separation, tmin, can be defined
236
as a function of bubble volume (i.e., length) below which it would be highly improbable for an
237
independent trailing bubble to burst at the surface. In this case, any following bubble would be
238
travelling within the leading bubble’s wake, hence would be liable for imminent coalescence; tmin was
239
therefore taken to be equal to the rise time of the trailing bubble (i.e., the ascent velocity of the
240
spherical-cap or Taylor bubble) through a column of liquid of thickness equal to that of the leading
241
wake length ( or ) plus the height of fluid ( ), arising from complete drainage of the
242
film surrounding the leading bubble, following each burst. The latter was constrained, in the case of
243
Taylor bubbles, from film volume, as a function of slug volume, i.e., height, with knowledge of film
244
thickness, as per Eq. 5. For spherical-cap bubbles, this was constrained from bubble volume and
245
conduit volume around the bubble (i.e., applying the formula for the volume of a cylinder, for given
246
conduit and/or bubble radii).
247
= or = (Eq. 18)
249
250
This therefore defines a region on Fig. 2 (e), where bubble bursts are significantly less likely to
251
occur, i.e., within this region, all trailing bubbles are likely to undergo near-instantaneous coalescence
252
with the leading bubble. This area is termed the “repose gap” region, following the terminology of
253
Pering et al. [24], who in a study of rapid bursting events on Mt. Etna noted an absence of large mass,
254
low repose time events, hypothesizing that this behavior was due to coalescence; this region is also
255
discussed in a modelling framework in Pering et al. [30].
256
We can also define the time, , below which adjacent rising bubbles cannot be
257
considered to behave independently (e.g., bubbles are located within the wake areas of those ahead
258
of them), such that:
259
260
= or = (Eq. 19)
261
262
These durations correspond to the time taken for a Taylor or spherical-cap bubble to rise through a
263
column of melt of height equal to that of the drained film plus the wake interaction length, or
264
, of the leading bubble (Fig. 2), and are based on the lengths or volumes of bubble in question.
265
Hence, this line subdivides the non-spherical bubble degassing classes in Fig. 2, into categories where
266
the bubbles can/cannot be considered as rising independently of one another, respectively. Note that
267
a single area is used to denote non-independent (i.e., rapidly bursting) Taylor and spherical-cap
268
bubbles (Fig. 2d), without segregation between explosive and non-explosive cases for Taylor bubbles,
269
as complexities associated with pressure differences in this regime could lead to cases where the ∗
270
parameter would not apply.
271
3. Model application to target volcanoes and comparison with field data
272
The model was initiated with a range of Taylor and spherical-cap bubble volumes relevant to
273
the volcano scale, e.g., with corresponding bubble lengths ranging from the centimeter scale for
274
spherical-cap bubbles, to the order of meters for Taylor bubbles. We apply the model for conditions
275
appropriate to three target volcanoes: Stromboli, Etna, and Yasur, where field data concerning
276
puffing/strombolian explosive behavior are available with inter-event repose intervals on the order
277
of seconds to minutes. The model outputs, with field data overlain, are shown in Fig. 3. During bubble
278
ascent the overlying viscous magma acts to retard expansion, i.e., creating a gas overpressure. To
279
account for this phenomenon we applied the model of Del Bello et al. [14] for Taylor bubble data for
280
Etna and Stromboli, which provides estimates of gas overpressure at burst and resulting bubble
281
lengths as a function of magmatic and conduit parameters, from which burst volumes can be
282
extracted.
283
The schematic representation of the model in Fig. 2 necessarily applies sharp definitions to the
284
boundaries between defined degassing areas. In reality, there will be a degree of fuzziness around
285
these, as the model, of course provides a mathematical simplification of the ‘real world’ conditions
286
in volcanic conduits.
287
289
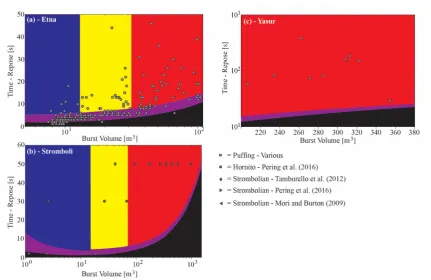
Figure 3. Outputs from the model run with input conduit and fluid dynamic parameters appropriate
290
to: (a) Mt. Etna; (b) Stromboli; and (c) and Yasur volcanoes. Overlain on the plots are data points
291
derived from field measurements on these targets, for Etna from Pering et al. [24] and Yasur from
292
Kremers et al. [33]. In the Stromboli case, a number of literature sources are referred to, as detailed
293
above. In each case a single repose interval is applied, which is a minimum for the observed activity.
294
Fig. 3b also just shows the maximum, mean and minimum burst volumes from each of Stromboli
295
papers, to simplify the graphic.
296
Firstly, we considered the case of Mt. Etna (Fig. 3a). Here we took UV camera field data from
297
Pering et al., [24], captured during a period of very rapid bubble bursting activity (modal inter-burst
298
period ≈ 4 s) observed at the Bocca Nuova crater. Here, observed masses were converted to in-conduit
299
volumes, using a pressure value of ≈ 65 kPa (i.e., for Mt. Etna’s summit craters’ altitude ≈ 3300 m)
300
within the Del Bello et al. [14] model. The parameters applied within our model were: magma density
301
of 2600 kg m3, viscosity of 2000 Pa s, and conduit radius of 1.5 m, e.g., [49]. In general, the field data
302
clearly fall above the repose gap area, affirming the model suggestion from Pering et al. [24] that
303
independently bursting large volume, low repose time events would be improbable, due to
inter-304
bubble coalescence in the conduit. The majority of bursts (62%) fall within the rapid bursting Taylor
305
and spherical-cap bubble area, with 15% contained in the single Taylor bubble explosive area, 12% in
306
the single Taylor bubble puffing area, and most of the remainder in the single puffing area, indicative
307
of activity spanning the strombolian explosive-puffing spectrum. In the case of this rapid bursting
308
scenario, the model points towards bubble interaction playing a key role in the fluid dynamics, as
309
previously suggested by Pering et al. [24].
310
Secondly for Stromboli (Fig. 3b) we ran the model with density, viscosity and conduit radius
311
values of 2700 kg m-3, e.g., [50,51], 300 Pa s, e.g., [52], and 1.5 m, respectively, e.g., [53,54]. Fig. 3b also
312
includes a range of field data points, based on literature derived main vent burst volumes [11,17,18].
313
These data generally fall within the single explosive Taylor bubble region, in line with the classical
314
strombolian activity associated with this target. However, the very smallest bursts from the
315
Tamburello et al. [11] dataset fall within the single Taylor bubble puffing region, capturing the
316
spectrum of activity exhibited at the volcano. For the specifically described ‘puffing’ events from
317
Tamburello et al. [11], all the data points are located away from the rapid Taylor bubble bursting area.
318
50 s from Ripepe et al. [10] for puffing. Hence, even for these rather extreme prescriptions of
inter-320
burst temporal resolution, the model points towards clearly independent bubble flow behaviour.
321
In addition, Pering et al. [18] reported on non-explosive puffing events, from a hornito adjacent
322
to the South-East crater, with a minimum repose interval of 30 s. These data fall within the single
323
puffing areas for Taylor and spherical-cap bubbles. Even smaller decimetre sized bubbles have also
324
been associated with puffing activity from smaller vent openings at Stromboli with repose intervals
325
of ≈ 0.5 – 2 s [9,10]. When plotted on Fig. 3b, these events mostly lie in the rapid puffing area of the
326
model, in view of their rather smaller inter-event durations than those puffing events reported in
327
Pering et al. [18].
328
Thirdly, the model was run for Yasur volcano (Fig 3c). Here, Kremers et al. [33] reported on
329
infrasonic observations of Taylor bubble bursting, quoting slug lengths and inter-event intervals for
330
a number of events. Here, we applied magma density and viscosity values of 2600 kg m3 and 1000 Pa
331
s, with a conduit radius of 1.5 m [22] within the model. In particular, we converted the Kremers et al.
332
[33] data to volume (see Table 1) using the formula for the volume of a cylinder (the infrasound
333
derived length data in Kremers et al. [33] already account for pressure and viscous effects), and plot
334
against repose time in Fig. 3c. In this case all data fall within the single explosive Taylor bubble region,
335
in line with the existent strombolian activity, and indicating independent bubble flow, well outside
336
the repose gap region.
337
338
Table 1. Slug length and repose time data associated with rapid strombolian activity on Yasur volcano
339
(Kremers et al., [33] Table 2) in addition to calculated explosive gas volumes.
340
Length (m) Volume (m3) Repose (s)
118.5 285 82
174.9 354 29
138.5 308 160
68.6 207 59
109.7 271 73
149.5 322 149
142.1 313 185
102.6 262 380
83.7 235 82
341
4. Discussion and Limitations
342
Here, we present the first unified fluid dynamic treatment of spherical-cap and Taylor bubble driven
343
puffing and strombolian explosive activity in basaltic volcanism, the most ubiquitous class of activity
344
on Earth. This involves concatenation of discrete modelled aspects of Taylor bubble flow in volcanic
345
scenarios, the consideration of spherical-cap bubble fluid dynamics in volcanology (building on the
346
considerations of [29]), and incorporation of the possibility of inter-bubble interaction, which has
347
been little considered, hitherto. We also compared the model against field data from Etna, Stromboli
348
and Yasur volcanoes, resulting in the field data falling as would be expected within the areal zonation
349
of activity regimes, e.g., in respect of whether strombolian activity or puffing was manifested. In
350
particular, the general absence of data points in the repose gap region of the plots, affirmed the
351
expectation that bubble-coalescence would mitigate against independent bubble bursting in this area.
352
A further model success is the seamless flow between the and traces, i.e., the transition
353
between Taylor and spherical-cap regions. Hence, the mathematical treatments presented here
354
appear not to break down close to this regime shift. The flow between and for the Etna
355
data (Fig. 3b), highlighting a need for further study into interaction lengths of spherical-cap bubbles.
357
In this treatment, we assume that rapid strombolian activity, such as that observed at Etna are driven
358
by trains of fully formed gas slugs, with associated fluid dynamic features, for the duration of ascent
359
from depth prior to burst.
360
Whilst a few data fell slightly within the repose gap region of Fig. 3a and 3b, this is likely
361
explicable by the following: a) The repose gap region refers to an area where bursting is improbable,
362
rather than impossible, and is based on the assumption that a bubble cannot exist independently
363
within the wake of another bubble; in reality such a bubble would have a very short, yet finite,
364
lifetime which could account for the slight overlap of some data into the repose gap region, and is
365
commensurate with the close proximity of all such events to the transition line; b) for the Etna data,
366
all such events are within a second of the repose gap line, which is likely at least partially a result of
367
the margin of error of the inter-event durations, given the quantized camera acquisition time stamp
368
and finite exposure times (100s of ms); c) for the Stromboli data, the very smallest puffing events from
369
Ripepe et al. [10] fall within the repose gap, potentially indicating that this activity is associated with
370
somewhat different magmatic and rheological properties than those reported in the literature for the
371
bulk conduit conditions of Stromboli, and assigned to the model. Alternately, this could indicate that
372
our assumption that is four times , based on the behaviour of Taylor bubbles, could be an
373
overestimate; d) a final issue is that the model does not include complexities associated with the flow
374
of bubble trains. Here, all bubble ascent velocities have been based on models associated with the
375
flow of single bubbles in vertical conduits. In fact, in bubble trains rise velocities are higher than in
376
the single bubble case [55-57], and there is also the issue of near-surface of expansion of trailing
377
bubbles, e.g., [13]. Both of these effects will act to lower the , , and traces in Figs.
378
2 and 3, plausibly also accounting for the very few data points that fell within the repose areas of the
379
Etna and Stromboli plots. Future model development could take into consideration these effects, in
380
addition to inclusion of more complex and realistic conduit conditions, e.g., [12] such as inclination
381
[58,59] and formation of viscous caps at the top of the conduit [26,60], both of which are possibilities
382
on Stromboli.
383
384
5. Conclusions
385
Here, we present the first unified model treatment of cap bubble and slug based puffing and
386
strombolian explosive degassing behaviour in volcanoes. This model illustrates the exciting new
387
scientific frontiers expedited by the recent advent of high speed imaging of volcanic gas plumes, such
388
that models for subterranean fluid dynamics can be corroborated with surface degassing
389
observations [61] in far more detail than possible previously with then available temporally coarser
390
degassing data. Indeed, this work is one of the very first to exploit this opportunity, following on
391
from Pering et al. [18,24]. In particular, this framework offers the possibility of diagnosing
392
underground fluid dynamic, conduit or magmatic conditions, based on surface observations of burst
393
masses and timings. Future work could focus on augmenting this combined UV camera to model
394
development framework with contemporaneous in-situ gas composition data [62,63], and infrasound
395
measurements [25].
396
This work is also focused on defining fluid dynamic transitions between disparate basaltic
397
degassing classes, highlighting the key role played by inter-bubble separation and coalescence during
398
such activity. There has been very little work in this area since seminal research, e.g., [37] a number
399
of decades ago. This new capacity to develop models, informed by high time resolution UV camera
400
observations offers exciting promise to provide step change advances in this field, extending to a
401
wider range of basaltic styles, e.g., covering hawaiian activity. In particular, at basaltic volcanoes such
402
as Mt. Etna, where activity styles can transition rapidly between puffing and passive degassing
403
through single strombolian explosions to more rapid bursting events, and finally to hawaiian lava
404
fountaining [62,63], the model could be of utility in eruption forecasting.
405
6. Notation and Greek Letters
407
This section contains the notation and Greek letters used throughout this manuscript (listed in
408
appearance order). Units used, where applicable, are included in brackets.
409
410
= Bubble Reynolds number
411
= Magma density (kg m3)
412
= Ascent velocity of a spherical bubble (m s-1)
413
= Bubble length (m)
414
= Magma viscosity (Pa s)
415
= Gas density (kg m3)
416
= Gravitational acceleration (m s-2)
417
∗ = Dimensionless burst vigour
418
′ = Ratio of bubble radius to pipe radius
419
= Atmospheric pressure at the surface (Pa)
420
= Taylor bubble radius (m)
421
= Conduit radius (m)
422
= Falling film thickness (m)
423
= Dimensionless inverse viscosity
424
= Froude number
425
= Taylor bubble base ascent velocity (m s-1)
426
= Taylor bubble wake length (m)
427
= Taylor bubble interaction length (m)
428
= Equivalent diameter (m)
429
= Bubble volume (m3)
430
= Reynolds number
431
= Bubble drag coefficient
432
= Spherical cap bubble base ascent velocity (m s-1)
433
= Bubble diameter (m)
434
= Volume of spherical cap bubble wake (m3)
435
= Spherical cap bubble wake length (m)
436
= Cap bubble length (m)
437
= Spherical cap bubble interaction length (m)
438
= Minimum repose time (s)
439
= Transition time (s)
440
441
Supplementary Materials: The following are available online at www.mdpi.com/link, SF1: Basaltic Degassing
442
Model.
443
Acknowledgments: A.J.S.M. acknowledges a Leverhulme Trust Research Fellowship (RF-2016-580), funding
444
from the Rolex Institute, EPSRC GCRF institutional quick spend funds, a Google Faculty Research Award and
445
NERC grant (NE/M021084/1). T.D.P. acknowledges the support of a NERC studentship (NE/K500914/1), the
446
University of Sheffield, and ESRC Impact Acceleration funding.
447
Author Contributions: T.D.P designed and implemented the described model. T.D.P and A.J.S.M wrote the
448
Conflicts of Interest: The authors declare no conflict of interest.
450
References
451
1. Shaw, H.R.; Wright, T.L.; Peck, D.L.; Okamura, R.R. The viscosity of basaltic magma; an analysis of field
452
measruements in Makaophui lava lake, Hawaii. Am. J. Sci. 1968, 266, pp. 225-264,
453
DOI:10.2475/ajs.266.4.225
454
2. Parfitt, E.A. A discussion of the mechanisms of explosive basaltic eruptions. J. Volcanol. Geotherm. Res. 2004,
455
134, pp. 77-107, DOI:10.1016/j.jvolgeores.2004.01.002
456
3. Sparks, R.S.J. The dynamics of bubble formation and growth in magmas: A review and analysis. J. Volcanl.
457
Geotherm. Res. 1978, 3, pp. 1-37, DOI:10.1016/0377-0273(78)90002-1
458
4. Davies, R.M.; Taylor, G.I. The mechanics of large bubbles rising through extended liquids and through
459
liquids in tubes. Proc. R. Soc. London, A. 1950, A200, pp. 375-390, DOI:10.1098/rspa.1950.0023
460
5. Wegener, P.P.; Parlange, J. Spherical-cap bubbles. Annu. Rev. Fluid Mech. 1973, 5, pp. 79-100
461
6. Bhaga, D.; Weber, M.E. Bubbles in viscous liquids: shapes, wakes, and velocities. J. Fluid Mech. 1981 105,
462
61-85
463
7. Wallis, G.B. One-dimensional two-phase flow, McGraw-Hill: New York, USA, 1969
464
8. Morgado, A.O.; Miranda, J.M.; Araújo, J.D.P.; Campos, J.B.L.M. Review on vertical gas-liquid slug flow.
465
Int. J. Multiph. Flow. 2016, 85, pp. 348-368, DOI:10.1016/j.ijmultiphaseflow.2016.07.002
466
9. Ripepe, M.; Gordeev, E. Gas bubble dynamics model for shallow volcanic tremor at Stromboli. J. Geophys.
467
Res. 1999, 104, pp. 10,639-10,654, DOI:10.1029/98Jb02734
468
10. Ripepe, M.; Harris, A.J.L.; Carniel, R. Thermal, seismic and infrasonic evidences of variable degassing rates
469
at Stromboli volcano. J. Volcanol. Geotherm. Res. 2002, 118, pp. 285-297, DOI:10.1016/S0377-0273(02)00298-6
470
11. Tamburello, G.; Aiuppa, A.; Kantzas, E.P.; McGonigle, A. J. S.; Ripepe, M. Passive vs. active degassing
471
modes at an open-vent volcano (Stromboli, Italy). Earth Planet. Sci. Lett. 2012, 359-360, pp. 106-116,
472
DOI:10.1016/j.epsl.2012.09.050
473
12. Seyfried, R.; Freundt, A. Experiments on conduit flow and eruption behaviour of basaltic volcanic
474
eruptions. J. Geophys. Res. 2000, 105 , pp. 23,727-23,740, DOI:10.1029/2000JB900096
475
13. James, M.R.; Lane, S.J.; Corder, S.B. Modelling the rapid near-surface expansion of gas slugs in
low-476
viscosity magmas. Geol. Soc. Spec. Publ. 2008, 307, pp. 147-167, DOI:10.1144/SP307.9
477
14. Del Bello, E.; Llewellin, E.W.; Taddeucci, J.; Scarlato, P.; Lane, S. J. An analytical model for gas overpressure
478
in slug-drive explosions: Insights into Strombolian volcanic eruptions. J. Geophys. Res. Solid Earth. 2012, 117,
479
DOI:10.1029/2011JB008747
480
15. Chouet, B.; Hamisevi, N.; McGetchi, T.R. Photoballistics of volcanic jet activity at Stromboli, Italy. J.
481
Geophys. Res. 1974, 79, pp. 4961-4976, DOI:10.1029/JB079i032p04961
482
16. McGonigle, A.J.S.; Aiuppa, A.; Ripepe, M.; Kantzas, E.P.; Tamburello, G. Spectroscopic capture of 1 Hz
483
volcanic SO2 fluxes and integration with volcano geophysical data. Geophys. Res. Lett. 2009, 36,
484
DOI:10.1029/2009GL040494
485
17. Mori, T.; Burton, M. Quantification of the gas mass emitted during single explosions on Stromboli with the
486
SO2 imaging camera. J. Volcanol. Geotherm. Res. 2009, 188, pp. 395-400, DOI:10.1016/j.volgeores.2009.10.005
487
18. Pering, T. D.; McGonigle, A.J.S.; James, M.R.; Tamburello, G.; Aiuppa, A.; Delle Donne, D.; Ripepe, M.
488
Conduit dynamics and post-explosion degassing on Stromboli: a combined UV camera and numerical
489
modelling treatment. Geophys. Res. Lett. 2016, 43, DOI:10.1002/2016GL069001.
490
19. Taddeucci, J.; Scarlato, P.; Capponi, A.; Del Bello, E.; Cimarelli, C.; Palladino, D.M.; Kueppers, U.
High-491
speed imaging of Strombolian explosions: The ejection velocity of pyroclasts. Geophys. Res. Lett. 2012, 39,
492
DOI:10.1029/2011GL050404
493
20. Taddeucci, J.; Alatorre-Ibarguengoitia, M.A.; Palladino, D.M.; Scarlato, P.; Camaldo, C. High-speed
494
imaging of Strombolian eruptions: Gas-pyroclast dynamics in initial volcanic jets. Geophys. Res. Lett. 2015,
495
42, pp. 6253-6260, DOI:10.1002/2015GL064874
496
21. Delle Donne, D.; Ripepe, M.; Lacanna, G.; Tamburello, G.; Bitetto, M.; Aiuppa, A. Gas mass derived by
497
infrasound and UV cameras: Implications for mass flow rate. J. Volcanol. Geotherm. Res. 2016, 325, pp.
169-498
178, DOI:10.1016/j.volgeores.2016.06.015
499
22. Kremers, S.; Lavallée, Y.; Hanson, J.; Hess, K.-U.; Chevrel, O.; Wassermann, J.; Dingwell, D.B. Shallow
500
magma-mingling-driven Strombolian eruptions at Mt. Yasur volcano, Vanuatu. Geophys. Res. Lett. 2012, 39,
501
23. Shinohara, H., Witter, J.B.; Volcanic gases emitted during mild Strombolian activity of Villarrica volcano,
503
Chile. Geophys. Res. Lett. 2005, 32, DOI:10.1029/2005GL024131
504
24. Pering, T.D.; Tamburello, G.; McGonigle, A.J.S.; Aiuppa, A.; James, M.R.; Lane, S.J.; Sciotto, M.; Cannata,
505
A.; Patane, D. Dynamics of mild strombolian activity on Mt. Etna. J. Volcanol. Geotherm. Res. 2015, 300, pp.
506
103-111, DOI:10.1016/j.volgeores.2014.12.013
507
25. Dalton, M. P.; Waite, G. P.; Watson, I. M.; Nadeau, P. A. Multiparameter quantification of gas release during
508
weak Strombolian eruptions at Pacaya volcano, Guatemala, Geophys. Res. Lett. 2010, 37,
509
DOI:10.1029/2010GL042617
510
26. Gaudin, D.; Taddeucci, J.; Scarlato, P.; Del Bello, E.; Ricci, T.; Orr, T.; Houghton, B.; Harris, A.; Rao, S.; Bucci,
511
A. Integrating puffing and explosions in a general scheme for Strombolian-style activity. J. Geophys. Res.
512
Solid Earth. 2017, 122, pp. 1860-1875, DOI:10.1002/2016JB013707
513
27. Gaudin, D., Taddeucci, J.; Scarlato, P.; Harris, A.; Bombrun, M.; Del Bello, E.; Ricci, T. Characteristics of
514
puffing activity revealed by ground-based, thermal infrared imaging: the example of Stromboli Volcano
515
(Italy). Bull. Volcanol. 2017, 79, DOI:10.1007/s00445-017-1108-x
516
28. James, M.R.; Lane, S.J.; Wilson, L.; Corder, S.B. Degassing at low magma-viscosity volcanoes: Quantifying
517
the transition between passive bubble-burst and Strombolian eruption. J. Volcanol. Geotherm. Res. 2009, 180,
518
pp. 81-88, DOI:10.1016/j.volgeores.2008.09.002
519
29. Bouche, E.; Vergniolle, S.; Staudacher, T.; Nercessian, A.; Delmont, J.-C.; Frogneux, M.; Cartault, F; Le
520
Pichon, A. The role of large bubbles detected from acoustic measurements on the dynamics of Erta ‘Ale
521
lava lake (Ethiopia). Earth Planet. Sci. Lett. 2010, 295, pp. 37-48, DOI:10.1016/j.epsl.2010.03.020
522
30. Pering, T.D.; McGonigle, A.J.S.; James, M.R.; Capponi, A.; Lane, S.J.; Tamburello, G.; Aiuppa, A. The
523
dynamics of slug trains in volcanic conduits: evidence for expansion driven slug coalescence. J. Volcanol.
524
Geotherm. Res. Under Review.
525
31. Llewellin, E.; Del bello, E.; Lane, S.J.; Capponi, A.; Mathias, S.; Taddeucci, J. Cyclicity in slug-driven basaltic
526
eruptions: insights from large-scale analogue experiments. 2013, In: EGU General Assembly, Vienna.
527
32. Llewellin, E.W.; Burton, M.R.; Mader, H.M.; Polacci, M. Conduit speed limit promotes formation of
528
explosive ‘super slugs’. 2014, In: AGU Fall Meeting, San Francisco.
529
33. Kremers, S.; Wassermann, J.; Meier, K.; Pelties, C.; van Driel, M.; Vasseur, J.; Hort, M. Inverting the source
530
mechanism of Strombolian explosions at Mt. Yasur, Vanuatu, using a multi-parameter dataset. J. Volcanol.
531
Geotherm. Res. 2013, 262, pp. 104-122, DOI:10.1016/j.volgeores.2013.06.007
532
34. Mori, T.; Burton, M. The SO2 camera: a simple, fast and cheap method for ground-based imaging of SO2 in
533
volcanic plumes. Geophys. Res. Lett. 2006, 33, DOI:10.1209/2006GL027916
534
35. Bluth, G.J.S.; Shannon, J.M.; Watson, I.M.; Prata, A.J.; Realmuto, V.J. Development of an ultra-violet digital
535
camera for volcanic SO2 imaging. J. Volcanol. Geotherm. Res. 2007, 161, 47-56,
536
DOI:10.1016/j.volgeores.2006.11.004
537
36. Kantzas, E.P.; McGonigle, A.J.S.; Tamburello, G.; Aiuppa, A.; Bryant, R.G. Protocols for UV camera volcanic
538
SO2 measurements. J. Volcanol. Geotherm. Res. 2010, 194, pp. 55–60, DOI:10.1016/j.jvolgeores.2010.05.003
539
37. Parfitt, E.A.; Wilson, L. Explosive volcanic eruptions – IX. The transition between Hawaiian-style lava
540
fountaining and Strombolian explosive activity. Geophys. J. Int. 1995, 121, pp. 226-232,
DOI:10.1111/j.1365-541
246X.1995.tb03523.x
542
38. Palma, J.L.; Calder, E.S.; Basualto, D.; Blake, S.; Rothery, D.A. Correlations between SO2 flux, seismicity,
543
and outgassing activity at the open vent of Villarrica volcano, Chile J. Geophys. Res. Solid Earth. 2008, 113,
544
DOI:10.1029/2008JB005577
545
39. James, M.R.; Lane, S.J.; Houghton, B.F. Unsteady explosive activity: strombolian eruptions. In: Modeling
546
Volcanic Processes: The Physics and Mathematics of Volcanism, eds. S.A. Fagents, T.K.P. Gregg, R.M.C.
547
Lopes. pp. 107-129, 2013
548
40. Manga, M. Waves of bubbles in basaltic magmas and lavas. J. Geophys. Res. 1996, 101, pp. 17,457-17,465,
549
DOI:10.1029/96JB01504
550
41. Herd, R.A.; Pinkerton, H. Bubble coalescence in basaltic lava: Its impact on the evolution of bubble
551
populations. J. Volcanol. Geotherm. Res. 1997, 75, DOI:10.1016/S0377-0273(96)00039-X
552
42. Harris, A.J.L.; Dehn, J.; Calvari, S. Lava effusion rate definition and measurement: a review. Bull. Volcanol.
553
2007, 70, pp. 1-22, DOI:10.1007/s00445-007-0120-y
554
43. Llewellin, E.W.; Del Bello, E.; Taddeucci, J.; Scarlato, P.; Lane, S.J. The thickness of the falling film of liquid
555
44. Viana, F.; Pardo, R.; Yánez, R.; Trallero, J.L.; Joseph, D.D.. Universal correlation for the rise velocity of long
557
gas bubbles in round pipes. J. Fluid Mech. 2003, 494, pp. 379-398, DOI:10.1017/S0022112003006165
558
45. Campos, J.B.L.M.; Guedes de Carvalho, J.R.F. An experimental study of the wake of gas slugs rising in
559
liquids. J. Fluid Mech. 1988, 196, pp. 27-37, DOI:10.1017/S0022112088002599
560
46. Pinto, A.M.F.R.; Campos, J.B.L.M. Coalescence of two gas slugs rising in a vertical column of liquid. Chem.
561
Eng. Sci. 1996, 51, pp. 45-54, DOI:10.1016/0009-2509(95)00254-5
562
47. Joseph, D.D. Rise velocity of a spherical cap bubble. J. Fluid Mech. 2003, 488, pp. 213-223,
563
DOI:10.1017/S0022112003004968
564
48. Komasawa, I.; Otake, T.; Kamojima, M. Wake behaviour and its effect on interaction between spherical-cap
565
bubbles. J. Chem. Eng. Japan. 1980, 13, pp. 103-109, DOI:10.1252/jcej/13/103
566
49. Corsaro, R.A.; Pompilio, M. Dynamics of Magmas at Mount Etna, in Mt. Etna: Volcano Laboratory (eds A.
567
Bonaccorso, S. Calvari, M. Coltelli, C. Del Negro and S. Falsaperla), American Geophysical Union,
568
Washington, D. C. 2004, DOI: 10.1029/143GM07
569
50. Vergniolle, S.; Brandeis, G. Strombolian explosions: 1. A large bubble breaking at the surface of a lava
570
column as a source of sound. J. Geophys. Res. 1996, 101, pp. 20,433–20,447, DOI:10.1029/96JB01178.
571
51. Métrich, N.; Bertagnini, A.; Landi, P.; Rosi, M. Crystallization driven by decompression and water loss at
572
Stromboli volcano (Aeolian Islands, Italy), J. Petrol. 2001, 42, pp. 1471–1490,
573
DOI:10.1093/petrology/42.8.1471
574
52. Vergniolle, S.; Brandeis, G.; Mareschal, J.C. Strombolian explosions 2. Eruption dynamics determined from
575
acoustic measurements. J. Geophys. Res. 1996, 101, pp. 20,449–20,466, DOI:10.1029/96JB01925.
576
53. Harris, A.J.L.; Stevenson, D.S. Thermal observations of degassing open conduits and fumaroles at
577
Stromboli and Vulcano using remotely sensed data. J. Volcanol. Geotherm. Res. 1997, 76, pp. 175–198,
578
DOI:10.1016/S0377-0273(96)00097-2
579
54. Delle Donne, D.; Ripepe, M. High-frame rate thermal imagery of Strombolian explosions: Implications for
580
explosive and infrasonic source dynamics. J. Geophys. Res. Solid Earth. 2012, 117, DOI:10.1029/2011JB008987
581
55. Krishna, R.; Urseanu, M.I.; van Baten, J.M.; Ellenberger, J. Rise velocity of a swarm of large gas bubbles in
582
liquid. Chem. Eng. Sci. 1999, 54, pp. 171-183, DOI:10.1016/S0009-2509(98)00245-0
583
56. Mayor, T.S.; Pinto, A.M.F.R.; Campos, J.B.L.M. Vertical slug flow in laminar regime in the liquid and
584
turbulent regime in the bubble wake – Comparison with fully turbulent and fully laminar regimes. Chem.
585
Eng. Sci. 2008, 63, pp. 3614-3631, DOI:10.1016/j.ces.2008.04.020
586
57. Mayor, T.S.; Pinto, A.M.F.R.; Campos, J.B.L.M. On the gas expansion and gas hold-up in vertical slugging
587
columns – A simulation study. Chem. Eng. Prog. 2008, 47, pp. 799-815, DOI:10.1016/j.cep.2007.01.031
588
58. Chouet, B.; Dawson, P.; Ohminato, T.; Martini, M.; Saccorotti, G.; Giudicpietro, F.; De Luca, G.; Milana, G.;
589
Scarpa, R. Source mechanisms of explosions at Stromboli Volcano, Italy, determined from moment-tensor
590
inversions of very-long period data. J. Geophys. Res. 2003, 108, DOI:10.1029/2002JB001919
591
59. James, M.R.; Lane, S.J.; Chouet, B.; Gilbert, J.S. Pressure changes associated with the ascent and bursting of
592
gas slugs in liquid-filled vertical and inclined conduits. J. Volcanol. Geotherm. Res. 2004, 129, pp. 61-82,
593
DOI:10.1016/S0377-0273(03)00232-4
594
60. Capponi, A.; James, M.R.; Lane, S.J. Gas slug ascent in a stratified magma: Implications of lfow organisation
595
and instability for Strombolian eruption dynamics. Earth Planet Sci. Lett. 2016, 435, pp. 159-170,
596
DOI:10.1016/j.epsl.2015.12.028
597
61. McGonigle, A.J.S.; Pering, T.D.; Wilkes, T.C.; Tamburello, G.; D’Aleo, R.; Bitetto, M.; Aiuppa, A. Ultraviolet
598
imaging of volcanic plumes: a new paradigm in volcanology. Geosciences. 2017, 7,
599
DOI:10.3390/geosciences7030068
600
62. Aiuppa, A.; Federico, C.; Paonita, A.; Giudice, G.; Valenza, M. Chemical mapping of a fumarolic field: La
601
Fossa Crater, Vulcano Island (Aeolian Islands, italy). Geophys. Res. Lett. 2005, 13,
602
DOI:10.1029/2005GL023207
603
63. Shinohara, H. A new technique to estimate volcanic gas composition: plume measurements with a portable
604
multi-sensor system. J. Volcano. Geotherm. Res. 2005, 143, pp. 319-333, DOI:10.1016/j.volgeores.2004.12.004
605
64. Allard, P.; Burton, M.; Muré, F. Spectroscopic evidence for a lava fountain driven by previously
606
accumulated magmatic gas. Nature. 2005, 433, pp. 407-410, DOI:10.1038/nature03246
607
65. Aiuppa, A.; Moretti R.; Federico C.; Giudice G.; Gurrieri S.; Liuzzo M.; Papale P.; Shinohara H.; Valenza M.
608
Forecasting Etna eruptions by real-time observation of volcanic gas composition. Geology. 2007, 35, pp.
![Table 1. Slug length and repose time data associated with rapid strombolian activity on Yasur volcano (Kremers et al., [33] Table 2) in addition to calculated explosive gas volumes](https://thumb-us.123doks.com/thumbv2/123dok_us/7925159.1315899/9.595.178.416.374.548/associated-strombolian-activity-kremers-addition-calculated-explosive-volumes.webp)
