Abstract
JI QI. Benefits, Costs and Carbon Abatement of Building Efficiency Standards in China. (Under the direction of Dr. Michael Roberts).
In response to rising energy prices, and possibly in an effort to curtail climate change,
Chi-na’s central government recently implemented national Building Energy Efficiency (BEE)
standards in order to reduce the energy consumption and carbon emissions relative to GDP.
In 2005, China set efficiency targets in its 11th Five-Year plan that required newly
con-structed buildings to be 50 percent more efficient than buildings concon-structed in the 1980s. In
subsequent years, the great majority of provinces improved building efficiency in accordance
with the new standards but different stringencies were adopted in different provinces at
dif-ferent times. In this thesis I exploit differences in timing and stringency levels coupled with
province-level panel data on building construction costs to estimate the costs of
implement-ing the new efficiency standards. Usimplement-ing these cost estimates, I evaluate the net present value
of investments stemming from BEE change for 15 provinces located in northern part of
Chi-na. I also evaluate the implicit cost of carbon abatement associated with these investments. I
find investment tied to the 50 percent and 65 percent energy reduction standards increased
construction costs by 9.2% and 19.4% respectively. The net present values of these
invest-ments depend on (a) the expected future path of energy prices; (b) the marginal value of
car-bon abatement; and (c) the rate at which future energy and carcar-bon savings are discounted to
the present. Over a wide range of plausible values for these three factors I find the 50 percent
standard had a positive net present value for all 15 provinces in northern China. This is true
I develop a carbon abatement cost curve spanning both efficiency standards and all
provinc-es. This curve shows the cost of carbon abatement in northern China was negative, even if
Benefits, Costs and Carbon Abatement of Building Energy Efficiency Standards in China
by Ji Qi
A thesis submitted to the Graduate Faculty of North Carolina State University
In partial fulfillment of the Requirements for the Degree of
Master of Arts
Economics
Raleigh, North Carolina 2010
APPROVED BY:
Dr. Roger H. Von Haefen Dr. Howard D. Bondell
ii
Biography
Ji Qi was born in a Chinese city Chanchun, popularly known as the City of Car. He is the son
of Qi Guohua and Fei Richen. He attended Jilin Province Experimental High School in
Changchun, China. Following his graduation from high school in 2005, he was admitted to
Zhejiang University where he received his Bachelor of Science degree in Energy and
Envi-ronment system engineering in 2008. He moved to the United States in 2008 to pursue
iii
Acknowledgements
I would like to acknowledge my indebtedness to several people. First and foremost, I would
like to express my appreciation for my advisor, Dr. Michael Roberts. His ideas, guidance,
curiosity and challenge made this work happen. I also extend my gratitude to my advisory
committee members Dr. Roger Haefen and Dr. Howard Bondell for their insights and
sug-gestions. Tamah Morant, Director of the Economics Graduate program has been an immense
source of support in advising me at every step of the program. I also thank all my professors
an North Carolina State University.
I thank my parents Qi Guohua and Fei Richen for all their support, encouragement and love.
Special thanks to Cici for her understanding, sacrifices and accompany. I also want to say
thank you to Uncle Gao, Uncle Guo, Uncle Ouyang, Uncle Li, Uncle Min and Aunty Luan
for the help and care.
I would also like to mention about my great friends who gave me the extra energy throughout
the years when times were tough. I want to say thanks to Pinye, Shun, Zhi, Tianfang, Yun,
Bidong, Zhangxin and other “3+1” friends. I would like to thank my colleagues Tengying,
iv
Table of Contents
List of Tables ... vi
List of Figures ... vii
1 Introduction ... 1
2 Background ... 6
2.1 Context of China’s building sector ... 6
2.2 Heating and cooling in North China ... 7
2.3 China BEE standards ... 9
2.3.1 National standards ... 9
2.3.2 Regional standards ... 10
3 Data ... 12
3.1 Building Construction Cost Characteristics ... 12
3.2 Building Energy Consumption Characteristic ... 15
4 Regression Analysis ... 17
4.1 Timing of Local BEE Change ... 18
4.2 Estimation Models ... 21
4.3 Regression results ... 27
5 Net Present Value Analysis ... 35
5.1 Upfront cost associated with BEE improvement ... 37
5.2 Benefit of energy saving ... 37
5.3 Benefit of carbon emission abatement ... 40
5.4 Discount rate ... 41
5.5 Results ... 45
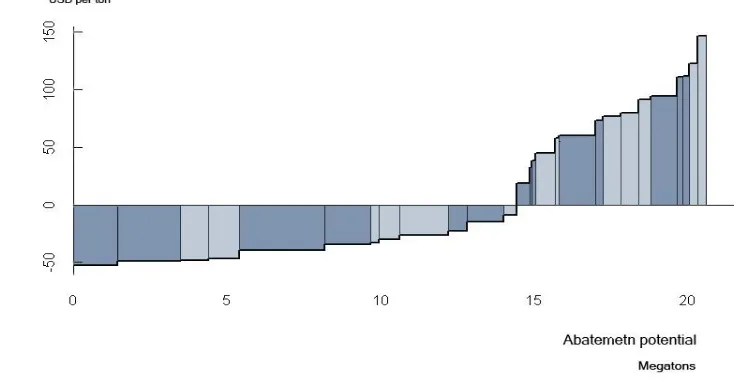
6 Carbon Emission Abatement Curve ... 50
7 Conclusion ... 57
v
Appendices ... 64
Appendix A: Research Area ... 65
Appendix B: Effect estimates ... 67
Appendix C: Analysis of NPV of BEE improvement ... 68
Appendix D: Comparison of Carbon Emission Abatement Curves under Different Discount rate ... 75
vi
List of Tables
Table 1 Estimates for BEE change effect ... 31
Table 2 Estimates for BEE change effect (excluded Beijing obverstaions) ... 32
Table 3 Estimates costs of 50 percent BEE adoption ... 33
vii
List of Figures
Figure 1Central Heating Price ... 8
Figure 2 Trend of building construction cost (2001-2008) ... 15
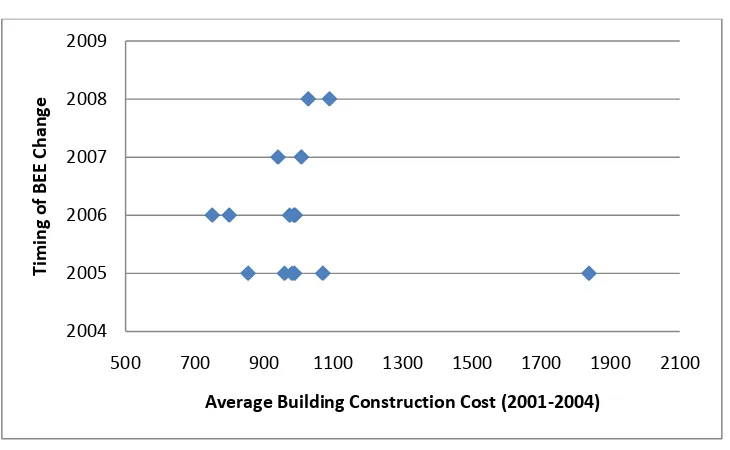
Figure 3 Time of BEE Changed ... 18
Figure 4 Political Process for BEE Implement ... 20
Figure 5 Timing of BEE Change V.S. Average cost ... 20
Figure 6 Coal Price Trend ... 42
Figure 7 Net present value of investment on BEE improvement for Beijing ... 47
Figure 8 Carbon abatement curve for new construction building in 2008 (discount rate=5%) ... 51
Figure 9 Carbon emission abatement curve (discount rate = 1%) ... 54
Figure 10 Carbon emission abatement curve (discount rate = 8%) ... 54
Figure 11 Central Heating Regions ... 65
Figure 12 Climate Regions ... 66
1
1 Introduction
Improving energy efficiency and reducing carbon emission are increasingly important
components of policy in China. In 2009, China announced that by 2020 it would reduce its
energy intensity of GDP by 40 to 60 percent and carbon emissions intensity of GDP by 40 to
45 percent compared with 2005. China claimed that these targets would be "a binding goal"
incorporated into China's medium and long-term national social and economic development plans (China’s state council, 2009).
Much attention is focused on improving building energy efficiency (here after “BEE”), as energy used to heat, cool and light buildings consumes more than 20 percent of
final energy consumption in China, and is projected to rise to 25 percent by 2030 (Li, 2008). According to Mckinsey’s estimates, China’s building sector contributes about one fifth of the
country’s carbon emissions and will increase by an average of 80 million tons a year to reach
3.2 gigatons by 2030, an amount equal to about 1.6 times of the total carbon emission of EU
in 2007. At the same time, China’s building sector has 1.1 gigatons of carbon emission
ab-atement potential, nearly 70 percent of which has a negative carbon emission abab-atement cost,
according to Mckinsey (2006).
BEE standards are the primary policy instrument for influencing the energy efficiency
of newly constructed buildings. BEE standards set energy efficiency targets and often require
the installation and use of specific types of equipment and materials. The reason standards
2
services. Buildings and households connected to the centralized heating system pay for
cen-tral heating based on the heated area of the apartment rather than actual energy use.
Fur-thermore, households cannot control the level of heating use themselves. Holding these
insti-tutional features fixed makes BEE standards a crucial factor for energy efficiency.
Alterna-tively, China could like increase energy efficiency significantly by decentralizing the heating
system and charging for energy consumption. Estimating the costs and benefits of such
large-scale institutional changes is beyond the scope of this thesis.
The great majority of provinces have region BEE standards that set an energy saving
target based on the national BEE standard for newly construction buildings. In recent years, a
growing interest in energy security and climate change has increased the policy relevance of
BEE standards. In 2005, China central government released new building energy efficiency
target in its 11th Five-Year plan. It required new construction buildings to achieve at least 50
percent energy efficiency compared with that of 1980 level. In the following years,
individu-al provinces improved their BEE standards as specified by the 11th Five-Year plan, but were
allowed to develop specific terms of the plan locally, and were also given some flexibility as
to time of implementation of the standards. As a result, different provinces adopted new
standards at different times.
Despite such sweeping changes to residential BEE standards, surprisingly little is
known about how BEE standards affect building construction cost in practice and how these
costs relate to emission reductions associated with different BEE standards. This study
3
where heating service is controlled and operated by local government as social welfare. I
ex-amine province-level building construction costs, energy efficiency performance and carbon
emission abatement before and after each local government changed their region BEE
stan-dard from 2001 to 2008. Compared to the 1980 building energy consumption level, evidence
shows that new construction building energy consumption per square meter has declined
sig-nificantly. In the meantime, buildings construction costs have increased 5 percent-20 percent.
Based on the estimated costs of implementing the standards and the estimated energy
savings that resulted from them, I conduct net present value (NPV) analysis of investments
made in accordance with the 50 percent energy saving BEE standards and 65 percent energy
saving BEE standards. Separate estimates are calculated for each of the 15 provinces located
in north part of China under three assumed discount rates (1%, 5%, 8%) and carbon emission
values ranging from 0 to 250 dollar per ton. The analysis indicates the 50 percent standard
had a positive net present value for all 15 provinces in northern China, even when carbon
emission abatement is set equal to zero and the high discount rate (8%) is used.
This study is germane to understanding the broader costs of abating carbon emission.
This literature has shown that optimal BEE standards vary cross regions and depends on a
variety of factors including increment construction cost ( Ri 2009; Wang, 2009), energy price
(Li, 2008), and carbon emission price (Mckinsey, 2006). This literature examines the
rela-tionship between optimal BEE standards and discount rates (Li, 2009). This literature also
projects the carbon emission abatement potential related to BEE improvement (Mckinsey,
4
Former evaluations are typically based on case studies using engineering approach
that compare building construction cost and energy efficiency performance of a baseline
pre-standard-change building to that of a baseline post-pre-standard-change building. While such
ap-proach is useful in many respects, it has some of potential limitations. First, data collected
from small number case studies cannot reflect the average construction cost and energy
per-formance, across multiple regions. Second, few of former studies consider the discount rate
or the net present value when evaluating the BEE improvement. Third, earlier studies do not
consider relative carbon emission abatement potential. Moreover, although most of these
studies indicate that BEE improvement will benefit China’s future, the optimal BEE standard
for each region has not been considered.
The research presented in this thesis attempts to fill these gaps in several ways. First,
this study uses data of province-level construction cost data from China’s fixed asset
invest-ment statistical year book (2001-2008) and China building energy efficiency report to
ana-lyze building construction costs before and after the BEE standard change. New construction
building energy efficiency performance on heating, cooling and lighting will be examined for
energy efficiency part of thesis. Second, NPV analysis of investment on 50 percent energy
saving BEE and 65 percnt energy saving BEE is estimated for all 15 provinces using a range
of discount rates. In addition, the NPV analyses consider a schedule of carbon emission
re-duction values ranging from 0 to 250 US dollar per ton. These values are also presented in
the form of a carbon emission abatement cost curve. The cost curve considers both the 50
5
show how total carbon emission abatement potential vary with the per-ton cost of carbon
ab-atement.
The organization of the thesis is as follows. Section 2 provides the background
infor-mation of China building sector, China heating service system and China BEE standards.
Sections 3 and 4 describe the data and regression analysis. Section 5 presents estimates of
NPV of investment on BEE improvement for each province under a variety of specifications.
Section 6 presents the carbon emission abatement curve. Section 7 concludes the key
6
2 Background
2.1 Context of China’s building sector
The Chinese residential building sector consumes approximately 20 percent of the country’s final energy and this number is expected rise by 1.1 percent every year (Li, 2008).
With the rapid growth of economic development and continues urbanization, China is
expe-riencing a peak of building construction. Meanwhile, a lot of existing buildings are being
demolished and are being replaced by new ones the life cycle of buildings in China is very
brief compared with that of buildings in industrialized countries. From 1990 to 2002, the
an-nual growth rate of the building sector was as high as 15.5 percent, making this industry one
of the most dynamic sectors of the country’s economy (German Development Institute,
2008).
According to the World Bank’s estimates, China’s residential buildings consume
be-tween 50 to 100 percent more energy for space heating compared with buildings in similar
cold climates in Europe or North America, while still offering far less comfort. Several
stu-dies have shown that by enhancing the BEE standards, China can reduce its energy
consump-tion and carbon emission at low cost ( Ri 2009; Wang, 2009). Accordingly, China’s potential
to reduce energy consumption through enhancing BEE is enormous.
In addition, the potential benefit of enhancing BEE is mitigating climate change.
7
primary sources of carbon emissions. Therefore, China carbon emission will be abated with
the reducing of its energy consumption.
2.2 Heating and cooling in North China
In the Northern climate zones (“very cold” and “cold zone”) most heating is
centra-lized and provided by the local government as social welfare. These centracentra-lized systems
con-nect most buildings in urban areas and almost all the newly constructed buildings to a
centra-lized furnace. Because individual buildings do not have furnaces, there is no
building-specific monitoring of energy consumption. In cold zone provinces, like Beijing and Tianjin,
about 80 percent of all apartments have access to coal-fired central heating. Liaoning, in very
cold zone, for instance, almost 100 percent of the newly constructed apartments are
con-nected to the central heating system.
Buildings and households connected to the centralized heating system pay for central
heating based on the heated area of the apartment rather than actual use. Prices per square
meter, shown in Figure 1, are fixed and vary across provinces. Central heating is only
availa-ble during the heating season and is provided independent of outdoor temperatures. For
ex-ample, in Beijing central heating is operated from 15 November to 15 March. In China,
cen-tral heating supply systems are still one-pipe heating systems where heat cannot be controlled
individually. Room temperature depends on the location of the apartment and temperature
8
about 15−30 percent of individual household incomes (World Bank, 2001). The employer
either pays the heating bill directly or transfers a subsidy for heating to employees.
Energy costs for the remaining individual heating systems are billed according to
consumption. In general, they are more expensive than central heating, but they have the
ad-vantage that the room temperature can be regulated individually and that heating systems can
be turned on before or after the heating periods.
Figure 1Central Heating Price
On the other hand, cooling is not provided centrally in Northern China. In some parts
of north China, during the hot summer, air conditioners are being increasingly used more and
more. Electricity costs for cooling with air conditioners have to be paid directly by the
households according to consumption.
In China’s 11th Five-Year Plan for National Economic and Social Development
(2006-2010), the Chinese government set the target to decrease new construction buildings
24 26 22 16.5
23.1 28 29 34.8
19.222.8 26
21 22.525.8 22 0
10 20 30 40
9
energy consumption at least by 50 percent. The building sector is considered to be one part of
the general energy strategy. Because of the unique way of charging households for heating
services such that the heat area and households cannot control the heating use themselves,
BEE standards the crucial factor for energy efficiency.
2.3 China BEE standards
BEE standards are the command-and-control measures of building construction in
China. BEE standard regulate goals and technologies buildings must reach and comply with.
BEE standards set energy efficiency targets and often require the installation and use of
spe-cific types of equipment. In China, there are national as well as regional standards and
stan-dards for public and commercial as well as residential buildings. BEE stanstan-dards only refer to
newly constructed buildings.
2.3.1 National standards
According to the “Standard of Climatic Regionalization for Architecture” (GB
50178-93), China is divided into five climate zones: “very cold”, “cold”, “hot summer and cold win-ter”, “hot summer and warm winter” and “warm”. Starting in 1986, the Chinese government
issued several standards referring to BEE in these different climate zones.
In 11th Five Year Plan, China’s central government set the target for new construction
buildings to reduce energy consumption at least by 50 percent based on the energy
10
buildings” (GB 50189-2005) was approved in 2005, which contains the target of a 50 percent
reduction in heating, cooling ventilation, air conditioning and lighting energy. After 2005, in
the following years, local governments released their own region BEE standards which
re-quire 50 percent energy saving compared with building built in 1980s, for new construction
residential buildings.
2.3.2 Regional standards
In China, local governments can set their own standards that differ from the national
standards so as long as they are more stringent. One example is the 65 percent standard in
Beijing and two other municipalities, which exceeds the national one of 50 percent
(saving design standard for the heating of residential buildings DBJ 01-602-2004,
energy-saving design standard for the heating of public buildings DBJ 01-621-2005). Apart from the
national standards, there are specific standards for the different climate zones in China:
The “Energy Design Code for Heated Residential Buildings” (JGJ 26-86) of 1986
was issued for the very cold and cold zones. The goal was a 30 percent decrease in energy consumption relative to “base buildings” constructed in 1980-81. The standard was revised in
December 1995 and renamed “Energy conservation design standard for new heated
residen-tial buildings” (JGJ 26-95). The new increased energy saving target was 50 percent. However,
due to lax monitoring and enforcement of standards by the government, only 5 percent
build-ings constructed after 1995 meet JGJ 26-95 standard. The average energy efficiency
11
those built under JGJ 26-95 use 37 percent less energy that those built in 1980-81 (China
ar-chitecture research group, 2005). This situation changed after 2005, since local governments
of northern China provinces successively announced their own local BEE standards and
re-lated regulations. Monitoring and enforcement of standards now appears more vigorous.
Design and construction of new buildings that do not meet local BEE standards are
prohi-bited and newly buildings that do not pass energy efficiency examinations are not be allowed
12
3 Data
I use province-level building construction data from China national yearly statistic
census and each province’s yearly statistical publication combined with detailed information
on building energy consumption from China 11th Year Plan, China Building Energy
Efficien-cy design standards, China Ministry Housing and Urban-Rural Development and China
de-velopment and reform commission.
3.1 Building Construction Cost Characteristics
Building construction cost characteristics come from China’s fixed asset investment
year book and the China statistical year book. These data resources are a comprehensive
in-ventory of building construction costs, new construction area and building floor area in each
year and each province of China. Much of the information in China’s fixed asset investment
year book and China statistical year book come from China’s national Statistical Bureau,
each Province’s Statistical Bureau and related official departments, comes from a form
com-pleted annually by all city and construction companies.
The analysis focuses on the buildings built between 2001 and 2008, between 2000
census and the 2009 census. China’s central government released its 11th five year plan,
which gave the new construction BEE targets, in 2005. Then, local governments improved
13
pass the energy efficiency test will not issue the construction permit and residential buildings
that do not pass the energy efficiency examine cannot be sold in the market.
Evidence shows that construction cost in each province increased visibly in the year
when province announced to implement new BEE standards. The incremental cost for new
construction buildings achieving 50 percent energy efficiency will be about 200 yuan per
square meter (Wang, 2009). Cases studies of construction cost of newly construction
ings reaching 50 percent energy efficiency increase 5 percent-15 percent compared to
build-ings without BEE standards. Figure 2 shows examples of how construction cost increased as
BEE standards changed. Beijing announced in 2006 that newly constructed buildings would
achieve 65% energy efficiency compared with the 1980 level. And the average construction
cost per square meter increased by 267 yuan after new BEE standard was set. Shandong and
Intermargo announced that newly construction buildings must meet a 50 percent energy
effi-ciency standard in 2005 and average construction cost per square meter increased 129 and
123 yuan respectively in the same year.
Public buildings are excluded from the BEE standards because they are built for
dif-ferent purposes, such as schools, hospitals and shopping malls, so there are no uniform
mate-rials and building techniques that can be easily specified. The relevant laws for public
build-ings therefore are not as complete as residential buildbuild-ings. For example, a big shopping mall
cannot use the same BEE standards as the school. Moreover public buildings do not have a
14
An advantage of using province-level data is broad geographic coverage.
Province-level data provide information for the building construction cost that reported by more than
95 percent construction companies in each province, even small companies with small little
construction area are represented proportionally in the sample. Use of long-term
province-level nature data rather than real case studies as most relative research can exclude
uncertain-ties like construction process cost and specific design, or indirect costs that may be
15
Figure 2 Trend of building construction cost (2001-2008)
3.2 Building Energy Consumption Characteristic
The building energy consumption characteristic used in this analysis comes from
China Building Energy Efficiency design standards (JGJ26-95 and JGJ26-86) and New
Con-0 1000 2000 3000
2001 2002 2003 2004 2005 2006 2007 2008
Co n str u ci o n t co st
Trend of Beijing Construction cost (BEE change in 2006)
0 500 1000 1500
2001 2002 2003 2004 2005 2006 2007
Co n str u ci o n Co st
Trend of Shandong Construcion Cost (BEE change in 2006)
0 500 1000 1500
2001 2002 2003 2004 2005 2006 2007
Co n str u ci o n Co st
16
struction Building Energy Consumption Investigation conducted by Tsinghua University.
Energy consumption characteristic include coal consumption for heating, cooking per square
meter, electricity consumption for lighting, cooling and appliance per square meter.
China Building Energy Efficiency design standard (JGJ26-86) is the baseline energy
consumption that used for calibrating all other BEE standards. JGJ26-86, established by Chi-na’s central government, is the energy consumption standard for buildings built in 1980-1981.
This standard established, by climate region and season, a specific amount of coal needed for
heating and lighting for each province. Subsequent standards were set in relation to the
1980-81 standards. In JGJ26-95, the central government set a target to achieve a 50 percent
reduc-tion in energy use relative to the 1980-1981 building energy consumpreduc-tion level. The
stan-dards also set heating coal consumption quota for each province. Data on electricity
con-sumption for appliances are excluded because the energy efficiency for appliances is not
17
4 Regression Analysis
The change of BEE in each province, the timing of change and the data on building
construction cost provides an opportunity to examine the effect of BEE standard
improve-ment on building construction cost. This section describes our empirical strategy and results.
My data come from the observations of province-level average building construction cost of
15 provinces between 2001 and 2008.
The regression models, described in section 4.2, use standard panel regression
tech-niques that include year and province fixed effects. In a model with these fixed effects,
iden-tification of the effect of BEE standards changes on building construction costs follows from
differences in the timing of BEE standard implementation across provinces. The critical
ex-ogeneity assumptions rest on the idea that the timing of standard implementation is not
asso-ciated with time-varying heterogeneity across regions. In other words, the timing of standard
implementation cannot be associated with other, unobserved factors that may have otherwise
caused costs to rise or fall around the time of implementation. I therefore provide background
information in section 4.1 on province-level implementation of building standards. While the
exogeneity assumption is not testable, the nature of the process that gives rise to differences
in timing does not suggest any obvious cost-related factors that would confound the
18
4.1 Timing of Local BEE Change
Figure 3 shows the timings of local BEE change. The central government sets the
ef-ficiency target while the timing of local BEE change and detail work is decided by local
gov-ernments.
19
The political system of China is centralized organization, characterized by that central
government that formulates major national policy and local government implement it in
de-tails. And in this process, local government can develop specific local policy, including
tim-ing to implement, based on central policy, local condition and local characteristics. While,
China is a large country with a large population, its economic development is unbalanced and
varies cross regions. Therefore, central government policies set broad guidelines that cannot
be implemented mechanically by local government. In the case of BEE standards change,
the central government set the national BEE standard and then local governments had to
im-plement the policy through local political processes. Local governments therefore decide the
specific standards, laws and auditing systems used in each province. The timing of BEE
standards basically follows from political process takes time and can vary across regions,.
Timing of BEE change is basically decided by how long the political process takes. For
ex-ample, Beijing, the capital of China, change its local BEE standard to 65 percent BEE in
2006 follow the central government, since Beijing has relative complete BEE laws, audit
sys-tem and human resource. In contrast, Xinjiang do not have any BEE standard until 2005,
hence it takes much longer for Xinjiang to set up the BEE system. Until 2008, Xinjiang
changed its local BEE standard to 50 percent energy efficiency BEE standard.
In addition, we examined the relationship between the timing of BEE change and
aver-age building construction cost before national BEE change to see whether the timing of local
BEE change correlated with local building construction cost before national BEE change.
20
timing looks random. This result also provides evidence to support the assumption the BEE
adoption is exogenous.
Figure 4 Political Process for BEE Implement
Figure 5 Timing of BEE Change V.S. Average cost 2004
2005 2006 2007 2008 2009
500 700 900 1100 1300 1500 1700 1900 2100
Ti
m
in
g o
f B
EE
Ch
an
ge
21
4.2 Estimation Models
I begin with a standard panel regression model to estimate the effect of BEE change
on construction cost with linear regression models of the form
ln costit = Provincei + Yeart + γ1BEE50% + γ2BEE65% + ϵit
(1)
costit = Provincei + Yeart + γ3BEE50% + γ4BEE65% + ϵit
(2)
Where the dependent variables, ln costit and costit are the natural log of building construction cost and real construction cost respectively; i indexes province; t indexes year;
Provincei is a dummy variable for each of the 15 provinces that locate in north China. It con-trols time constant region-to-region shocks in building construction cost, such as local labor
price, local price-level, and other local construction operation fees; Yeart is a dummy varia-ble for each of years (2001-2008) that controls for year-to-year shocks common to all
prov-inces, such as raw material price change and price inflation. I have estimated province and
year fixed effects to remove any kind of collinearly problem may exist between region
cha-racteristics, time period and building construction cost change during this particular time
pe-riod. BEE50% and BEE65% are indicator variables for whether 50 percent BEE or 65
per-cent BEE standard be implemented; ϵit is a normally distributed error term, which may
22
The critical assumption is that the error is not correlated with BEE standards
condi-tional on the fixed effect controls (i.e., the timing of standards implementation). Here I
dis-cuss some possible sources of error so that readers can judge the plausibility of this key
as-sumption. First is the efficiency of the construction management and the weather during the
construction.Because labor cost and materials cost are big part of building construction cost,
better management performance may improve the construct efficiency and lower the cost.
Second is the weather condition during the construction period, if buildings are constructed
during some bad weather condition like snow or big wind, the construction period will be
longer, as a result, the cost would be higher. Third is the data collection issue. The building
construction data are reported by the China fixed asset year book. However, I do not know
exactly how the survey is conducted. Therefore if there are some possibilities like the
com-panies overstate or understate their cost, it may affect the report construction cost. Fourth, I
assumed the BEE standards are complied after local governments change the BEE standard.
Although, local governments forced new constructed building to implement BEE standard
and those do not implement BEE standard cannot be sold in the market, I still cannot rule out
the possibility few of the new construction building do not fully implement local BEE.
How-ever, it is not clear how these various unobserved factors might be correlated with the timing
of BEE changes.
The estimates of γ1 and γ2 are of primary interest, as they capture the relative
differ-ence in building construction cost between provinces that implemented BEE standard with
23
than zero would, for instance, are consistent with the BEE improvement causing an increase
in building construction cost. In a more flexible specification, Model (3), I ruled out the year
dummies to measure the relative difference in building construction cost between provinces
that implemented BEE standard earlier with those implemented BEE standard later. Further, I
test the specification, Model (4) without province dummies to see relationship between the
construction cost level and BEE adoption timing. I report these results in table 1.
ln costi = Provincei + γ1BEE50% + γ2BEE65% + ϵi
(3)
ln costt = Yeart + γ1BEE50% + γ2BEE65% + ϵt
(4)
I further examine models that allow the costs of standard implementation differ across
locations due to climate and local level of economic develops. Different regions of China
have been developing at different rates and it stands to reason that costs of BEE standards
change may also vary across regions. Costs may systematically differ between greater and
lesser developed areas due to differences in labor costs or costs of transporting raw materials,
or other factors. On the one hand, the effect of BEE change on building construction costs
could be greater in more developed areas due to relatively higher labor cost and operation
fees. However, it is also possible that the effect of BEE change on construction cost is less
24
may also differ across climates (very cold regions verses cold regions). Common technology
of building energy efficiency is wall and ceiling insulation, costs may greater in very cold
region due to the thicker walls and ceilings. Nevertheless, it is also possible that the cost may
be greater in cold region, because cold region usually have to invest more in design and other
technology to achieve the same energy efficiency target than very cold region.
In model (5) and model (6), I exclude the data of some province with 65 percent
energy saving BEE standard, because all provinces that implement 65 percent BEE are
lo-cated in high GDP and cold region. High and low economic develop level region are defined
by the level of GDP per capita. Provinces where GDP per capita in 2008 exceeds 20000 yuan
are High economic develop level region and less than 20000 yuan are low economic develop
level region.
ln Costit = Provincei + Yeart +γBEE50% +𝜃GDP*BEE50% + ϵit
(5)
Where BEE 50% is a dummy variable for whether building construction under
specif-ic BEE standard; GDP*BEE 50% is the cross effect of developed level and BEE
improve-ment. The estimates of γ and 𝜃are of primary interest. A positive value of 𝜃indicates the
in-vestment on BEE improvement cost more in high developed area than low developed area.
25
I also divide provinces by very cold region and cold region. The definition of Climate
regions is consistent with that given by China develop and reform committee. In the sample,
8 provinces, including Jilin, Heilongjiang, are located in very cold region and the rest 7
prov-inces less cold region. I estimate the effect of BEE improvement in different climate region
using follow model:
ln Costit = Provincei + Yeart +γBEE50% +𝜑Climate*BEE50% + ϵit
(6)
Where Climate*BEE50% is the cross effect of climate and BEE improvement. 𝜑 is
the coefficient of interest. If 𝜑 is positive, it implies the building construction cost increase
more in cold region caused by BEE improvement.
Lastly, I consider the interaction of 50 percent BEE adoption and average local winter
temperature of each province, and the interaction of 50 percent BEE adoption and GDP per
capita of each province, to account for heterogeneous variation in costs in a more continuous
matter. This model is:
ln Costit = Provincei + Yeart +γ BEE50% + μ GDP per Capita_2001*BEE50% +
δ Aver_Winter_Temp*BEE 50% +ϵit ,
(7)
26
increase of building construction cost for each province instead of an average percentage
27
4.3 Regression results
Table1 presents the results of the regressions relating building construction costs with
implementation of BEE standards changes.
In column (1), the estimated coefficient of BEE standard improvement, γ1 is positive
and it is 0.092. This coefficient gives the estimated proportional difference in building
con-struction cost that occurs with the adoption of BEE 50 percent standard. It implies adoption
of 50 percent standard increases the building construction cost by 9.2 percent. The parameter
γ2 measures the effect of the 65 percent energy saving BEE standard on building construction
cost, holding all else the same. The estimated value of γ2 is positive and its value is 0.194.
This implies adoption of 65 percent BEE may increases the building construction cost by
19.4 percent, holding all else the same. The p-values associated with these estimates of γ1
and γ2 are less than 0.001. Based on the F-test, province fixed effect and year fixed effect are
statistically significant. These estimates come from the fixed effect model, which I use as a
baseline.
The only difference between model 1 and model 2, reported in column 2 of table 1, is
that the first considers the natural log of cost and second uses the level of cost. In the second
model the estimated coefficients of BEE standard improvement, γ3 and γ4are 267.37 and
784.38 for the 50 percent and 65 percent standards, respectively. This implies that average
building construction cost per square meter will increase by 267.37 yuan when new
28
nothing and 784.38 when complying with 65 percent energy saving standard. The p-value of
γ 3 and γ 4 are also less than 0.001. I compare the residual distribution (see appendix E) and
find the model (1) is the more appropriate model.
Column (3) reports estimates obtained without year dummies. This model identifies
the effect of BEE standard using only variation in costs over time. The coefficient for 50
per-cent BEE and 65 perper-cent BEE are 0.135 and 0.258 respectively. Comparing the estimates, I
found the BEE change effect on building construction cost is greater when excluding year
dummies. The explanation for higher coefficient of BEE change is likely due to a general
trend in building construction cost that confounds the effect of BEE standards given the
stan-dards were generally in place later in the sample and no in place earlier in the sample.
Column (4) reports the estimates of baseline model excluding province dummies.
This model identifies the effect of BEE standards using only variation in costs over the cross
section of provinces. The coefficient for 50 percent BEE and 65 percent BEE are 0.126 and
0.35 respectively. The estimates are greater compared with my base model. The main reason
for the difference is likely due to Beijing. Beijing had already implemented 50 percent
ener-gy saving BEE standard in 2001 and Beijing is the only province that implement 50 percent
energy saving BEE before 2005. As the capital of China, Beijing’s building construction
costs are also much higher compared to the national average. Beijing changed to 65 percent
BEE standard in 2006 and it is also the first province that implemented 65 percent BEE
stan-dard. To examine the effect of Beijing I repeated all of the regressions while excluding all
29
BEE effect declines significantly in the cross-sectional regression that excludes year fixed
effects. The results excluding the Beijing observations are reported in table 2. From table 2,
we can see the BEE change effect, both 50 percent BEE and 65 percent BEE, are still
signifi-cant. The coefficient of 50 percent BEE change effect is relative small compare with that in
table 1 and the coefficient of 65 percent BEE change is greater, however, the estimates do not
change much. The estimates of model 3 and model 4 are very similar.
Column (5) of tables 1 and 2 reports estimates of model 5, which includes interaction
effects that allow the estimated cost of the 50 percent BEE standards to vary over high-GDP
and low GDP regions. The estimated coefficients indicate the BEE standard increased
con-struction cost 5.7 percent in low-GDP regions and an addition 4.2 percent (9.7) in high-GDP
level regions. This can be explained by labor price, construction material price and relative
operation fees may be higher in high-GDP level region. Recall that this model excludes
ob-servations with the 65 percent standard.
Column (6) reports results from model 6, which includes interactions effects that
al-low the estimated cost of the 50 percent BEE standards to vary by climatic region (cold and
very cold). The estimated coefficients indicate the 50 percent BEE standard increased
build-ing costs 5.5 percent in the very cold region and an additional 6.2 percent in the cold region.
This result can be explained that cold region may require greater investments, such as thicker
walls with more insulation, to achieve the same proportional reduction in energy use.
Because costs of implementing the BEE standard clearly vary across regions, I
30
standard with climate, proxied by the average temperature during the winter months. These
results are reported in column (7). The estimated coefficients of the cross effect of BEE
standards change and average winter temperature is 0.00231, which indicates that cost of 50
percent BEE standard adoption will increase 0.231 percent as the local winter temperature
increase 1 degree. This is consistent with the results from model (6), which suggest the BEE
adoption cost is higher in cold region than very cold region. The estimated coefficients of the
cross effect of BEE standards change and GDP per capita is 8.14e-6 percent, which means
cost of 50 percent BEE adoption will increase 8.14e-6 percent as the local GDP per capita
increase 1 yuan. This is consistent with the results from model (5), which indicates 50
per-cent BEE adoption cost more in high GDP level region than in low GDP level region.
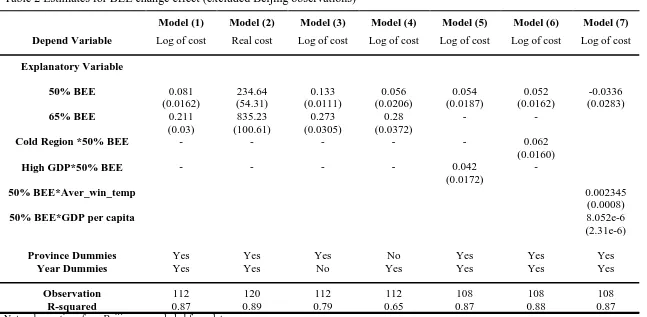
Cost estimates of 50 percent BEE adoption for each province from each model are
reported in table 3. Estimates from model (4) are not available because province dummies are
ruled out. In addition, in table 4, I report the cost estimates of 50 percent BEE from the
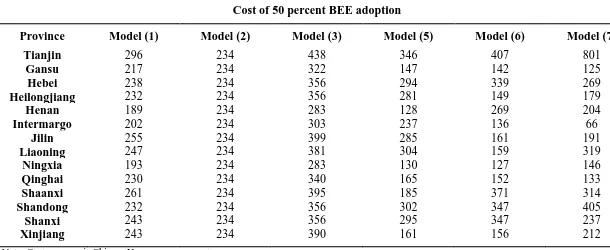
31 Table 1 Estimates for BEE change effect
Model (1) Model (2) Model (3) Model (4) Model (5) Model (6) Model (7)
Depend Variable Log of cost Real cost Log of cost Log of cost Log of cost Log of cost Log of cost
Explanatory Variable
50% BEE 0.092
(0.0155) 267.37 (51.51) 0.135 (0.0106) 0.126 (0.02) 0.057 (0.0189) 0.055 (0.0165) -0.0307 (0.0283)
65% BEE 0.194
(0.0286) 784.38 (95.06) 0.258 (0.0236) 0.35 (0.0334) - -
Cold Region*50% BEE - - - 0.062
(0.0164)
High GDP Region*50% BEE - - - - 0.042
(0.0176)
-
50% BEE*Aver_win_temp 0.00231
(0.0008)
50% BEE*GDP per capita 8.14e-6
(2.4e-6)
Province Dummies Yes Yes Yes No Yes Yes Yes
Year Dummies Yes Yes No Yes Yes Yes Yes
Observation 120 120 120 120 113 113 113
R-squared 0.9 0.89 0.85 0.66 0.87 0.88 0.89
32 Table 2 Estimates for BEE change effect (excluded Beijing observations)
Model (1) Model (2) Model (3) Model (4) Model (5) Model (6) Model (7)
Depend Variable Log of cost Real cost Log of cost Log of cost Log of cost Log of cost Log of cost
Explanatory Variable
50% BEE 0.081
(0.0162) 234.64 (54.31) 0.133 (0.0111) 0.056 (0.0206) 0.054 (0.0187) 0.052 (0.0162) -0.0336 (0.0283)
65% BEE 0.211
(0.03) 835.23 (100.61) 0.273 (0.0305) 0.28 (0.0372) - -
Cold Region *50% BEE - - - 0.062
(0.0160)
High GDP*50% BEE - - - - 0.042
(0.0172)
-
50% BEE*Aver_win_temp 0.002345
(0.0008)
50% BEE*GDP per capita 8.052e-6
(2.31e-6)
Province Dummies Yes Yes Yes No Yes Yes Yes
Year Dummies Yes Yes No Yes Yes Yes Yes
Observation 112 120 112 112 108 108 108
R-squared 0.87 0.89 0.79 0.65 0.87 0.88 0.87
33 Table 3 Estimate costs of 50 percent BEE adoption
Cost of 50 percent BEE adoption
Province Model (1) Model (2) Model (3) Model (5) Model (6) Model (7)
Beijing 386 267 471 436 505 957
Tianjin 344 267 410 354 430 820
Gansu 243 267 311 155 150 132
Hebei 273 267 349 302 357 277
Heilongjiang 261 267 349 288 157 188
Henan 212 267 277 135 284 208
Intermargo 232 267 297 245 143 73
Jilin 293 267 391 295 172 200
Liaoning 280 267 365 309 168 338
Ningxia 217 267 283 138 133 155
Qinghai 261 267 333 174 160 141
Shaanxi 300 267 383 199 392 319
Shandong 267 267 357 308 366 420
Shanxi 273 267 357 302 366 246
Xinjiang 280 267 374 170 164 221
Note: Cost measure is Chinese Yuan per square meter.
34
Table 4 Estimate costs of 50 percent BEE adoption (excluded Beijing observations)
Cost of 50 percent BEE adoption
Province Model (1) Model (2) Model (3) Model (5) Model (6) Model (7)
Tianjin 296 234 438 346 407 801
Gansu 217 234 322 147 142 125
Hebei 238 234 356 294 339 269
Heilongjiang 232 234 356 281 149 179
Henan 189 234 283 128 269 204
Intermargo 202 234 303 237 136 66
Jilin 255 234 399 285 161 191
Liaoning 247 234 381 304 159 319
Ningxia 193 234 283 130 127 146
Qinghai 230 234 340 165 152 133
Shaanxi 261 234 395 185 371 314
Shandong 232 234 356 302 347 405
Shanxi 243 234 356 295 347 237
Xinjiang 243 234 390 161 156 212
35
5 Net Present Value Analysis
After China central government released its 11th Five-year Plan, in which the new
building energy efficiency target was set, new construction building energy efficiency
per-formance improved. Evidence shows new construction buildings energy consumption has
declined significantly. However, at the same time, building construction costs increased. As
discussed in section 4, the construction cost increase 9.2 percent from the 1980-81 baseline
when implementing the 50 percent energy saving BEE standard and increased 19.4 percent
from the same baseline when implementing the 65 percent energy saving BEE standard.
Therefore, BEE standard improvement can further reduce energy consumption and the
car-bon emissions, but this needs more investment. The net present value analysis balances the
benefits of future reduced energy costs and carbon emissions against current increases in
building costs. If the net present value is greater than zero, the investment is worthwhile; if it
is less than zero the additional building costs exceed the present value of future benefits. The
net present value is calculated as follows:
30 30
1 1
(1 ) k (1 ) k
i i i i
k k
NPV UFC BE BC
,
(5.1)
where NPVi is the net present value of the investment on applying BEE standard i; UFCi is
the upfront cost of BEE standard i or the incremental building construction cost related to the
BEE standard improvement; BEi is the benefit of energy saving related to the BEE standard
enhancement; and BCi is the benefit of the carbon emission abatement related to the BEE
36
the 50 percent and 65 percent BEE standards, the province-level costs of which were
esti-mated in section 4. The time horizon is assumed to be 30 years, which equals the average
building life time in China.
There is no subscript t for time on BEi and BCi because I assume these are expected
to remain constant over the 30 year horizon. In reality energy prices or carbon abatement
values may increase or decrease over time. The values, however, are highly uncertain and
difficult to forecast. For example, prices for coal, which serves as the primary source of
heating energy in China, follow a near random walk without drift (Berck and Roberts, 1996).
The social value of carbon abatement also remains highly uncertain even today and how this
will evolve over time is unclear.
Instead of assuming these values will follow particular trends, I instead consider a
range of discount rates. Using a high discount rate and constant energy savings and carbon
abatement values in the NPV calculation is equivalent to using a moderate discount rate and
assuming energy prices and carbon abatement values will decline. Conversely, using a low
discount rate and constant benefit flows is equivalent to using a moderate discount rate and
assuming these benefits will rise over time. The discount rate assumptions are discussed
37
5.1 Upfront cost associated with BEE improvement
BEE standards set energy efficiency targets and often require the installation and use
of specific types of equipment. Therefore, this cost refers to the upfront cost incremental cost
related to building energy performance enhancement in relevant BEE compliance scenarios.
UFC=Initial cost without BEE standard – Initial cost with BEE standard
(5.2) In this calculation, UFC is the estimate from panel data regression. Estimation of
up-front cost is based on the province-level data from China fixed asset investment year book
(2001-2008) and modified by model 1 in section 4. The results show that the average upfront
cost is 9.2 percent of the total building construction cost for 50 percent energy saving BEE
and 19.4 percent of the total building construction cost for 65 percent energy saving BEE.
Additional costs related to BEE improvement relative costs described above are accounted
for on the per unit floor area basis.
5.2 Benefit of energy saving
The main reason to introduce BEE standards is to reduce the energy consumption of
building sector. Currently, Chinese residential building sector consumes approximately 20
percent of the country’s final energy. Local BEE standards that set the targets that reduce the
energy consumption in heating, cooling and lighting by 50 percent or 65 percent is based on
the building energy consumption performance of 1980 level.
( )
i e heating cooling lighting
BE C
E E E38
where BEi is benefit of energy saving relative to BEE standard i; Cestands for the cost of energy producing; and ∆∑(Eheating+Ecooling+Elighting) represents the energy saving in heating, cooling and lighting.
In China, heating is delivered primarily by central or district heating plants fuelled
predominantly by coal. Space heating and water heating together are account for nearly 60
percent of energy consumption in residential buildings in north China. In 1986, China’s
cen-tral government issued its first BEE standard, “Energy Design Code for Heated Residential Buildings” (JGJ 26-86). In JGJ26-86, China central government set the quota of each
prov-ince’s coal needed per square meter for heating and set these number as the baseline energy
consumption performance. However, as I discussed in the section 2, China’s central heating
supply systems are one-pipe heating system that cannot be controlled by individual
apart-ments or buildings. For this reason and lag in technology overheating is prevalent. According
to the China building energy efficiency annual report (2009), the actual coal consumption for
heating is 25% more than required.
As I discussed in the section 2, cooling is not provided centrally in Northern China.
During the summer months, when average temperatures are between 25 and 30 °C, air
condi-tioners are increasingly being used. Electricity costs for cooling with air condicondi-tioners are paid
directly by the households according to the consumption. Nevertheless, because of the
cli-mate, air condition is used much less in Northern China as compared to Southern China.
Some provinces, such as Gansu, Qinghai air conditioners are seldom used for cooling.
improve-39
ment in residential building sectors. Estimations of the energy consumption for cooling and
lighting are based on China building energy efficiency report (2008).
In the NPV calculation, the costs of energy producing include the cost of heating and
electricity production. In China, the price of coal for heating is determined by the market,
however, the price of electricity is controlled by the government. Therefore, the market price
does not necessarily reflect the real social cost of consuming the natural resources,
particular-ly in cases where energy use is heaviparticular-ly subsidized by the government. Although, it is often
difficult to value this social cost in practice, we use the market price as a proxy of resource
consumption cost. It is foreseeable that domestic energy price in China and international
benchmark prices will be converging in the long run. According to the state electricity
regu-latory commission of China, in 2008, the average cost of electricity transformation from coal
40
5.3 Benefit of carbon emission abatement
Before the United Nations Climate Change Conference Copenhagen, China
an-nounced that by 2020 it would reduce its carbon emissions intensity by 40 to 45 percent
compared with 2005. China claimed that this target would be "a binding goal" incorporated
into China's medium and long-term national social and economic development plans (Chi-na’s state council, 2009). Enforcement and implementation of BEE standard can significantly
contribute to carbon emissions reduction in buildings. Improved BEE can lead to significant
reduction in electricity consumption of space heating and cooling. I approximate the flow of
carbon benefits by:
BCi = Pc∙ Carbon emission abatement, (5.4)
where BCi is benefit of carbon emission abatement relative to the BEE standard i; Pc is the price of carbon emission. I assume the carbon price is fixed over time.
A range of the carbon emission price from 0 to 250 USD per ton is analyzed. The
ex-change rate of US$/CHY is 6.82 in 2008. The carbon emission abatement can be deduced
from coal consumption. According to National Development and Reform Commission, it can
41
5.4 Discount rate
The discount rate converts future values of benefits into current values so that they
may be balanced with up-front costs of building construction. I consider a range of discount
rates, in part because the socially correct rate of discount is uncertain, and in part because the
trend in benefits is uncertain, as described above. A third factor affecting the discount rate is
the risk premium that should be applied to uncertainty about the flow of benefits. In the
Capi-tal Asset Pricing Model (CAPM) or any of its modern variants, the risk premium associated
with any investment is determined by the covariance of expected returns with the aggregate
economy. In this case, the flow of energy-saving benefits is tied to the price of coal: the
higher are energy prices, the greater the flow of energy savings benefits. Thus, the risk
pre-mium depends on the covariance of uncertain coal prices with uncertain growth in the
nese economy. If unexpectedly high coal prices cause unexpectedly slow growth in the
Chi-nese economy, then the risk premium would be negative. That is, investments in energy
con-servation would provide some insurance against the possibility of high future coal prices.
This would reduce the discount rate below low-risk interest rates. Alternatively, if
unexpec-tedly high oil prices are expected to follow from unexpecunexpec-tedly high growth, then the risk
premium and appropriate discount rate would be higher.
Because expected trends and fluctuations in coal prices are critical for the appropriate
42
China’s central government reformed the coal market and price system in 1993,
be-fore which the price of coal was controlled by the government. This reform made coal prices
subject to market forces of global demand and supply. Coal prices decreased after 1997 and
reached a low point in 1999, after which time coal prices began to increase. Demand for
energy increased sharply because of the rapid economic growth after 2001. Since coal
ac-counts for the largest share of China’s energy, this growth comprised a significant share of
global growth in coal demand. Coal prices kept rising after 2004 and reached their highest
point in 2008, the year when China was hit by a big storm and commodity prices spiked
worldwide. Figure 6 show the trend of coal price (Resource: China Coal Resource, BP
com-pany).
43
The increasing trend of China’s coal prices can be explained by a number of factors.
First, price system reform made coal prices subject to market forces of demand and supply
relationships instead of government control. Secondly, China’s rapid growth increased the
demand for energy; however the ability of coal supply to respond to demand was
underdeve-loped. Furthermore, the nature of China’s heating centralized heating system in which
pay-ments for heating energy are tied to living area rather than energy consumption makes
de-mand inelastic. Third, China’s coal reserve is mainly located in the western and northern
areas, while the biggest demand for coal comes from the eastern and southern parts of China,
which makes the coal transport expensive. Fourth, in recent years, China’s government began
to impose some environmental, resource and security fees on coal industry, which increased
the cost of coal production. Fifth, China became a net importer of coal in 2009. That means
the international coal price began to affect China’s coal price.
While prices have been trending up, it is difficult to tell whether that trend will
con-tinue. But even a modestly increasing trend in prices would justify a very low discount rate.
The covariance between energy prices and economic growth is equally difficult to discern.
In past decades there has been documented evidence that positive spikes in energy prices
have lead to recessions or reduced economic growth, which would indicate a lower discount
rate. In this study, I pick 1 percent as the relative low discount rate. More recently, however,
it appears price fluctuations have been demand related, would suggest a higher discount rate
(Kilian, 2009). If the increasing of coal price is caused by unexpectedly high growth in China,
44
high discount rate. I also calculate the NPV under the discount rate equals 5 percent as the
45
5.5 Results
Improving BEE standard allows for significant reductions both in primary energy
consumption and associated carbon emissions. Implementation of the 50 percent energy
sav-ing BEE standard in new construction buildsav-ings increase the construction cost and
implemen-tation of 65 percent energy saving BEE standard save more energy; however, on the other
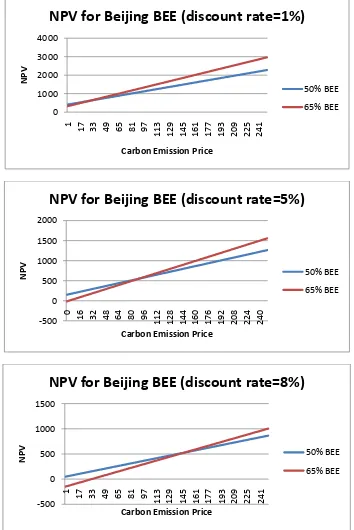
hand, the stricter standard costs more. Take Beijing as an example. Figure 7 reports the Net
Present Value of investment on BEE improvements for Beijing.
For Beijing, assuming the discount rate equals to 1 percent, the net present value of
implementing the 50 percent energy saving BEE standard is 407.77 yuan per square meter
when the carbon emission price is zero. Because the NPV is positive, the investment on 50
percent energy saving BEE standard is acceptable. The NPV increase when carbon emission
price goes higher, which indicates the benefit of investment on BEE improvement has a
posi-tive linear relationship with the carbon emission price. On the other hand, the NPV of
in-vestment on 65 percent energy saving is 319.99 yuan at zero point, which is lower than 50
percent BEE. Therefore, the 50 percent BEE standard will be more beneficial when the value
carbon emission reductions are zero. The NPV of 65 percent BEE is more sensitive to the
carbon emission price; that is, it increases more sharply than that of 50 percent BEE when the
carbon emission price goes higher. NPV of 50 percent BEE and 65 percent BEE equal at the
point when carbon emission price is 28 USD per ton. For carbon prices above $28 per ton,
stan-46
dard. This suggests that if the carbon emission price is higher than 28 USD per ton, invest on
47
Figure 7 Net present value of investment on BEE improvement for Beijing 0
1000 2000 3000 4000
1 17 33 49 65 81 97
113 129 145 161 177 193 209 225 241
N
PV
Carbon Emission Price
NPV for Beijing BEE (discount rate=1%)
50% BEE 65% BEE -500 0 500 1000 1500 2000
0 16 32 48 64 80 96
112 128 144 160 176 192 208 224 240
N
PV
Carbon Emission Price
NPV for Beijing BEE (discount rate=5%)
50% BEE 65% BEE -500 0 500 1000 1500
1 17 33 49 65 81 97
113 129 145 161 177 193 209 225 241
N
PV
Carbon Emission Price
NPV for Beijing BEE (discount rate=8%)
48
The NPV is lower when discount rate is 5 percent compared with 1 percent at the
same carbon emission price. Assuming the discount rate equals to 5 percent, NPV of
in-vestment on 50 percent BEE standard is 149.81 when carbon emission is free to emit. It is
still positive and the NPV goes higher with the increase of carbon emission price, which
in-dicates the investment on 50 percent energy saving BEE is acceptable. However, on the other
hand, NPV of investment on 65 percent BEE standard is -17.07 when the discount rate is 5
percent at the point of carbon emission price is zero. NPV of 65 percent BEE will be negative
at the zero point until the carbon emission price exceeds 5 USD per ton, which suggests the
investment on 65 percent energy saving BEE costs more than its gains when carbon emission
price is less than 5 USD per ton. NPV of 50 percent BEE and NPV of 65 percent BEE will be
equal when carbon emission price is 90 USD per ton. It means if the carbon emission
ex-ceeds 90 USD per ton 65 percent energy saving BEE standard is the better investment
com-pare with 50 percent energy saving BEE standard.
The NPV results related to the high discount rate which equals to 8 percent in this
study showed in the third figure. The NPV of investment on 50 percent energy saving BEE
standard and 65 percent energy saving BEE standard are 48.09 yuan and -149.97 yuan
re-spectively when carbon emission price is zero. The NPV of 50 percent BEE and 65 percent
BEE will be equal at the point where carbon emission price is 147 USD per ton.
Results for rest of the provinces are reported in the appendix. From our NPV
49
1. All of these 15 provinces have positive NPV for investment on 50 percent
energy saving BEE standard when carbon emission is free under certain discount rate
(1%, 5%, 8%). It implies investment on 50 energy saving BEE standard is acceptable
for provinces in North China.
2. However, 50% energy saving is not always the best option for all province
when carbon emission is free. At low discount rate scenario (1%), provinces, such as
Jilin, Liaoning and Gansu, investment on 65 percent BEE standard have a higher
NPV at the zero point. That indicates the optimal BEE option varies across provinces
under same discount rate and carbon emission price.
3. NPV of investment on BEE has a positive relationship with the price of
car-bon emission and the growth rate for 65 percent BEE energy saving standard is higher
than 50 percent energy saving standard. It suggests when carbon emission price
ex-ceeds certain number the optimal BEE standard will change from 50 percent energy