ABSTRACT
ZHU, DI. A New Design-Structure-Matrix Development Framework. (Under the direction of Lawrence M. Silverberg and Ewan G. D. Pritchard).
A New Design-Structure-Matrix Development Framework
by Di Zhu
A dissertation submitted to the Graduate Faculty of North Carolina State University
in partial fulfillment of the requirements for the degree of
Doctor of Philosophy
Mechanical Engineering
Raleigh, North Carolina
2017
APPROVED BY:
_______________________________ _______________________________ Lawrence M. Silverberg Ewan G. D. Pritchard Committee Co-Chair Committee Co-Chair
DEDICATION
BIOGRAPHY
ACKNOWLEDGMENTS
TABLE OF CONTENTS
LIST OF TABLES ... vi
LIST OF FIGURES ... vii
CHAPTER 1 Introduction ... 1
CHAPTER 2 Method ... 9
2.1 Complex System Development and Systems-of-Systems Development ... 9
2.2 Information Flow ... 11
2.3 Development Elements ... 12
2.4 Proposed Framework ... 16
CHAPTER 3 Results... 29
3.1 Case Study of Complex Systems ... 29
3.2 Case Study of Systems-of-Systems ... 34
CHAPTER 4 Conclusion ... 45
REFERENCES ... 47
APPENDICES ... 52
Appendix A ... 53
Appendix B ... 56
LIST OF TABLES
Table 1 Requirements ... 32
LIST OF FIGURES
Figure 1. Information flow in system development ... 13
Figure 2. Relationships between Development. Elements ... 16
Figure 3. Physical system and component DSM assembly ... 19
Figure 4. DSM for complex systems at development stage level ... 20
Figure 5. An extension from the qualitative framework to thequantitative framework ... 25
Figure 6. Series plug-in hybrid electric vehicle ... 30
Figure 7. Power output comparison... 34
Figure 8. Three-Node Smart Micro-Grid ... 35
Figure 9. Simulation parameter settings ... 40
Figure 10. Normalized sums of information in case 1 and case 4 ... 41
Figure 11. Numbers of weeks with the set of smaller information targets in all five cases ... 42
Figure 12. Sums of information over five development cycles... 43
CHAPTER 1
INTRODUCTION
shared between the model builders from different domains, different perspectives and understanding from the model builders create information gaps. Information gaps exist not only between the model builders but also among other engineers who are involved in system development. Since they do not have the same level of understanding about the system, its sub-systems, and its component, information gaps are continually being generated throughout the entire system development process. Interestingly, information gaps are rarely studied as part of the system development by researchers. Some researchers have studied system development with a strong emphasis on modeling (Sirin, Paredis, Yannou, Coatanea & Landel, 2015; Agarwal, Hamza-Lup & Khoshgoftaar, 2012); however, these studies only represent plant model development. How plant model development supports the rest of system development has not been discussed. Dagdougui, Minciardi, Ouammi, Robba & Sacile (2010) proposed a dynamic system model for a hybrid power system, which will be controlled by optimal control strategies in the future. Nevertheless, this study does not explicitly demonstrate how plant model development will benefit future control development. In the dissertation, the bridges between information gaps are represented by information flow. Information flow is further extended to information loops including feedforward and feedback. An information loop is a loop of information between at least two development phases, stages, or activities. Information loops are the key to close information gaps.
extremely challenging. Failures to anticipate such impacts can cause significant delays and cost overruns (Chua & Hossain, 2012). In fact, the system development process is a process of bridging information gaps (Hari & Weiss, 2003). However, the time and successfulness of eliminating information gaps was dictated by the system complexity. As the system complexity increases so does the time to close information gaps. Although building a system model with linking information is difficult (Chua & Hossain, 2012), employing model-based approaches in system development has the potential to close the gaps earlier.
more costly, an ongoing research direction in the software domain is to combine the model-based approach with testing (Takala, Katara & Harty, 2011; Keranen & Raty, 2012). Our study reveals greater potential for the model-based approach in complex system development (CSD) and systems-of-systems development (SoSD) by conducting model-based testing (MBT).
and critical decisions are made while only partial information is available. As the development progresses, information gaps are closing, but the degree of freedom for making choices diminishes (Karniel & Reich, 2013). When dealing with complex, evolutionary, and iterative system development, the model-based approach plays a bigger role on providing additional information flow in early development stages. If information gaps can be closed earlier, there is a better chance to make correct decisions (Sirin, Paredis, Yannou, Coatanea & Landel, 2015). It needs to be pointed out that not only the system but also its development can be modeled. Employing the model-based approach should organically combine the system-level framework with domain-specific development elements such as development phases, stages, and activities.
in the row. An off-diagonal mark signifies the information flow or dependency. The DSM differs from other models in that it focuses on representing information flow or dependency. In fact, information flow and dependency should be considered as two interrelated, but distinct aspects of DSMs.
However, neither the rework probability nor risk index can represent information flow. Although dependency may be exchangeable with significance of information, it fails to represent the amount of information flow. For example, development element A is a benchmarking activity, while development element B is a design activity which heavily depends on the outcomes of activity A. It is obvious that both the dependency and the significance of information should be high. To be able to understand the state-of-art in this field, benchmarking only one product from a leading company is certainly not enough. Of course, the quality of the benchmarking outcome is important. However, the number of products being benchmarked also matters. In fact, dependency and information flow are not exchangeable in this case. Unlike many other models that only consider dependency (Smith & Eppinger, 1997a, 1997b; Browing & Eppinger 2002; Lévárdy & Browning, 2009; Browning, 2016), the proposed framework takes into account both the significance and the amount of information. One of the major contributions in this dissertation is the development of a framework that accounts for information flow both qualitatively and quantitatively.
number of information connections while the small DSMs mentioned above usually do not have. Using the elemental DSMs the framework becomes fundamental, flexible, and scalable, which, in turn, makes it broadly applicable to complex systems and SoS. In addition, the order of development elements in the framework, inspired by the Vee model, also follows the top-down identification-design, bottom-up design-testing concept which is not used in (Smith & Eppinger, 1997a, 1997b; Browing & Eppinger 2002; Lévárdy & Browning, 2009; Browning, 2016). The top-down approach serves to ensure that customer requirements are reflected in system definitions and in the solution offered in response to the specification, that each hierarchy in the system matches the one above, that the interface between systems/components is properly planned, and that the integration of all sub-systems/components yields the result expected of the system (Hari & Weiss, 2003). The bottom-up approach ensures that each level in the hierarchy provides to the hierarchy above good sub-systems or components which meet their specification requirements (Hari & Weiss, 2003).
CHAPTER 2
METHOD
2.1 Complex System Development and Systems-of-Systems Development
As mentioned in the introduction section, CSD and SoSD are different from classic system development. Since both CSD and SoSD are incremental innovation, it is critical to understand and verify the existing system. It is also important to validate both the new sub-systems/components and the new system. However, verification and validation is challenging in CSD and SoSD because they are complex, evolutionary, and iterative. The development complexity is the degree to which a system or component has a design or implementation that is difficult to understand and verify (Jain, Chandrasekaran, Elias & Cloutier, 2008). Testing plays an important role in closing information gaps. Without having testing activities, it is difficult to know whether the system meets customer expectations. It is also essential to understand the performance of each component before and after integrating it into the system. Furthermore, if the system does not meet some of the expectations, testing activities can provide feedback to refine the system.
require additional time and money to be understood and implemented into the system. There is no argument that as the expense and time consuming nature of physical experiments increase, it is more desirable to employ model-based design (MBD) techniques (Kernstine, 2013). MBD enables a new dimension by opening a door into the virtual world. MBD provides a unique capability to investigate alternative sets of inputs that are impractical to independently compare in a physical world (Kernstine, 2013). When used in early development stages, MBD helps with requirement capture and design validation and verification purposes (Kalawsky et al., 2013; Wang, Valerdi & Fortune, 2010). A driving force on the cost side is to assure that the formal requirements represent the correct understanding of what the system should and should not do (Alves, Drusinsky, Michael & Shing, 2013). MBD also allows its users to predict the performance of a product without completing the product (Kalawsky et al., 2013). Furthermore, it helps its users to save time and money during the development. However, it does increase the complexity of information flow because every physical component/sub-system in the component/sub-system may have a virtual representation. Every virtual representation and its development must interact with its corresponding physical component/sub-system via information flow.
to different system architectures or configurations. Finally, the method should be valid when the system is scaled up or down.
2.2 Information Flow
2.3 Development Elements
criteria. Because the SoS development is evolutionary and iterative, I, D, and T are the three essential types of development elements in SoS.
In the dissertation, identification is to identify or define outcomes, design targets, and requirements for design and testing. Design is to select, develop, and implement components, sub-systems, and systems, which meet predefined requirements from identification. Testing is to test and validate design with predefined requirements. Information transmitted between two development elements is information flow. It needs to be clarified that the design includes building or assembling components, sub-systems, and a system. Literature has shown that other researchers have a type of development elements called build or realization (Hari & Weiss, 2003). The build or realization is included in our design because it is more explicit to represent information flow in this way.
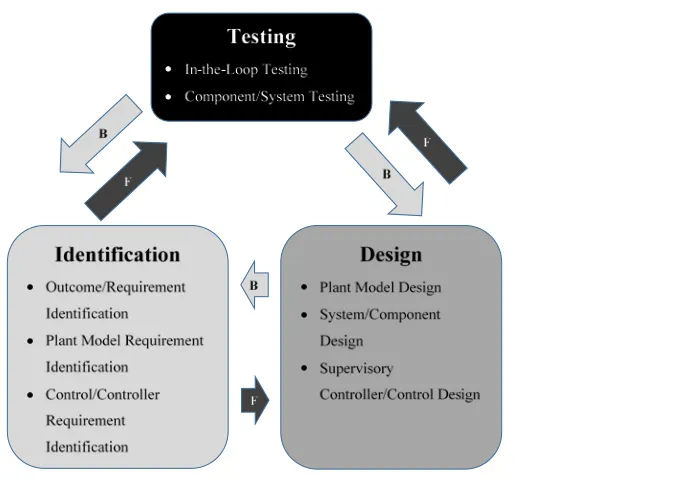
The information flowing between the three types of development elements in the same domain is depicted in Figure 1. Each block in Figure 1 represents one development phase, and each phase may have more than one stage. The arrow with an “F” shows the direction of the feedforward, while the arrow with a “B” indicates the direction of the feedback. To simplify the illustration of information flow utilization, information is assumed to only flow at the development phase level in the same domain. The identification phase generates requirements, which are the life-blood of system development. The first phase of SoS development is driven by collecting, composing, and analyzing system requirements (Jain, Chandrasekaran, Elias & Cloutier, 2008). These requirements are used to guide design. The system, once designed and developed, becomes a testing subject in the testing phase. The requirements are also used to generate pass/fail criteria for the testing phase. Feedforward information includes all of the information from identification to both design and testing and from design to testing. On the other hand, all the information from testing to both design and identification and from design to identification is feedback. Design experience grows organically in the design phase. The experience is used as feedback to refine unrealistic requirements so the system can be developed. The testing result also helps refine both the requirements and the design so the final system will be exactly as it is expected. The final system arrives in the testing phase.
identification, design, and testing to move further iteratively. It needs to be pointed out that this complete connection holds for the three types at any development level. In addition, the elemental DSM is independent of any of the system attributes such as the number of sub-systems, architecture, and configuration. The independency makes the proposed framework fundamental. The six information connections form the foundation of our framework. Figure 1 illustrates the information flow explicitly when different domains are not involved. However, when illustrating information flow between different domains at different development levels, the DSM as a more powerful representation is needed.
coupled development elements. Thus, a new framework is necessary to help analyze information flow between coupled development elements.
2.4 Proposed Framework
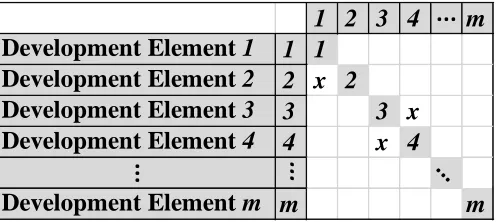
The DSM was selected in the study to carry out the role of representing and analyzing information flow between different domains. It was developed by Steward (1981) to both represent and analyze the information flow among interrelated development activities. It has been recognized as an MBSE method since 1991 (Eppinger, 1991). A DSM is a square matrix with m rows and columns, where m represents the number of development elements (see Figure 2). Each element is assigned a unique label. The diagonal is marked with the label of the element in the row. An off-diagonal mark signifies the information flow or dependency. If development element 2 depends on development element 1, the element 21 in row 2 and column 1 is marked with an x. Otherwise, the element is empty. The DSM differs from other tools in that it focuses on representing information flow (Eppinger, 2001; Campos Silva , Santiago & Silva, 2012). It needs to be mentioned that there are two other well-known design matrices. One is the axiomatic design matrix (Suh, 1998) and the other is the N2 matrix (Bustnay & Ben-Asher, 2005). The axiomatic design matrix focuses on representing relationships between functional requirements and design parameters, while the N2 matrix is Figure 2. Relationships between Development Elements.
1 2 3 4 ··· m
Development Element 1 1 1
Development Element 2 2 x 2
Development Element 3 3 3 x
Development Element 4 4 x 4
··· ··· ···
to obtain a system presentation in a simple flow. Neither of them is appropriate for our study because they were not developed for analyzing information flow.
quantitatively, the framework does require additional information about the system development.
In addition to physical system/component development, CSD and SoSD have plant model development where virtual components and a system are designed. Furthermore, CSD and SoSD have both physical and virtual control development. The complete DSM for CSD and SoSD is shown in Figure 4. It is observed that the testing stages have more vertical relationships (shown as an “o”). In addition, most of the added vertical relationships are feedback connections. These two observations indicate that CSD may have more feedback resulting from vertical relationships. Also observe that the testing phase including stage k, l, m, and n may generate more feedback than the other two phases. The additional feedback creates new information loops, which means that design corrections can be made earlier. Kalawsky et al. (2013) states that information captured in component models are also related in system models that can relate this information back to system requirements, helping to support system validation. Thus, information gaps between different domains can be bridged before closing them becomes too costly.
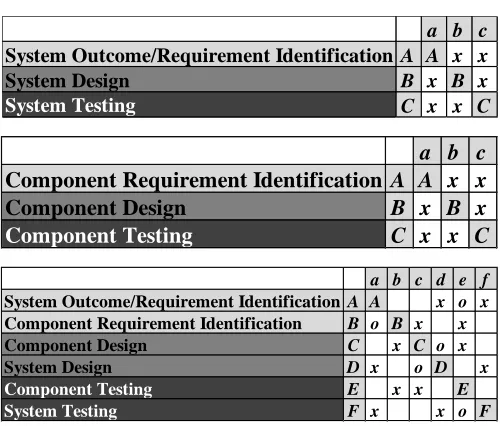
Figure 3. Physical system and component DSM assembly.
a b c
System Outcome/Requirement Identification A A x x
System Design B x B x
System Testing C x x C
a b c
Component Requirement Identification A A x x
Component Design B x B x
Component Testing C x x C
a b c d e f
System Outcome/Requirement Identification A A x o x
Component Requirement Identification B o B x x
Component Design C x C o x
System Design D x o D x
Component Testing E x x E
2.4.2 Quantitative Framework. The proposed quantitative framework extends the capability of the qualitative framework. Besides being used to bridge information gaps and identify design flaws in early development stages, it can also be used to estimate the duration of development elements and the effect of design changes. The proposed framework works to close information gaps by treating system development as a process which generates information. This framework essentially tracks information and gaps, along with their priority. Once all the necessary information gaps are closed, the system development is complete. The system development usually requires several cycles to be complete, typically less than 5. The number of cycles is larger in projects that require more aggressive technology advancement or higher tech (Shenhar & Bonen, 1997). Similar to the simulation of a discrete-event model, the first development cycle begins with a single development element and ends once each of the development elements of the DSM has been executed. After each has been executed, new
Figure 4. DSM for complex systems at development stage level.
a b c d e f g h i j k l m n
System Outcome/Requirement Identification A A o x o o o o x
Component Requirement Identification B o B x o o o x o
Component Model Requirement Identification C o C x x o o
System Model Requirement Identification D o D x o x o
Component Model Design E x E o x
System Model Design F x o F x
Component Design G x G o x
System Design H x o H x
Controller/Control Requirement Identification I o I x x x
Supervisory Controller/Control Design J x J x x
Component Model In-the-Loop Testing K x x K
System Model In-the-Loop Testing L x x x x o L
Component Testing M x x M
Since the proposed model is a system-level framework that simulates an iterative process, every development element (rows in the DSM) in a development model may take more than one iteration. It is important to clarify the different definitions for development cycles and development iterations in the dissertation before going into details about the framework. The development cycle starts when any development element starts; it ends when all of the development elements are complete. The development iteration starts counting when new information flows into a specific development element; it stops counting when the development element is complete. When executed, the framework runs cycle by cycle. However, an iteration for a particular development element may not start until new information flows into the development element; it may end before the entire development is complete.
The framework is an m-by-m matrix, where m is the number of development elements. The amount of information in the ith development cycle for the elements from 1 to m is
collected into the information vector:
𝐝𝐝(𝑖𝑖) = � d1(𝑖𝑖)
d2(𝑖𝑖)
⋮ d𝑚𝑚(𝑖𝑖)
�
The new information can be used for its dependent development elements. However, some development elements may be significantly affected by the new information, while the others may not. The significance of information dictates how significant a development element is affected by the information generated in its dependent development element(s). The significance of information flowing from one development element to another are collected into the significance matrix:
𝐒𝐒 = � 0⋮ ⋯ S⋱ 1,𝑛𝑛⋮ S𝑚𝑚,1 ⋯ 0
�
where the diagonal terms (S1,1, S2,2, … , S𝑚𝑚,𝑛𝑛) are set to be zeros and the non-diagonal terms
represent the significance of information between development elements. Similar to the method of determining the rework probability (Smith & Eppinger, 1997a, 1997b; Browning & Eppinger, 2002), the value of significance of information can be determined through conducting surveys with experts. In this dissertation, the values for the significance of information range from 5 to 1. The most significant information is rated at 5. New information is generated from two sources. It can come from internal sources such as other development elements. It can also be produced from external sources. To calculate the amount of new information generated in the ith development cycle, the following equation is proposed:
𝐝𝐝(𝑖𝑖) = 𝐒𝐒×𝐝𝐝(𝑖𝑖 − 1) + 𝐞𝐞(𝑖𝑖) (1)
where 𝐒𝐒×𝐝𝐝(𝑖𝑖 − 1) represents information generated internally in the (i-1)th development cycle and the external information vector, 𝐞𝐞(𝑖𝑖), represents information from external sources in the
ith development cycle. The value of external information for a development element is dictated
is enough to completely bridge the gap of the development element, it should equal to the information target. For example, if a company realizes that it can purchase all the required sub-systems in the 3rd development cycle, the information from external sources for development element 7 (sub-system design), e7(3), is set equal to the information target of development element 7, sf7. The information vector before the 1st development cycle, 𝐝𝐝(0), is set to be the zero vector because no new information has been generated yet. It is noted that when a development element is complete, there is no information being generated from the development element in the next development cycle and the iteration counting of the development element stops. This is because the development element has already closed its information gap and there is no need to execute it again. For example, if development element
m closes its information target in the (i-1)th development cycle, d𝑚𝑚(𝑖𝑖) is set to zero. It also needs to be pointed out that the vector, 𝐞𝐞(𝑖𝑖), plays an important role in the framework for two reasons. First, the information from external sources, such as clients’ expectations, drives the system development. If the clients’ expectations are not available, any system development is meaningless. Second, the information continuously flowing into the system development from external sources is very common while the system development is undertaken. The flow of information may cause design changes. As mentioned in the previous section, the design change is one of the two major causes resulting in information gaps; the proposed framework is to bridge information gaps. Thus, having information from external sources in the formula reflects the actual system development. Having new information per development cycle is the first step. The next step is to calculate the sum of information from the beginning until the ith
𝐬𝐬(𝑖𝑖) = � 𝐝𝐝(𝑗𝑗)
𝑖𝑖−1
𝑗𝑗=0
(2)
where 𝐬𝐬(𝑖𝑖) is the sum of information for all the m development elements from the beginning until the ith development cycle. If and when an element s(𝑖𝑖) is greater than the information target of that element, the sum of information of that element is set to be equal to the information target. For example, if s3(i) ≥ sf3, s3(i) is set to be sf3.
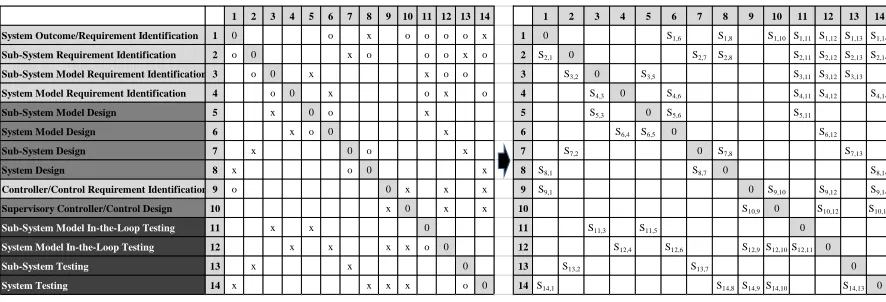
As mentioned before, the qualitative framework focuses the relationships between development elements while the quantitative framework focuses on how significant the flow of information is. Both the qualitative framework and the quantitative framework are shown in Figure 5. The qualitative framework distinguishes the horizontal and the vertical relationships. The x’s and o’s represent horizontal relationships and vertical relationships in the qualitative framework, respectively. In the quantitative framework, Sm,n (m,n from 1 to 14)
represents significance of information between two development elements. For example, S14,1
represents the significance of information flowing from development element 1 to
Figure 5. An extension from the qualitative framework (left) to the quantitative framework
(right).
1 2 3 4 5 6 7 8 9 10 11 12 13 14 1 2 3 4 5 6 7 8 9 10 11 12 13 14 System Outcome/Requirement Identification 1 0 o x o o o o x 1 0 S1,6 S1,8 S1,10 S1,11 S1,12 S1,13 S1,14
Sub-System Requirement Identification 2 o 0 x o o o x o 2 S2,1 0 S2,7 S2,8 S2,11 S2,12 S2,13 S2,14
Sub-System Model Requirement Identification 3 o 0 x x o o 3 S3,2 0 S3,5 S3,11 S3,12 S3,13
System Model Requirement Identification 4 o 0 x o x o 4 S4,3 0 S4,6 S4,11 S4,12 S4,14
Sub-System Model Design 5 x 0 o x 5 S5,3 0 S5,6 S5,11
System Model Design 6 x o 0 x 6 S6,4 S6,5 0 S6,12
Sub-System Design 7 x 0 o x 7 S7,2 0 S7,8 S7,13
System Design 8 x o 0 x 8 S8,1 S8,7 0 S8,14
Controller/Control Requirement Identification 9 o 0 x x x 9 S9,1 0 S9,10 S9,12 S9,14
Supervisory Controller/Control Design 10 x 0 x x 10 S10,9 0 S10,12 S10,14
Sub-System Model In-the-Loop Testing 11 x x 0 11 S11,3 S11,5 0
System Model In-the-Loop Testing 12 x x x x o 0 12 S12,4 S12,6 S12,9S12,10S12,11 0
Sub-System Testing 13 x x 0 13 S13,2 S13,7 0
development 14. The quantitative framework also has the physical system/sub-system development, the virtual system/sub-system development, and the controls development. The order of the development elements follows the top-down identification-design, bottom-up design-testing concept. It is observed that most of the development elements are coupled in Figure 5.
𝐚𝐚(i) = � a1
a2
⋮ a𝑚𝑚
�
where a1, a2, … , a𝑚𝑚 represent the number of iterations for the 1st, 2nd,…, mth development elements, respectively. The second step is to calculate the duration of all the development elements. We denote the vector for the duration of all the development elements in the framework by:
𝐭𝐭 = � t1
t2
⋮ t𝑚𝑚
�
where each element represents the duration of a development element per iteration. The duration of a development element can be in any time scale such as hours, days, weeks, and years. The final step is to calculate the duration of each development element and the total duration of the development elements. The duration of each development element is a product of the number of iterations and the duration of the development element per iteration. The total duration of all the development elements until the ith development cycle is the sum of the duration for all the development elements:
𝑡𝑡f= 𝐚𝐚(𝑖𝑖)T𝐭𝐭 (3)
CHAPTER 3
RESULTS
3.1 Case Study of Complex Systems
The DSM of complex systems described above has allowed our research to look at feedback and its utilization from a different angle. A powertrain design and validation for a series plug-in hybrid electric vehicle to meet its acceleration requirement was conducted as a case study. The powertrain development was selected because it involves interactions between different domains. In addition, the success of the powertrain development depends on when and how information gaps are bridged. The aim of the case study is to demonstrate that the proposed MBT framework bridges the information gaps earlier than other frameworks that do not employ MBT.
engine and the generator is called the range extender. An 18.9 kWh lithium ion nanophosphate battery pack allows the vehicle to drive approximately 50 miles in an all-electric mode. A HV junction box couples the battery to the generator and the traction motor and is also connected a 3.3 kW BRUSA on-board charger. The complete EcoCAR has a test mass at 1979 kg. Other vehicle dynamic properties are the same as the stock 2013 Malibu.
A system model was developed along with vehicle development to help refine the system design and decouple distributed system control development from physical system development. The system model has a component model for each physical component. Since the focus of the case study is powertrain design to meet the acceleration requirement, only the relevant models such as the glider model, the traction motor model, and the battery model are described in the Appendix A.
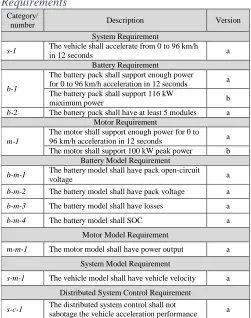
To succinctly examine the hypothesis, one of the system requirements was selected to show how the powertrain was designed to support system performance (see Table 1). Given Figure 6. Series plug-in hybrid electric vehicle.
Battery Pack
Legend
Series Plug-In Hybrid Electric
the hybrid system architecture and the system requirement, the HV battery pack and the motor are the two powertrain components that have a major impact on the acceleration performance. The battery pack was designed from battery modules. Each module has a specified maximum output of 25 kW. The design question is: how many modules are needed per pack to support the power demand to meet the 0 to 96 km/h acceleration requirement? To answer this question accurately, it is essential to know the maximum power required by the vehicle, which is the maximum power output of the motor. According to Figure 5, if the MBT was not employed, the earliest feedback from the system testing stage requires the completeness of the system. The information gap is the power desired to meet the system requirement from both the motor and the battery pack. To be able to size the battery pack and the motor in terms of power before integrating both the pack and the motor into the vehicle, employing MBT is necessary. In addition, the information loop that consists of the feedback from MBT can bridge the information gap earlier.
the system model requirements were created to support the component requirements and the system requirement, respectively. The purpose of having modeling activities was to create reasonable results as feedback to help improve the CSD. Since the system controller is responsible for guaranteeing efficient and safe operation of the system, the distributed system control requirement was created to prevent the vehicle acceleration from being interrupted by the operation of any other components in the vehicle.
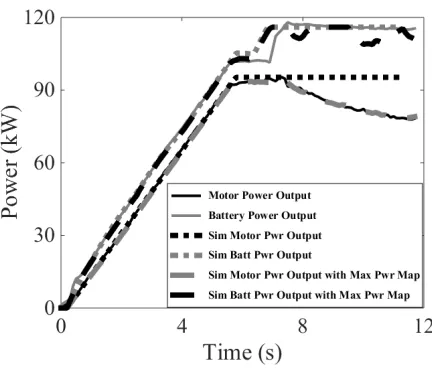
Three sets of battery and the motor power outputs are shown in Figure 7. The dark and light solid curves are the actual motor and battery power outputs from the same acceleration
Table 1
Requirements
Category/
number Description Version
System Requirement
s-1 The vehicle shall accelerate from 0 to 96 km/h
in 12 seconds a
Battery Requirement
b-1
The battery pack shall support enough power
for 0 to 96 km/h acceleration in 12 seconds a
The battery pack shall support 116 kW
maximum power b
b-2 The battery pack shall have at least 5 modules a
Motor Requirement
m-1
The motor shall support enough power for 0 to
96 km/h acceleration in 12 seconds a
The motor shall support 100 kW peak power b
Battery Model Requirement
b-m-1 The battery model shall have pack open-circuit
voltage a
b-m-2 The battery model shall have pack voltage a
b-m-3 The battery model shall have losses a
b-m-4 The battery model shall SOC a
Motor Model Requirement
m-m-1 The motor model shall have power output a System Model Requirement
s-m-1 The vehicle model shall have vehicle velocity a Distributed System Control Requirement
s-c-1 The distributed system control shall not
3.2 Case Study of Systems-of-Systems
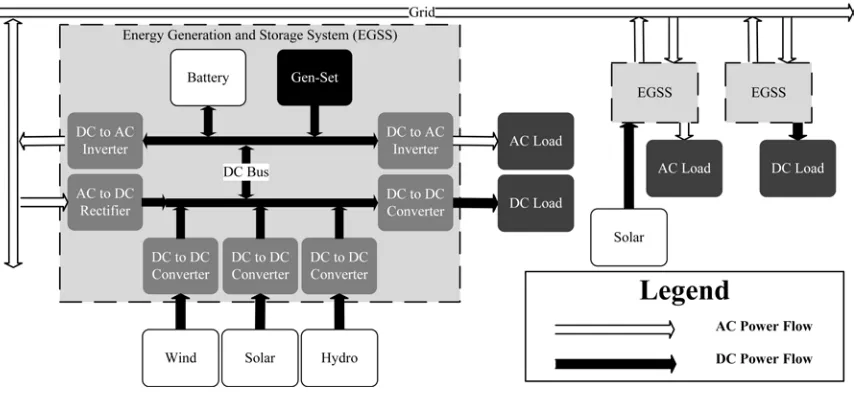
Since the proposed framework was created to deal with evolutionary and iterative system development, a smart micro-grid project was selected as a case study to demonstrate the framework. Besides being evolutionary and iterative, the project was selected also because the development elements in the proposed framework are able to address any development issue and deliver a SoS that meets clients’ expectations. The smart micro-grid project was undertaken by the Future Renewable Electric Energy Delivery and Management (FREEDM) Systems center and Pos-En to develop an intelligent micro-grid which can improve grid stability and power reliability for unstable electric power systems. The micro-grid takes in energy from the grid and renewable resources and supports both the grid and the load. The core of the project was to develop an energy generation and storage system (EGSS) evolved from a series plug-in hybrid electric vehicle (PHEV). Although the energy generation and storage system has a similar system architecture, it differs from the PHEV in both its operation and Figure 7. Power output comparison.
component sizes. Development information including data and experience from the PHEV development was used to accelerate the EGSS development. The EGSS is an evolution of the PHEV. The development of EGSS is also iterative because it took several iterations to finalize the production-ready SoS.
inputs and can only support either AC loads or DC loads. It also needs to be pointed out that any of these sub-systems can support the load independently. In fact, when the SoS is disassembled, each sub-system can and does operate on its own to support the load.
The DSM-based framework aims to bridge the information gaps earlier with Model-Based approaches, estimate development duration, and predict effects of design changes. It also sheds light on addressing under what conditions model-based approaches are necessary. The case study was conducted to demonstrate the following three hypotheses:
1) The proposed framework can bridge information gaps earlier than frameworks that do not employ Model-Based approaches,
2) The proposed framework can estimate development duration,
3) The proposed framework can predict effects of design changes in terms of the sum of information.
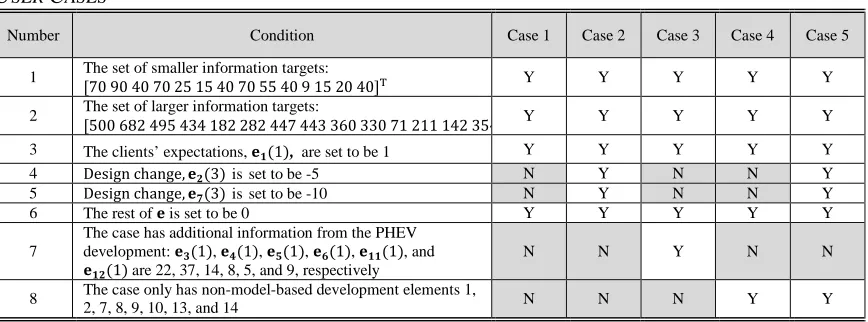
from external sources. In addition, it does not have helpful data from the PHEV development to accelerate the micro-grid development. The second case has design changes from the client. This case demonstrates how the framework predicts effects of design changes. Conditions 4 and 5 are applied to case 2. The third case is the same as the first case except it has helpful data from the Model-Based development elements in the PHEV development. It demonstrates how the data from the previous system development assists the current system development as the development is evolutionary and iterative. Condition 7 is applied to case 3. Comparing with the baseline case, the fourth case does not have any development element regarding Model-Based approaches. This case demonstrates under what conditions model-based approaches are necessary. Condition 8 is applied to case 4. The last case is the same as the fourth case except it has design changes. The last case demonstrates without the help from Model-Based approaches, how the design changes slow down system development. It also demonstrates the system development paradox by showing a failure example. In the example, critical decisions are made when the information gaps are still big. A sub-system needs to be completely changed Table 2
USER CASES
Number Condition Case 1 Case 2 Case 3 Case 4 Case 5
1 The set of smaller information targets:
[70 90 40 70 25 15 40 70 55 40 9 15 20 40]T Y Y Y Y Y
2 The set of larger information targets:
[500 682 495 434 182 282 447 443 360 330 71 211 142 354 Y Y Y Y Y
3 The clients’ expectations, 𝐞𝐞𝟏𝟏(1),are set to be 1 Y Y Y Y Y
4 Design change, 𝐞𝐞𝟐𝟐(3)isset to be -5 N Y N N Y 5 Design change, 𝐞𝐞𝟕𝟕(3)isset to be -10 N Y N N Y
6 The rest of 𝐞𝐞is set to be 0 Y Y Y Y Y
7
The case has additional information from the PHEV development: 𝐞𝐞𝟑𝟑(1), 𝐞𝐞𝟒𝟒(1), 𝐞𝐞𝟓𝟓(1), 𝐞𝐞𝟔𝟔(1), 𝐞𝐞𝟏𝟏𝟏𝟏(1), and
𝐞𝐞𝟏𝟏𝟐𝟐(1) are 22, 37, 14, 8, 5, and 9, respectively
N N Y N N
8 The case only has non-model-based development elements 1,
in the third development cycle, which heavily affects both development element 2 and 7. The system development is not able to adapt to the design changes fast enough. Thus, the duration of development elements is heavily extended. Condition 4, 5, and 8 are applied to case 5. Although the baseline case is case 1, the actual micro-grid development followed case 3 because the framework has predicted that case 3 has the minimum duration of development elements by closing information gaps earlier. In addition, useful information from model-based development elements in the PHEV development was available to help the micro-grid development.
To be able to execute the framework in simulation, values are also needed to be assigned to the framework. Since the EGSS is an evolution of the PHEV and the EGSS development has the same development elements as the PHEV development, the duration of every development element from the PHEV development was used to generate a set of smaller
information targets, 𝐬𝐬f(1), for the micro-grid development. Using the duration of the PHEV
development elements was under the assumption that information had been generated until the development was complete. These values of the duration indicate the information gaps for the
PHEV development. The set of information targets, 𝐬𝐬f(2), was created using the baseline case
to study how the number of cycles affects the hypotheses. 𝐬𝐬f(2) is set to equal 𝐬𝐬(6) to from the
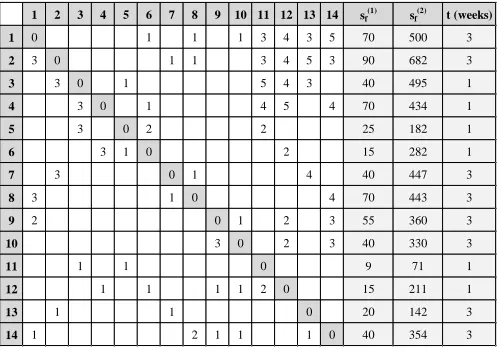
affect the proof of the hypotheses. The significance of information was collected through surveys within the center experts. The values for the significance of information are also shown in Figure 9. The clients’ expectations are represented by 𝐞𝐞𝟏𝟏(1) for all five cases. In addition,
𝐞𝐞𝟐𝟐(3) and 𝐞𝐞𝟕𝟕(3) are set to be -5 and -10, respectively for case 2 and case 5. The values indicate
other four cases only alter parameters and can be solved by following the same procedure in Appendix B, only results from these cases are shown in Results.
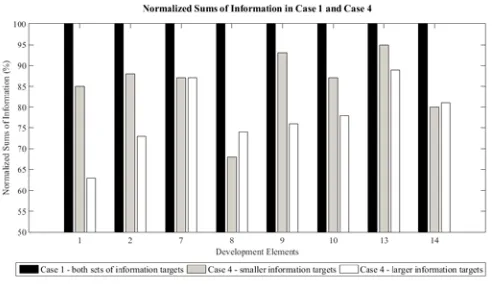
To succinctly examine the first hypothesis, results from case 1 and case 4 were compared in Figure 10. Two sets of information targets were used to generate the results. It is needed to be pointed out that case 4 does not have Model-Based development elements. Thus, the results from the Model-Based development elements in case 1 are excluded in Figure 10. The results from case 1 were normalized to 100% so the results with both sets of information targets from case 4 can be compared with the same reference. It is observed that all the development elements in case 4 generated less information than the development elements in case 1. Lower sums of information indicate that case 4 with either set of information targets requires more time to close the information gaps. It is also observed that as the information targets increase, case 1 has more advantages over case 4 in closing information gaps except for development element 8 and 14. As illustrated in both Figure 4 and Figure 9, development elements 8 and 14 do not rely on information from any of the Model-Based development Figure 9. Simulation parameter settings.
1 2 3 4 5 6 7 8 9 10 11 12 13 14 sf(1) sf(2)
t (weeks)
1 0 1 1 1 3 4 3 5 70 500 3
2 3 0 1 1 3 4 5 3 90 682 3
3 3 0 1 5 4 3 40 495 1
4 3 0 1 4 5 4 70 434 1
5 3 0 2 2 25 182 1
6 3 1 0 2 15 282 1
7 3 0 1 4 40 447 3
8 3 1 0 4 70 443 3
9 2 0 1 2 3 55 360 3
10 3 0 2 3 40 330 3
11 1 1 0 9 71 1
12 1 1 1 1 2 0 15 211 1
13 1 1 0 20 142 3
elements. Therefore, unlike any other development elements, these two development elements with larger information targets in case 4 have higher sums of information than they have with smaller information targets. It is concluded that with employing Model-Based approaches the framework can bridge information gaps earlier. In addition, the more iterative the SoS development is, the more valuable employing model-based approaches is.
development with Model-Based development elements (case 1) took less time than the development without Model-Based development elements (case 4). Case 5 required the most time because it does not have Model-Based development elements while it also has design changes as case 2 does. It is shown that the framework can estimate development duration. The results with the set of larger information gaps are not discussed here because it does not make a difference to the test of the second hypothesis.
cycles, while case 1 has the highest sums of information. Comparing with case 1, the differences in the sum of information for non-model-based development elements in both
case 2 and case 5 are listed in Figure 13. Model-based development elements are not listed and compared because case 5 does not have any. It is observed that as the number of development cycles increases from 5 to 6, the differences in the sums of information also increases. Case 5 has larger gaps in both development cycle 5 and 6 because it does not have any model-based development elements to help close the gaps. It is clear that the framework is capable of capturing effects of design changes in every step of the SoS development.
Figure 13. Comparing with case 1, differences in the sums of information for development
elements 1, 2, 7, 8, 9, 10, 13, and 14 in the development cycles 5 and 6 in case 2 and case 5.
DC 5 Case 2 Case 5 DC 6 Case 2 Case 5 ∆s1(5) 0 -42 ∆s1(6) -55 -318
∆s2(5) -15 -67 ∆s2(6) -115 -482
∆s7(5) -25 -59 ∆s7(6) -125 -325
∆s8(5) -10 -64 ∆s8(6) -25 -321
∆s9(5) 0 -4 ∆s9(6) 0 -178
∆s10(5) 0 -4 ∆s10(6) 0 -102
∆s13(5) -15 -15 ∆s13(6) -40 -136
CHAPTER 4
CONCLUSION
is more iterative. Because the characteristics of the framework are fundamental, flexible, and scalable, the framework is broadly applicable to CSD and SoSD. Given the evolutionary and iterative nature of CSD and SoSD, the framework also has potential in improving information reuse.
REFERENCES
Agarwal, A., Hamza-Lup, G. L., & Khoshgoftaar, T. M. (2012). A System-Level Modeling
Methodology for Performance-Driven Component Selection in Multicore
Architectures. IEEE Systems Journal, 6(2), 317-328.
Alves, M. C. B., Drusinsky, D., Michael, J. B., & Shing, M. T. (2013). End-to-end formal
specification, validation, and verification process: A case study of space flight
software. IEEE Systems Journal, 7(4), 632-641.
Browning, T. R. (2001). Applying the design structure matrix to system decomposition and
integration problems: a review and new directions. IEEE Transactions on Engineering
management, 48(3), 292-306.
Browning, T. R., & Eppinger, S. D. (2002). Modeling impacts of process architecture on cost
and schedule risk in product development. IEEE transactions on engineering
management, 49(4), 428-442.
Bustnay, T., & Ben-Asher, J. Z. (2005). How many systems are there? using the N2 method
for systems partitioning. Systems engineering, 8(2), 109-118.
Boumen, R., De Jong, I. S., Mestrom, J. M. G., Van De Mortel-Fronczak, J. M., & Rooda, J.
E. (2009). Integration and test sequencing for complex systems. IEEE Transactions on
Systems, Man, and Cybernetics-Part A: Systems and Humans, 39(1), 177-187.
Browning, T. R. (2016). Design structure matrix extensions and innovations: a survey and new
Cho, S. H., & Eppinger, S. D. (2005). A simulation-based process model for managing
complex design projects. IEEE Transactions on engineering management, 52(3),
316-328.
Chua, D. K., & Hossain, M. A. (2012). Predicting change propagation and impact on design
schedule due to external changes. IEEE Transactions on Engineering
Management, 59(3), 483-493.
Dagdougui, H., Minciardi, R., Ouammi, A., Robba, M., & Sacile, R. (2010). A dynamic
decision model for the real-time control of hybrid renewable energy production
systems. IEEE Systems Journal, 4(3), 323-333.
Eppinger, S. D. (1991). Model-based approaches to managing concurrent engineering. Journal
of Engineering Design, 2(4), 283-290.
Eppinger, S. D. (2001). Innovation at the Speed of Information. Harvard business
review, 79(1), 149-158.
Estefan, J. A. (2007). Survey of model-based systems engineering (MBSE)
methodologies. Incose MBSE Focus Group, 25(8).
Hilliard, R. (2000). Ieee-std-1471-2000 recommended practice for architectural description of
software-intensive systems. IEEE, http://standards. ieee. org, 12, 16-20.
Hari, A., & Weiss, M. P. (2003). Analysis of Risk and Time to Market During the Conceptual
Design of New Systems. In DS 31: Proceedings of ICED 03, the 14th International
Conference on Engineering Design, Stockholm.
Hari, A., Weiss, M. P., & Zonnenshain, A. (2004). ICDM-an integrated methodology for the
Conference Proceedings; 8-10 November 2004 (p. 35). Systems Engineering Society
of Australia.
Holt, J., Perry, S., Payne, R., Bryans, J., Hallerstede, S., & Hansen, F. O. (2015). A
model-based approach for requirements engineering for systems of systems. IEEE Systems
Journal, 9(1), 252-262.
Jain, R., Chandrasekaran, A., Elias, G., & Cloutier, R. (2008). Exploring the impact of systems
architecture and systems requirements on systems integration complexity. IEEE
Systems Journal, 2(2), 209-223.
Keranen, J. S., & Raty, T. D. (2012). Model-based testing of embedded systems in hardware
in the loop environment. IET Software, 6(4), 364-376.
Karniel, A., & Reich, Y. (2013). Multi-level modelling and simulation of new product
development processes. Journal of Engineering Design, 24(3), 185-210.
Kernstine, K. H. (2013). Inadequacies of Traditional Exploration Methods in
Systems-of-Systems Simulations. IEEE Systems Journal, 7(4), 528-536.
Kalawsky, R. S., O'Brien, J., Chong, S., Wong, C., Jia, H., Pan, H., & Moore, P. R. (2013). Bridging the gaps in a model-based system engineering workflow by encompassing hardware-in-the-loop simulation. IEEE Systems Journal, 7(4), 593-605.
Lévárdy, V., & Browning, T. R. (2009). An adaptive process model to support product
development project management. IEEE Transactions on Engineering
Management, 56(4), 600-620.
Pahl, G., & Beitz, W. (2013). Engineering design: a systematic approach. Springer Science &
Qian, Y., & Lin, J. (2014). Organizing interrelated activities in complex product
development. IEEE Transactions on Engineering Management, 61(2), 298-309.
Ramos, A. L., Ferreira, J. V., & Barceló, J. (2012). Model-based systems engineering: An
emerging approach for modern systems. IEEE Transactions on Systems, Man, and
Cybernetics, Part C (Applications and Reviews), 42(1), 101-111.
Steward, D. V. (1981). The design structure system: A method for managing the design of
complex systems. IEEE transactions on Engineering Management, (3), 71-74.
Shenhar, A. J., & Bonen, Z. (1997). The new taxonomy of systems: Toward an adaptive
systems engineering framework. IEEE Transactions on Systems, Man, and
Cybernetics-Part A: Systems and Humans, 27(2), 137-145.
Smith, R. P., & Eppinger, S. D. (1997). Identifying controlling features of engineering design
iteration. Management Science, 43(3), 276-293.
Smith, R. P., & Eppinger, S. D. (1997). A predictive model of sequential iteration in
engineering design. Management Science, 43(8), 1104-1120.
Suh, N. P. (1998). Axiomatic design theory for systems. Research in engineering
design, 10(4), 189-209.
Silva, D. D. C., Santiago, L. P., & Silva, P. M. S. (2012). Impact of premature information
transfer on cost and development time of projects. IEEE Transactions on Engineering
Management, 59(4), 692-704.
Sirin, G., Paredis, C. J., Yannou, B., Coatanéa, E., & Landel, E. (2015). A model identity card
to support simulation model development process in a collaborative multidisciplinary
Takala, T., Katara, M., & Harty, J. (2011, March). Experiences of system-level model-based
GUI testing of an Android application. In 2011 Fourth IEEE International Conference
on Software Testing, Verification and Validation (pp. 377-386). IEEE.
Wang, G., Valerdi, R., & Fortune, J. (2010). Reuse in systems engineering. IEEE Systems
Journal, 4(3), 376-384.
Weiss, M. P., & Hari, A. (2015). Extension of the Pahl & Beitz systematic method for
conceptual design of a new product. Procedia CIRP, 36, 254-260.
Yassine, A., & Braha, D. (2003). Complex concurrent( engineering and the design structure
matrix method. Concurrent Engineering, 11(3), 165-176.
Zhu, D., Pritchard, E., & Silverberg, L. (2016). A new system development framework driven
by a model-based testing approach bridged by information flow. Manuscript submitted
for publication.
Weicker, P. (2013).A systems approach to Lithium-Ion battery management. Artech house.
Reid, C. (2007). Lithium Iron Phosphate Cell Performance Evaluations for Lunar
Extravehicular Activities.
Väyrynen, A., & Salminen, J. (2012). Lithium ion battery production.The Journal of Chemical
Thermodynamics,46, 80-85.
A123 Systems. (2011). Nanophosphate High Power Lithium Ion Cell ANR26660M1-B.
Retrieved from
Appendix A
The glider model or the vehicle dynamic model is a model used to find the power and energy needed at the wheels for a specified vehicle in a given drive cycle. The base equation for the glider model is:
𝑚𝑚𝑖𝑖𝑑𝑑𝑑𝑑𝑑𝑑𝑡𝑡 = 𝐹𝐹𝑡𝑡𝑡𝑡 − 𝐹𝐹𝑡𝑡𝑡𝑡− 𝐹𝐹𝑎𝑎𝑎𝑎𝑡𝑡𝑎𝑎 − 𝐹𝐹𝑔𝑔𝑡𝑡𝑎𝑎𝑔𝑔𝑎𝑎 (4)
𝑚𝑚𝑖𝑖𝑔𝑔𝑑𝑑𝑔𝑔𝑡𝑡 = 𝐹𝐹𝑡𝑡𝑡𝑡− 𝑚𝑚𝑚𝑚𝑚𝑚𝑡𝑡𝑡𝑡−12𝜌𝜌𝑚𝑚𝑔𝑔𝐴𝐴𝑓𝑓𝑑𝑑2− 𝑚𝑚𝑚𝑚 sin 𝛼𝛼 (5)
where 𝑚𝑚𝑖𝑖 is the inertial mass of the vehicle in kg, 𝑑𝑑 is the vehicle velocity in m/s, 𝐹𝐹𝑡𝑡𝑡𝑡 is the
traction force at the wheels in N, 𝐹𝐹𝑡𝑡𝑡𝑡 is the rolling resistance in N, 𝐹𝐹𝑎𝑎𝑎𝑎𝑡𝑡𝑎𝑎 is the aerodynamic drag in N, 𝐹𝐹𝑔𝑔𝑡𝑡𝑎𝑎𝑔𝑔𝑎𝑎 is the force generated by a grade in N, 𝑚𝑚 is the vehicle mass in kg, and 𝑖𝑖 is
the rotating inertia factor. If vehicle properties such as vehicle mass and front area are substituted into the base equation, the equation becomes:
𝑚𝑚𝑖𝑖𝑔𝑔𝑑𝑑𝑔𝑔𝑡𝑡 = 𝐹𝐹𝑡𝑡𝑡𝑡− 𝑚𝑚𝑚𝑚𝑚𝑚𝑡𝑡𝑡𝑡−12𝜌𝜌𝑚𝑚𝑔𝑔𝐴𝐴𝑓𝑓𝑑𝑑2− 𝑚𝑚𝑚𝑚 sin 𝛼𝛼 (6)
where g is the gravitational constant in N/kg, 𝑚𝑚𝑡𝑡𝑡𝑡is the coefficient of rolling resistance, ρ is air density in kg/m3, 𝑚𝑚
𝑔𝑔 is the coefficient of drag, 𝐴𝐴𝑓𝑓 is the frontal area of the vehicle in m2, and α
is road angle in degree.
power output, and motor losses. An efficiency map was used in the model. The data includes motor voltage input, motor current input, motor torque output, and motor speed output. The efficiencies were calculated using the following equation:
𝜂𝜂 = 𝑉𝑉𝑚𝑚𝑚𝑚𝑚𝑚𝑚𝑚𝑚𝑚𝐼𝐼𝑚𝑚𝑚𝑚𝑚𝑚𝑚𝑚𝑚𝑚
𝑇𝑇𝑚𝑚𝑚𝑚𝑚𝑚𝑚𝑚𝑚𝑚𝜔𝜔𝑚𝑚𝑚𝑚𝑚𝑚𝑚𝑚𝑚𝑚100% (7)
where η is the motor efficiency in %, 𝑉𝑉𝑚𝑚𝑎𝑎𝑡𝑡𝑎𝑎𝑡𝑡 is the voltage input of the motor in V, 𝐼𝐼𝑚𝑚𝑎𝑎𝑡𝑡𝑎𝑎𝑡𝑡 is
the current input of the motor in A, 𝑇𝑇𝑚𝑚𝑎𝑎𝑡𝑡𝑎𝑎𝑡𝑡 is the torque output of the motor in Nm, and 𝜔𝜔𝑚𝑚𝑎𝑎𝑡𝑡𝑎𝑎𝑡𝑡 is the speed output of the motor in rpm. In addition, a maximum output power map was created and used to reflect the maximum power output of the motor at every speed point.
A simple internal resistance model was used to calculate cell open-circuit voltage, battery pack open-circuit voltage, cell voltage, battery pack voltage, battery losses, and state-of-charge (SOC). The model also helped size the battery capacity and the battery maximum power, which is desired for the battery pack design. The model is described below:
𝑃𝑃𝑏𝑏𝑎𝑎𝑡𝑡𝑡𝑡 = 1000(𝑅𝑅𝑖𝑖𝑛𝑛𝐼𝐼𝑏𝑏𝑎𝑎𝑡𝑡𝑡𝑡2 + 𝑉𝑉𝑎𝑎𝑜𝑜𝐼𝐼𝑏𝑏𝑎𝑎𝑡𝑡𝑡𝑡) (8)
𝑆𝑆𝑆𝑆𝑚𝑚 = ∫ 𝐼𝐼𝑏𝑏𝑏𝑏𝑚𝑚𝑚𝑚𝑉𝑉𝑚𝑚𝑜𝑜
3600000𝐶𝐶𝑏𝑏𝑏𝑏𝑚𝑚𝑚𝑚100% (9)
where 𝑃𝑃𝑏𝑏𝑎𝑎𝑡𝑡𝑡𝑡 is the battery pack power in kW, 𝑅𝑅𝑖𝑖𝑛𝑛 is the battery pack internal resistance in ohms, 𝐼𝐼𝑏𝑏𝑎𝑎𝑡𝑡𝑡𝑡 is the battery pack current in A, 𝑉𝑉𝑎𝑎𝑜𝑜 is the battery pack open-circuit voltage in V,
Appendix B
To calculate the sum of information, the amount of information and the total duration of development elements, the significance matrix, the two sets of information targets, and the duration vector from Figure 9 are used. In addition, the information from external sources in Figure A1 is also used. As shown in Figure A1, only 𝐞𝐞𝟏𝟏(1) equals to one. The rest of 𝐞𝐞𝒎𝒎(𝑖𝑖), where m is from 1 to 14 and i is from 1 to 5 or 6 depending on which set of information targets is used, is zero in the baseline case. Having the above, the following procedure needs to be taken to calculate the sum of information and the amount of information until the set of smaller information target is reached. All the 𝐬𝐬, 𝐝𝐝, 𝐚𝐚 vectors generated from the procedure for all the development elements are given in Figure A2. The shaded cells indicate the values of the sums of information change from the previous development cycle.
Figure A1. Information matrix in the baseline case.
e(1) e(2) ··· e(6)
DE 1 1 0 ··· 0
DE 2 0 0 ··· 0
DE 3 0 0 ··· 0
DE 4 0 0 ··· 0
DE 5 0 0 ··· 0
DE 6 0 0 ··· 0
DE 7 0 0 ··· 0
DE 8 0 0 ··· 0
DE 9 0 0 ··· 0
DE 10 0 0 ··· 0
DE 11 0 0 ··· 0
DE 12 0 0 ··· 0
DE 13 0 0 ··· 0
1. Calculate 𝐬𝐬(1). As stated earlier, there is no new information generated before the development starts. Thus, 𝐝𝐝(0) is assumed to be a zero vector. With that assumption,
𝐬𝐬(1) is also a zero vector as shown in Figure A1.
2. Calculate 𝐝𝐝(1). Knowing 𝐝𝐝(0) and 𝐞𝐞(1), 𝐝𝐝(1) can be calculated using (1). 3. Calculate 𝐬𝐬(2). Once having 𝐝𝐝(1), 𝐬𝐬(2) can also be determined using (2).
4. Calculate 𝐝𝐝(2). Knowing 𝐒𝐒, 𝐝𝐝(1), and 𝐞𝐞(2), 𝐝𝐝(2) can be calculated using (1). Since only development element 1 has a change from 𝐬𝐬(1) to 𝐬𝐬(2), according to the significance matrix, the new information from development element 1 affects development element 2, 8, 9, and 14. S times 𝐝𝐝(1) adding 𝐞𝐞(2) gives the vector of
𝐝𝐝(2) in Figure A2.
5. Calculate 𝐬𝐬(3). 𝐬𝐬(3) is the sum of 𝐝𝐝(0) or 𝐬𝐬(1), 𝐝𝐝(1), and 𝐝𝐝(2).
Figure A2. Simulation results for the baseline case.
s(1) d(1) s(2) d(2) s(3) d(3) s(4) d(4) s(5) a(5) a(6)
DE 1 0 1 1 0 1 8 9 70 70 4 5
DE 2 0 0 0 3 3 6 9 87 90 3 4
DE 3 0 0 0 0 0 9 9 35 40 2 3
DE 4 0 0 0 0 0 4 4 69 70 2 3
DE 5 0 0 0 0 0 0 0 27 25 1 2
DE 6 0 0 0 0 0 0 0 16 15 1 2
DE 7 0 0 0 0 0 12 12 34 40 2 3
DE 8 0 0 0 3 3 4 7 68 70 3 4
DE 9 0 0 0 2 2 3 5 53 55 3 4
DE 10 0 0 0 0 0 9 9 37 40 2 3
DE 11 0 0 0 0 0 0 0 9 9 1 2
DE 12 0 0 0 0 0 2 2 16 15 2 3
DE 13 0 0 0 0 0 3 3 18 20 2 3
6. Continue calculating the sum of information and the amount of information in the following development cycles until every element in the set of smaller information target is reached. In the baseline case, the set of smaller information targets is reached in development cycle 5.
Appendix C
To demonstrate how to use the quantitative framework, consider the following scenario. A Technical Lead oversees the development of a lithium iron phosphate battery sub-system. The development is divided into three tasks: identification, design, and testing. Each task needs to be completed by a dedicated team under the Technical Lead. Based on his/her experience and other considerations, the Technical Lead understands how one task influences the other. Requirements for power rating, maximum voltage, and minimum voltage need to be identified. Once they are generated, they are used to draw boundaries in the design to produce a sub-system which can meet maximum voltage, minimum voltage, and power rating specifications. The requirements are also used to generate pass/fail criteria for voltage tests and a power rating test. The sub-system, as an outcome of the design, must meet the specifications in Table A1. The requirement for maximum and minimum voltage and the power rating are updated after each design iteration. Testing results, such as maximum voltage, minimum voltage, and power rating are also used to refine the voltage and power rating requirements. Furthermore, testing results are checked with the specifications.
(Reid, 2007; A123 Systems, 2011). The cell supplier provides battery cells with the cell specifications in (A123 Systems, 2011). To be able to meet the requirements, the sub-system is designed to have 100 cells per string and each string has 3 cells in parallel. The sub-system has 300 cells in total with a configuration of 100S3P. The cell maximum voltage (3.5 V) and minimum voltage (2.0 V) (A123 Systems, 2011) times the number of cells per string (100 cells) gives the maximum and minimum voltage values in Table A1, respectively. The discharge pulse power (200 W) (A123 Systems, 2011) times the total number of cells (300 cells) gives the power rating in Table A1. The outcome of the development is a sub-system that meets the specifications (specific values) shown in Table A1.
Without the help from model-based approaches, the Technical Lead relies heavily on testing when updating the requirements and validating the voltage and power rating of the sub-system. He/she is also interested in knowing under what conditions the sub-system matches the design specifications. If any of the specifications is not met, he/she needs to know why.
The DSM-based quantitative framework can be used to guide each cycle of the battery sub-system development. The amount of new information generated in development cycle i
can be characterized:
𝐝𝐝(𝑖𝑖) = 𝐒𝐒×𝐝𝐝(𝑖𝑖 − 1) + 𝐞𝐞(𝑖𝑖) (10)
Table A1
BATTERY SUB-SYSTEM SPECIFICATIONS
Parameter Value Unit
Battery Sub-System Max Voltage 350 V
Battery Sub-System Min Voltage 200 V
where 𝐒𝐒 is the significance matrix and 𝐞𝐞(𝑖𝑖) is the information from external sources in development cycle i. The sum of information for all the tasks before development cycle i can be characterized:
𝐬𝐬(𝑖𝑖) = � 𝐝𝐝(𝑗𝑗)
𝑖𝑖−1
𝑗𝑗=0
(11)
The total duration of time of all the tasks can be obtain by:
tf= 𝐚𝐚(𝑖𝑖)T𝐭𝐭 (12)
where 𝐚𝐚(𝑖𝑖) is the number of iterations vector and 𝐭𝐭 is the duration of iteration-time vector. To use the DSM-based quantitative framework, parameter values need to be assigned to 𝐒𝐒, 𝐬𝐬f, 𝐭𝐭, 𝐞𝐞(1), 𝐞𝐞(2), 𝐞𝐞(3), 𝐝𝐝(0), and 𝐬𝐬(1) by the Technical Lead, where 𝐬𝐬f is the information target vector. All the parameters are determined based on the Technical Lead’s experience with previous plug-in hybrid electric vehicle (PHEV) system development, the level of the required skills, and the level of the team experience. Other factors such as historical data may be considered for some of these parameters. The values of significance matrix 𝐒𝐒 are shown in Figure A3.
Figure A3. The simplified quantitative framework for the battery sub-system. The
significance matrix is included.
Task Description Task ID 1 2 3
Identification of Requirements 1 0 1 5
Design 2 3 0 4
The Technical Lead understands that the significance of information has different levels ranging from 5 to 0: most significant, significant, mild, weak, weakest, and no
significance at all. In this method, the diagonal terms (S1,1= S2,2=S3,3=0) are set to zeros because no information flows across different tasks.
𝐒𝐒 = �0 1 53 0 4
1 1 0� (13)
The requirements generated in the identification have mild influence on the design (S2,1=3) because they set boundaries for the design and improve design efficiency, whereas the specifications generated in the design also have the weakest influence on the identification (S1,2=1) because the specifications need to be validated first. The requirements have the
weakest influence on the testing (S3,1=1) because testing can be conducted regardless how
specific the requirements are, whereas the testing results have the most significant influence on the identification of requirements (S1,3=5) because they are strong evidence to correct
unrealistic requirements. The specifications have the weakest influence on the testing (S3,2=1)
because the success of conducting voltage tests and power tests does not rely on the specifications whereas the testing results have significant influence on the design (S2,3=4)
because they can help refine unrealistic design.