Division VI Paper ID: 06-18-01
Cyclic Out-of-Plane Behavior of SC Composite Structures
Kadir C. Sener1, Amit H. Varma2, Tom Bradt3
1 Research Engineer, Civil Engineering, Purdue University, West Lafayette, IN, USA 2 Professor, Civil Engineering, Purdue University, West Lafayette, IN, USA
3 Research Engineer, Civil Engineering, Purdue University, West Lafayette, IN, USA
ABSTRACT
Experimental investigations have been performed to determine the effects of cyclic loading on the out-of-plane strength or stiffness of steel-concrete composite (SC) walls for safety-related structures. Two large-scale SC beam specimens with round deformed wires provided for shear reinforcement were tested in this research. The beams were tested using a specifically designed test setup to apply the cyclic loading. The specimens were nearly identical except having different shear reinforcement ratios to demonstrate the cyclic behavior and ductility of each SC design case. The specimen with high shear reinforcement ratio represents SC walls designed to fail and dissipate energy by flexural yielding. The specimen with low shear reinforcement ratio was designed to fail in out-of-plane shear. The experimental results indicate that the specimen with high shear reinforcement ratio prevented shear failure while allowing the specimen to develop yielding and energy dissipation using the flexural yielding limit state. The specimen with lower shear reinforcement ratio failed in shear, but demonstrated good cyclic behaviour and failure shear strain. Design equations available in American code provisions were compared with the experimentally measured strengths to verify their applicability. The failure strengths of the tested specimens were reasonably and conservatively estimated with the equations provided in AISC N690s1.
INTRODUCTION
Nuclear power plant structures are designed withstand seismic loads that would subject the structure into cyclic load reversals. These load reversals are expected to damage and degrade the concrete performance and result in lower bound strength and stiffness. The objective of the tests was to demonstrate the cyclic behavior and ductility of SC design for out-of-plane loading. In regions of high out-of-plane shear demand close to supports and connections with other structures, SC structures typically use higher shear reinforcement ratios. In regions away from supports and connections, SC structures may use lower reinforcement ratios. The design philosophy for these structures provides for: (i) ductile behavior with flexural yielding as the governing limit state in regions that are expected to form earthquake energy dissipating mechanisms (EEDMs), and (ii) adequate strength and reasonable cyclic behavior in regions that are away from the EEDMs.
shear reinforcement ratio) was tested to develop flexural yielding and demonstrate the ductile cyclic out-of-plane behaviour of the SC design. The specimen with large shear reinforcement spacing (17 in.) was designed to have shear failure as the limit state and demonstrated strength and stiffness degradation due to load cycles before failure.
TEST SPECIMENS AND SETUP DESCRIPTION
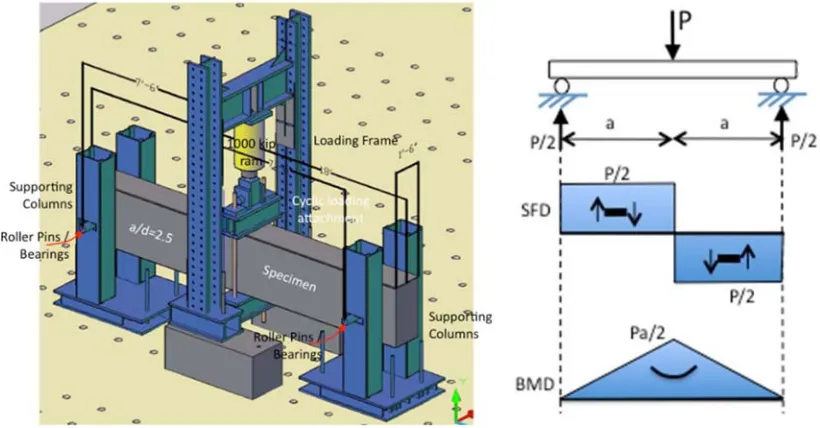
The specimens were tested using a unique three-point bending test setup that applied cyclic loading at the mid-span and had two support locations facilitated by round rods that pass through at the mid-height of the cross-sections. The supports were designed to allow the specimen to freely rotate through roller pin bearings. Translation in the horizontal direction was also permitted by having slotted holes in the test setup. A three-dimensional view of the test setup that was used to conduct the cyclic tests is shown in Figure 1, as well as a schematic of the loading for these tests, with expected shear force and bending moment diagrams. As shown, the specimens were subjected three-point bending with out-of-plane load (P) acting at the midspan.
Figure 1. Cyclic Out-of-Plane Bending Test-Setup and Loading Scheme
The loading frame was located 7.5 feet away from the supports. The constant distance between the support and load locations resulted in identical shear span lengths (a) for the specimens. The tests were conducted using a 1000-kip capacity double-acting hydraulic ram to apply the cyclic loads to the specimen. The holes in the specimen and the plates used to support the reactions are included in the specimen drawings shown in Figure 2 and Figure 3.
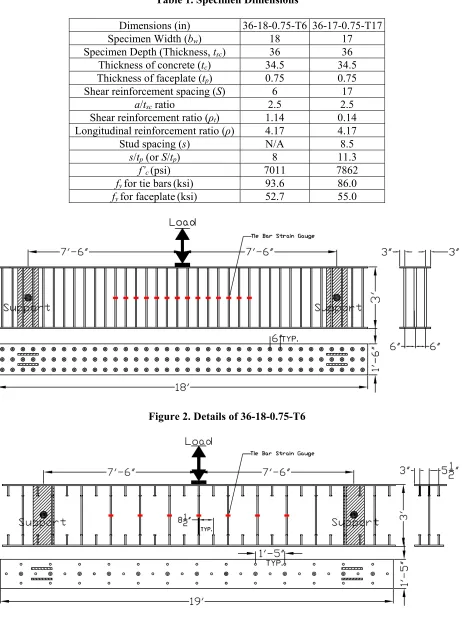
The geometric details and material strengths of the tested specimens are listed in Table 1. The specimens were named using the specimen geometries in the following format ‘section depth, width, faceplate thickness, shear reinforcement type and spacing’. The shear reinforcement type (round tie bars) and spacing was designated in the specimen name with ‘T’ followed by the spacing.
Table 1. Specimen Dimensions
Dimensions (in) 36-18-0.75-T6 36-17-0.75-T17
Specimen Width (bw) 18 17
Specimen Depth (Thickness, tsc) 36 36
Thickness of concrete (tc) 34.5 34.5
Thickness of faceplate (tp) 0.75 0.75
Shear reinforcement spacing (S) 6 17
a/tsc ratio 2.5 2.5
Shear reinforcement ratio (ρt) 1.14 0.14
Longitudinal reinforcement ratio (ρ) 4.17 4.17
Stud spacing (s) N/A 8.5
s/tp(or S/tp) 8 11.3
f’c(psi) 7011 7862
fyfor tie bars (ksi) 93.6 86.0
fyfor faceplate (ksi) 52.7 55.0
Figure 2. Details of 36-18-0.75-T6
LOADING PROTOCOL AND SENSOR LAYOUT
Both specimens were loaded using the same cyclic loading protocol. The specimens were first subjected to 6 elastic cycles: 2 cycles under load control at 0.25P, 2 cycles under load control at 0.5P, and 2 cycles under load at 0.75P. The average midspan displacement (0.75y) during the first cycle at 0.75P
was used to estimate the yield displacement (y) as 133.33 percent of 0.75y. The tests were continued by
subjecting the specimen to inelastic cycles in displacement control as follows: 3 cycles at 1y, 3 cycles at
1.5y,3 cycles at 2y, 3 cycles at 3y, 3 cycles at 5y, and so on until failure.
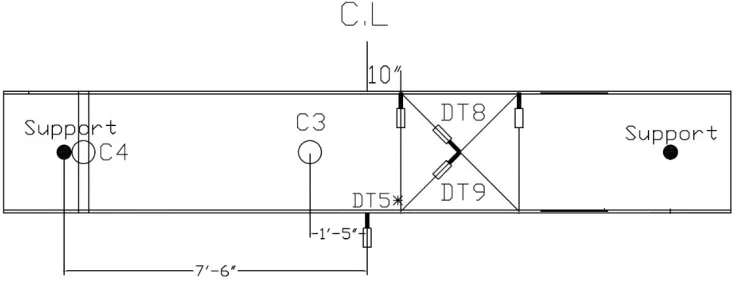
The instrumentation layout for the specimens were similar and included measuring the (i) vertical displacements by displacement transducers, (ii) rotations at the beam supports and over the plastic hinge at midspan by rotation transducers, (iii) strains in top and bottom steel plates by longitudinal strain gauges, (iv) strains in the deformed wire tie bars by strain gauges, (v) shear strains in the specimens by displacement transducers, (vi) pressure and forces applied by the hydraulic rams using pressure transducers. Figure 4 shows the layout of the transducers used to measure the vertical displacement of the tested specimens.
Figure 4. Layout for Vertical Displacement, Rotation and Displacement Transducer
TEST RESULTS
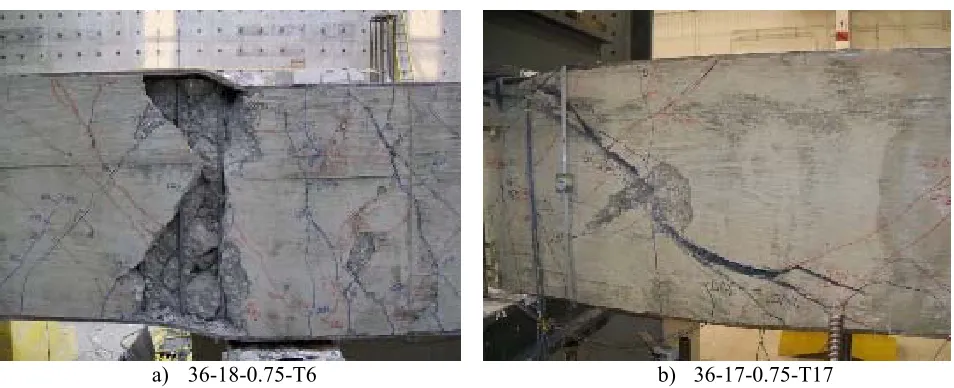
The net midspan displacement was calculated using the midspan (DT5*) and end support displacements. Figure 5 shows the shear force vs. midspan deflection response of both specimens. The shear force was equal to one-half of the applied loading at midspan. Pictures taken after the tests to illustrate the failure modes corresponding to each specimen are shown in Figure 6.
The force-displacement response of 36-18-0.75-T6 indicates that the specimen developed its plastic moment capacity. The behavior during 1y and 2y cycles did not exhibit any strength degradation. The
specimen demonstrated some strength degradation during the 3y cycles, and failed during the first
excursion to the 5y cycle. This degradation and failure was driven by local crushing and spalling of the
concrete under the concentrated load point at midspan. This local failure mode was controlled by the loading setup used in the experiment and shown in the failure picture. The specimen demonstrated good cyclic behavior with energy dissipation characteristics before the failure occurred. The specimen flexural capacity was accurately captured by the flexural strength equation given in AISC N690s1.
The force-displacement response of 36-17-0.75-T17 indicates that the specimen did not experience flexural yielding but completed the cycles at 1y, 1.5y, and 2y cycles. The specimen failed in during the
first excursion to the 3y cycle. Some strength degradation during the 1.5 and 2y cycles were observed,
a) 36-18-0.75-T6 b) 36-17-0.75-T17
Figure 5. Applied Shear Force vs. Mid-span Deflection
a) 36-18-0.75-T6 b) 36-17-0.75-T17
Figure 6. Failure Pictures of the Tested Specimens
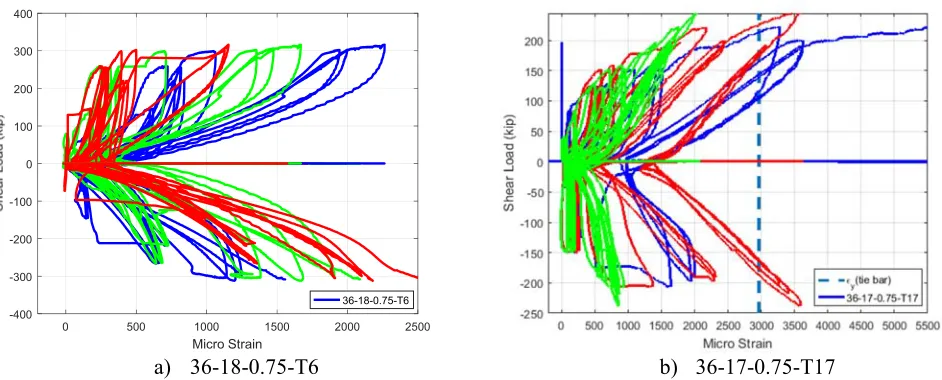
The layout of longitudinal strain gauges attached to the steel faceplates of the specimens is shown in Figure 7. Figure 8 shows plots of the applied shear vs. the measured longitudinal strains located near the mid-span of the top and bottom steel faceplates. The plots of 36-18-0.75-T6 indicate yielding in both the top and bottom steel faceplates during the inelastic cycles, which confirms the response observed in the force-displacement curve. The plots of 36-17-0.75-T17 indicate that the faceplates remained mostly in the elastic range of the response with some minor (local) yielding. This was expected from the force-displacement plots and failure mode since this specimen failed in shear before reaching flexural yielding corresponding to the yield or plastic moment of the SC composite section.
-2 -1.5 -1 -0.5 0 0.5 1 1.5 2 Midspan Deflection (in)
-400 -300 -200 -100 0 100 200 300 400
36-18-0.75-T6 VMn
-0.6 -0.4 -0.2 0 0.2 0.4 0.6 Midspan Deflection (in)
-300 -200 -100 0 100 200 300
Figure 7 Strain Gauge Layout for Steel Plates
a) 36-18-0.75-T6 b) 36-17-0.75-T17
Figure 8. Applied Shear Force vs Faceplate Strains near Load Point
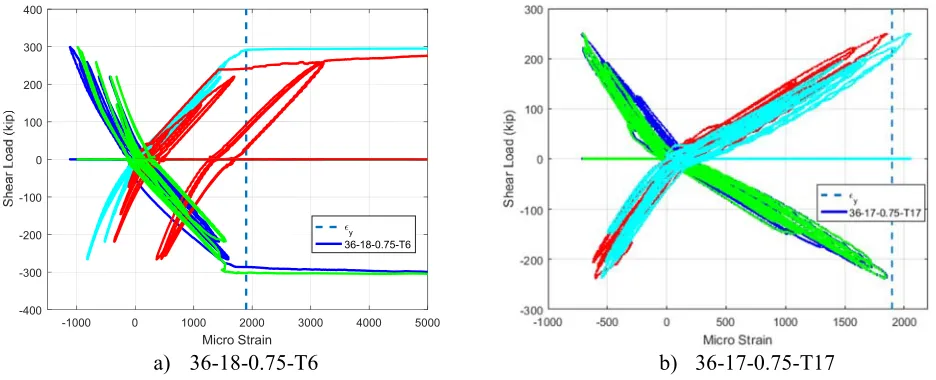
Figure 2 to Figure 3 show the locations of strain gauges attached on the shear reinforcement for both the specimens. Figure 9 shows plots of the applied shear vs. the measured strains located in the shear spans. The plots for 36-17-0.75-T17 indicate shear reinforcement strains in excess of the calculated yield strain (εy=2966 με) of the round deformed bars. This plot also confirms the shear failure response observed in the shear force-displacement and observed behavior of 36-17-0.75-T17. The specimen with smaller shear reinforcement spacing (36-18-0.75-T6) did not exhibit any extensive yielding in the shear reinforcement bars, as most of the tie bar strains were within the elastic range of behavior.
-1000 0 1000 2000 3000 4000 5000 Micro Strain
-400 -300 -200 -100 0 100 200 300 400
y
a) 36-18-0.75-T6 b) 36-17-0.75-T17
Figure 9. Applied Shear Force vs Tie Bar Strains
Figure 4 shows the rotational transducer layout mounted on one side of the specimens (sensor C3). Figure 10 shows the average moment-curvature (M-) response for the specimens. The average curvature
was calculated using the measured rotation on either side of the load and calculating the rotation change over a certain length. The average M- response shows that 36-18-0.75-T6 developed its plastic moment capacity under cyclic loading, without undergoing shear failure. Additionally, the specimen had excellent cyclic behavior with energy dissipating hysteresis loops. The average M- response for the specimens that failed in shear (36-17-0.75-T17) indicate that the specimen did not develop its plastic moment capacity and underwent shear failures during the inelastic load cycles.
a) 36-18-0.75-T6 b) 36-17-0.75-T17
Figure 10 Moment – Curvature Responses
Cyclic shear force-shear strain response curves of each specimen are plotted in Figure 11. Figure 4 shows the diagonally placed displacement transducer layout used for measuring approximate shear strains (γ) near the load points (sensors DT8-DT9). The shear force-shear strain responses of the specimens demonstrated good shear deformation capability of the specimens before the failure.
0 500 1000 1500 2000 2500
Micro Strain -400 -300 -200 -100 0 100 200 300 400 36-18-0.75-T6
-5 -4 -3 -2 -1 0 1 2 3 4 5
Curvature (1/in) 10-4 -2500 -2000 -1500 -1000 -500 0 500 1000 1500 2000 2500
Exp - 36-18-0.75-T6 M-Phi
-1 0 1
Curvature (1/in) 10-4 -2000 -1500 -1000 -500 0 500 1000 1500 2000
a) 36-18-0.75-T6 b) 36-17-0.75-T17
Figure 11 Shear Force – Shear Strain Responses
SUMMARY AND COMPARISONS OF TEST RESULTS
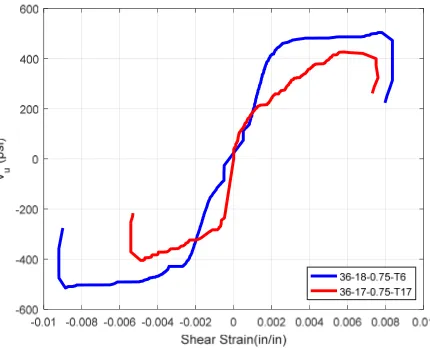
Figure 12(a) plots the backbone shear force-displacement curves of the tested specimens. The vertical axis of the backbone curve is the cross-sectional shear stress (vu) calculated by normalizing the measured shear force (Vexp) with the concrete cross-sectional area (Ac= tc∙bw), therefore the minor cross-section geometry difference among the specimens were eliminated. The horizontal axis of the shear force-displacement envelope plot is the mid-span force-displacement normalized with the distance between the two supports (equal to 15 ft for both the specimens). The normalized shear force-displacement cyclic envelope curves indicate that the initial portion of the response was not influenced by the shear reinforcement spacing. The increase in the shear reinforcement ratio is shown to increase the shear strength, but also resulted in altering the failure mode from shear failure to flexural yielding.
(a). Normalized Shear Force-Displacement Plot (b) Normalized Shear Force-Shear Strain Plot
Similarly, cyclic envelope curves for shear force-shear strain response of each specimen are plotted in Figure 12(b). The applied shear force was normalized with the concrete cross-sectional area (Ac) in the vertical axis of the plot. The envelope curves indicate that the specimen which failed in shear achieved a shear strain of at least 0.005, and the specimen that failed in flexure achieved up to 0.009 shear strain. It is also observed from the comparisons that increasing the shear reinforcement ratio has increased the shear deformation capacity.
In Table 2, the experimentally measured flexural stiffnesses are presented. These stiffnesses were obtained by calculating the tangent stiffness from the moment-curvature curves at a moment level of approximately 500 kip-ft. The theoretical flexural stiffness values shown in the table were obtained from the results of a 2D fiber cross-section analysis. The table indicates that 36-18-0.75-T6 with close tie bar spacing has compared well with the stiffness from the fiber model. The measured flexural stiffness of 36-18-0.75-T6 with higher faceplate slenderness (s/tp) ratio did not achieve the fiber model stiffness. This stiffness discrepancy may be due to the partial composite action that resulted from the occurrence of slip at the concrete and faceplate interface for this specimen with higher s/tp ratio.
Table 2: Flexural Stiffness at 500 kip∙ft
Flexural Stiffness at 500 kip-ft
(x108 kip∙in2) 36-18-0.75-T6 36-17-0.75-T17
Experimental Stiffness 3.23 2.61
2D Fiber Model Stiffness 3.12 3.00
Result/Analysis Ratio 1.04 0.87
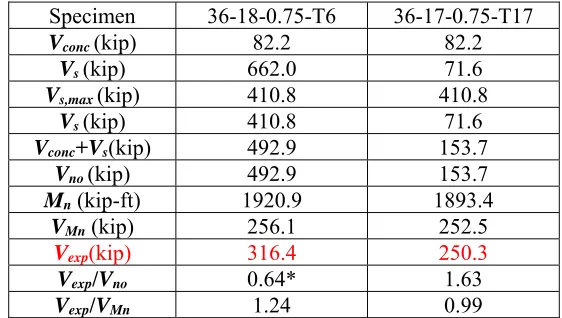
Table 3 compares the experimental results with the calculated strengths calculated using the equations given in AISC N690s1. The comparisons indicate that the flexural strength of 36-18-0.75-T6 was estimated reasonably using the out-of-plane flexural strength equation. Additionally, the design shear strength calculated for the specimen that failed in shear (36-17-0.75-T17) was also estimated conservatively by the design code equations.
Table 3. Summary of Result and Comparisons with Code Calculated Strength
Specimen 36-18-0.75-T6 36-17-0.75-T17
Vconc(kip) 82.2 82.2
Vs(kip) 662.0 71.6
Vs,max(kip) 410.8 410.8
Vs(kip) 410.8 71.6
Vconc+Vs(kip) 492.9 153.7
Vno(kip) 492.9 153.7
Mn (kip-ft) 1920.9 1893.4
VMn (kip) 256.1 252.5
Vexp(kip) 316.4 250.3
Vexp/Vno 0.64* 1.63
Vexp/VMn 1.24 0.99
CONCLUSIONS
This paper presented the results of an experimental test program consisting of two large-scale cyclic out-of-plane loading tests. The objective of the tests was to demonstrate the cyclic behavior and ductility of SC design for out-of-plane loading. The tested beams were shear reinforced with round deformed wires but with different spacing or shear reinforcement ratio, since shear reinforcement spacing is adjusted based on shear force demands in SC structures.
The specimen with small tie bar spacing (high shear reinforcement ratio) adequately prevented shear failure while allowing the specimen to develop yielding and energy dissipation using the flexural yielding limit state. The specimen with larger tie bar spacing failed in shear, but demonstrated good cyclic behaviour and failure shear strain. The failure strengths of the tested specimens were adequately estimated with the equations provided in AISC N690s1.
REFERENCES
AISC (2015). Specification for Safety-Related Steel Structures for Nuclear Facilities Including Supplement No. 1. American Institute of Steel Construction. AISC N690s1. Chicago, IL, 2015.
Sener, K.C., and Varma, A.H. (2014). “Steel-Plate Composite SC Walls: Experimental Database and Design for Out-of-Plane Shear.” Journal of Constructional Steel Research, September 2014;100:197– 210, http://dx.doi.org/10.1016/j.jcsr.2014.04.014.
Sener K.C., Varma A.H. (2015). “Steel-plate composite (SC) walls: out-of-plane flexural behavior, database, and design.” Journal of Constructional Steel Research, May 2015; 108:46–59.