CentreVu
Report Designer
Version 8
User Guide
585-210-930
Comcode 108502196
Issue 1
Printed in U.S.A.
Notice
Every effort was made to ensure that the information in this book was complete and accurate at the time of printing. However, information is subject to change.
Your Responsibility for Your System’s Security
Toll fraud is the unauthorized use of your telecommunications system by an unauthorized party, for example, persons other than your company’s employees, agents, subcontractors, or persons working on your company’s behalf. Note that there may be a risk of toll fraud associated with your telecommunications system and, if toll fraud occurs, it can result in sub-stantial additional charges for your telecommunications services.
You and your system manager are responsible for the security of your sys-tem, such as programming and configuring your equipment to prevent unauthorized use. The system manager is also responsible for reading all installation, instruction, and system administration documents provided with this product in order to fully understand the features that can intro-duce risk of toll fraud and the steps that can be taken to reintro-duce that risk. Lucent Technologies does not warrant that this product is immune from or will prevent unauthorized use of common-carrier telecommunication ser-vices or facilities accessed through or connected to it. Lucent Technolo-gies will not be responsible for any charges that result from such unauthorized use.
Lucent Technologies Fraud Intervention
If you suspect that you are being victimized by toll fraud and you need technical support or assistance, call Technical Service Center Toll Fraud Intervention Hotline at 1-800-643-2353.
Federal Communications Commission Statement
Part 15: Class A Statement. This equipment has been tested and found to
comply with the limits for a Class A digital device, pursuant to Part 15 of the FCC Rules. These limits are designed to provide reasonable protection against harmful interference when the equipment is operated in a commer-cial environment. This equipment generates, uses, and can radiate radio frequency energy and, if not installed and used in accordance with the instruction manual, may cause harmful interference to radio communica-tions. Operation of this equipment in a residential area is likely to cause harmful interference, in which case the user will be required to correct the interference at his own expense.
Part 15: Class B Statement. This equipment has been tested and found to
comply with the limits for a Class B digital device, pursuant to Part 15 of the FCC Rules. These limits are designed to provide reasonable protection against harmful interference in a residential installation. This equipment generates, uses, and can radiate radio-frequency energy and, if not installed and used in accordance with the instructions, may cause harmful interference to radio communications. However, there is no guarantee that interference will not occur in a particular installation. If this equipment does cause harmful interference to radio or television reception, which can be determined by turning the equipment off and on, the user is encouraged to try to correct the interference by one or more of the following measures: • Reorient the receiving television or radio antenna where this
may be done safely.
• To the extent possible, relocate the receiver with respect to the telephone equipment.
• Where the telephone equipment requires ac power, plug the telephone into a different ac outlet so that the telephone equip-ment and receiver are on different branch circuits.
Subpart J of Part 15 of FCC Rules. Only peripherals (computing input/ output devices, terminals, printers, etc.) certified to comply with the Class B limits may be attached to this computer. Operation with noncertified peripherals is likely to result in interference to radio and television recep-tion.
Part 68: Answer-Supervision Signaling. Allowing this equipment to be
operated in a manner that does not provide proper answer-supervision sig-naling is in violation of Part 68 rules. This equipment returns answer-supervision signals to the public switched network when:
• Answered by the called station • Answered by the attendant
• Routed to a recorded announcement that can be administered by the CPE user
This equipment returns answer-supervision signals on all DID calls for-warded back to the public switched telephone network. Permissible exceptions are:
• A call is unanswered • A busy tone is received • A reorder tone is received
Canadian Department of Communications (DOC) Interference Information
This digital apparatus does not exceed the Class A limits for radio noise emissions set out in the radio interference regulations of the Canadian Department of Communications.
Le Présent Appareil Nomérique n’émet pas de bruits radioélectriques dépassant les limites applicables aux appareils numériques de la class A préscrites dans le reglement sur le brouillage radioélectrique édicté par le ministére des Communications du Canada.
Trademarks
●
DEFINITY is a registered trademark of Lucent Technologies. ●
CentreVu is a registered trademark of Lucent Technologies. ●
CONVERSANT is a registered trademark of Lucent Technologies. ●
Informix is a registered trademark of Informix Software, Inc. ●
Intel is a registered trademark of Intel. ●
Microsoft, MS, MS-DOS, Windows, Windows 95, Windows NT, and Access are registered trademarks of Microsoft Corporation. ●
OpenLink is a trademark of OpenLink Software. ●
Crystal Reports is a trademark of SeaGate Software. ●
Solaris is a trademark of Sun Microsystems, Inc. ●
SPARC trademarks, including the SCD compliant logo, are trademarks or registered trademarks of SPARC International, Inc. SPARCstation, SPARCserver, SPARCengine, SPARCworks, and SPARCompiler are licensed exclusively to Sun Microsystems, Inc. Products bearing SPARC trademarks are based upon an architecture developed by Sun Microsystems, Inc.
●
Sun and Sun Microsystems are trademarks or registered trademarks of Sun Microsystems, Inc.
●
Ultra Enterprise 3000 and Ultra 5 are trademarks of Sun Microsystems, Inc.
●
UNIX is a registered trademark in the United States and other countries, licensed exclusively through X/Open Company Limited. ●
Voice: 1-800-457-1235
International Voice: 317-322-6416 Fax: 1-800-457-1764
International Fax: 317-322-6699
Write: Lucent Technologies BCS Publications Center 2855 N. Franklin Road
Indianapolis, IN 46219
Order: Document No. 585-210-930 Comcode 108502196 Issue 1, December 1999
You can be placed on a Standing Order list for this and other documents you may need. Standing Order will enable you to automatically receive updated versions of individual documents or document sets, billed to account information that you provide. For more information on Standing Orders, or to be put on a list to receive future issues of this document, please contact the Lucent Technologies Publications Center.
Warranty
Lucent Technologies provides a limited warranty on this product. Refer to the “Limited use Software License Agreement” card provided with your package.
European Union Declaration of Conformity
Lucent Technologies Business Communications Systems declares that XXX equipment specified in this document conforms to the referenced European Union (EU) Directives and Harmonized Standards listed below:
EMC Directive 89/336/EEC
Low Voltage Directive 73/23/EEC
The “CE” mark affixed to the equipment means that it conforms to the above Directives.
Disclaimer
Intellectual property related to this product (including trademarks) and registered to AT&T Corporation has been transferred to Lucent Tech-nologies Incorporated.
Any references within this text to American Telephone and Telegraph Corporation or AT&T should be interpreted as references to Lucent Tech-nologies Incorporated. The exception is cross references to books pub-lished prior to December 31, 1996, which retain their original AT&T titles.
Heritage Statement
Lucent Technologies—formed as a result of AT&T’s planned restructur-ing—designs, builds, and delivers a wide range of public and private net-works, communication systems and software, consumer and business telephone systems, and microelectronics components. The world-renowned Bell Laboratories is the research and development arm for the company.
Comments
To comment on this document, return the comment card at the front of the document.
Acknowledgment
Table of Contents
CentreVu®
Report Designer
Version 8
User Guide
iii
1 Introduction . . . 1-1
About the Report Designer . . . . 1-1
About the Report Wizard. . . . 1-3
Contents of This Document . . . . 1-4
Conventions Used in This Document . . . . 1-6
Related Documents . . . . 1-7
2 Using the Report Wizard . . . 2-1
About the Report Wizard. . . . 2-1
How the Report Wizard Works . . . . 2-1
Starting the Report Wizard . . . . 2-5
Toolbar Button . . . . 2-5
Report Selector Window . . . . 2-6
Creating a New Report . . . . 2-7
Selecting a Report Type Page. . . . 2-8
Selecting a Report Layout Page . . . . 2-10 Defining a Report Layout Section(s) . . . . 2-13 Selecting the Table Format . . . . 2-21 Changing Input Captions . . . . 2-26 Saving the Report . . . . 2-27 Finishing the Report . . . . 2-29
3 Using the Report Manager . . . 3-1
Introduction . . . . 3-1
About the Report Manager . . . . 3-2
Viewing or Changing a Report’s Properties . . . . 3-3
Copying a Report to the Designer Category . . . . 3-4
Copying a Designer Report to a File . . . . 3-7
Copying a Designer Report from a File . . . . 3-9
Deleting a Report from the Designer Category . . . . 3-11
iv
4 Report Designer Basics . . . 4-1
Introduction . . . . 4-1
Starting the Report Designer . . . . 4-2
Exiting the Report Designer. . . . 4-3
Report Designer Menus . . . . 4-4
Menu Bar . . . . 4-4
Other Attributes of the Design Mode Window . . . . 4-10 Online Access to Database Definitions . . . . 4-10
Steps Required to Create a New Report . . . . 4-11
Steps Required to Edit an Existing Report . . . . 4-13
5 Design Mode Basics . . . 5-1
Introduction . . . . 5-1
Copying an Item and Pasting the Item Into the Same Report . . . . 5-2
Copying an Item from One Report and Pasting the Item
Into Another Report . . . . 5-3
Cutting an Item from the Report . . . . 5-4
Deleting an Item from the Report . . . . 5-5
Using Drag-and-Drop to Arrange Items on the Report . . . . 5-6
Resizing an Item on the Report . . . . 5-7
Selecting and Moving Multiple Items on the Report . . . . 5-8
Changing the Width of a Column in a Table . . . . 5-9
Changing the Column Headings . . . . 5-10
Aligning Fields . . . . 5-11
Scale to Page . . . . 5-12
6 Edit | Inputs . . . 6-1
Introduction . . . . 6-1
About Report Input Fields . . . . 6-2
Adding Input Fields to the Input Window . . . . 6-3
Deleting Input Fields from the Input Window . . . . 6-8
Editing the Order of Input Fields . . . . 6-9
Editing the Appearance of Input Fields . . . . 6-10
Setting Up Inputs for a Multi-ACD Report . . . . 6-12
v
7 Edit | Queries . . . 7-1
Introduction . . . . 7-1
Defining Queries for a Report . . . . 7-2
Creating a Real-Time or Historical Query . . . . 7-3
Creating an Integrated Query . . . . 7-12
Editing an Existing Real-Time or Historical Query . . . . 7-17
Editing an Existing Integrated Query. . . . 7-21
Copying a Query . . . . 7-25
Deleting a Query . . . . 7-26
8 Insert | Chart. . . 8-1
Introduction . . . . 8-1
Inserting a Chart on a Report . . . . 8-2
9 Insert | Field . . . 9-1
Introduction . . . . 9-1
Using the Field Assistant “Select a field type” Window . . . . . 9-2
Inserting an ACD Name Field on the Report . . . . 9-3
Inserting Data Item Fields on the Report . . . . 9-4
Inserting Input Value Fields on the Report . . . . 9-5
Inserting Report Data Start Time Field on the Report . . . . 9-6
Inserting Time Report Run Field on the Report . . . . 9-7
10 Insert | Table. . . 10-1
Introduction . . . . 10-1
Inserting a Table on the Report . . . . 10-2
11 Insert | Text . . . 11-1
Introduction . . . . 11-1
Inserting Text on the Report . . . . 11-2
12 Format | Chart . . . 12-1
Introduction . . . . 12-1
Formatting a Chart in a Report . . . . 12-2
vi
Using the General Tab . . . . 12-4
Axis Tab . . . . 12-5 Axis Tab Options . . . . 12-5 Using the Axis Tab . . . . 12-7
Data Tab . . . . 12-9 Data Tab Options . . . . 12-9 Using the Data Tab . . . . 12-9
Data Labels Tab. . . . 12-11 Data Labels Tab Options . . . . 12-11 Using the Data Labels Tab . . . . 12-12
Fonts Tab . . . . 12-13 Fonts Tab Options . . . . 12-13 Using the Fonts Tab . . . . 12-13
Legend Tab . . . . 12-15 Legend Tab Options . . . . 12-15 Using the Legend Tab . . . . 12-16
Series Labels Tab . . . . 12-17 Series Labels Tab Option . . . . 12-17 Using the Series Labels Tab . . . . 12-17
Title Tab . . . . 12-18 Title Tab Options . . . . 12-18 Using the Title Tab . . . . 12-18
Type Tab . . . . 12-20 Type Tab Options . . . . 12-20 Using the Type Tab . . . . 12-21
3D Effects Tab . . . . 12-22 3D Effects Tab Options . . . . 12-22 Using the 3D Effects Tab . . . . 12-24
13 Format | Table . . . 13-1
Introduction . . . . 13-1
Formatting a Table in a Report . . . . 13-2
General Tab . . . . 13-3 General Tab Options. . . . 13-3 Using the General Tab . . . . 13-4
Data Tab . . . . 13-5 Data Tab Options . . . . 13-5 Using the Data Tab . . . . 13-5
Fonts Tab . . . . 13-6 Fonts Tab Options . . . . 13-6 Using the Fonts Tab . . . . 13-7
vii
Format Tab Options . . . . 13-8 Using the Format Tab . . . . 13-9
Headers Tab . . . . 13-10 Headers Tab Options . . . . 13-10 Using the Headers Tab . . . . 13-10
Sort Tab . . . . 13-11 Sort Tab Options . . . . 13-11 Using the Sort Tab . . . . 13-12
Summary Tab . . . . 13-13 Summary Tab Options . . . . 13-13 Using the Summary Tab . . . . 13-14
14 Format | Field . . . 14-1
Introduction . . . . 14-1
Field Format Window Elements . . . . 14-2
Using the Field Format Options Window . . . . 14-4
15 Format | Text . . . 15-1
Introduction . . . . 15-1
Text Format Options Window Elements . . . . 15-2
Formatting Text on the Report . . . . 15-3
16 Error Messages . . . 16-1
Introduction . . . . 16-1
Phase 1 Error Messages . . . . 16-2
Phase 2 Historical Report Error Codes . . . . 16-5
Phase 2 Real-Time Report Error Codes . . . . 16-11
17 How CentreVu® CMS Stores and Retrieves Data . . . 17-1
Introduction . . . . 17-1
How CentreVu CMS Stores Data . . . . 17-2
How CentreVu CMS Retrieves Data . . . . 17-5
18 SQL Query and CMS Database Table Basics . . . 18-1
Introduction . . . . 18-1
viii
WHERE Clause for Selecting Rows from an ACD . . . . 18-4 WHERE Clause for Excluding Rows of Data . . . . 18-5
CMS Database Table Basics . . . . 18-6 Database Items . . . . 18-8 Constants . . . . 18-9 Calculations . . . . 18-10
Creating a Custom Data Table . . . . 18-13
Step 1: Access the CentreVu CMS Database in INFORMIX . . . 18-14
Step 2: Build the Table . . . . 18-15 Step 3: Add Data to the Table . . . . 18-19
Modifying a Table . . . . 18-22 Adding a Column to a Table . . . . 18-22 Changing a Column . . . . 18-23 Deleting a Column . . . . 18-23 Changing Data in a Table . . . . 18-24 Adding Rows of Data to a Table . . . . 18-24 Changing Rows of Data in a Table . . . . 18-24 Deleting Rows of Data From a Table . . . . 18-25
A Using the Report Designer - Examples . . . A-1
General Information . . . . A-1
Creating a Integrated Report Using the
Report Designer . . . . A-1
Modify the Integrated Report Using the Report Designer. . . . A-2
B Database Items and Calculations . . . B-1
General Information . . . . B-1
About the Report Designer 1-1
1 Introduction
About the Report Designer
1The Report Designer feature can be purchased with the Lucent CentreVu® Supervisor software. The Report Designer allows you to create reports that are tailored to your call center needs. You then run the reports you have created from the Supervisor application.
The Report Designer allows you to create new reports, edit standard Call Management System (CMS) and Supervisor reports, and copy items from one report to another report.
When you use the Report Designer to edit an existing report or to create a new one, you usually begin by creating or modifying a Structured Query Language (SQL) query. Using the database items contained in the table(s) referenced in the query, you can populate fields, grids, and charts for the report. The fields, grids, and charts can then be sized, moved, and changed on the report.
When you have finished creating or editing a report, you save the report on the CMS server. If you assigned Global user permissions to the report, other Supervisor users with the appropriate permissions can run the report.
When you create real-time, historical, and integrated reports, the Report Designer lets you do the following:
● Copy existing report designs, including standard report designs ● Edit reports by adding, moving, copying, and deleting fields, grids, or
charts
● Define Automatic Call Distribution (ACD) data for report fields, grids,
and charts
● Enter text for field labels, column headers, row headers, or special
instructions.
For historical reports only, the Report Designer allows you to do the following:
● Merge data in a report field to include data from different entities within
an ACD (for example, defining a field that represents the percentage of calls an agent answered compared to all calls handled by that agent’s split or skill).
● Merge data in a report field to include data with different time frames (for
example, defining a field that represents the percentage of calls
answered in an intrahour interval compared to all calls answered in the day).
● Include data from custom data tables that you create and populate
About the Report Designer 1-2
If you create custom database tables, as described in Chapter 18, “SQL Query and CMS Database Table Basics” make sure that you name the tables with the prefix “c_.” If you do not use the c_ convention, the custom tables will not automatically be backed up.
If you create custom data tables, then you need to make sure there is enough disk space available to store the data. CMS does not automatically check the available space. If you fill up your disk with custom data, you will lose or damage stored custom and ACD data. See the CentreVu® CMS R3V8 Administration (585-210-910) document for more information about disk storage.
Do not tamper with standard ACD data in the CMS database. If you do, then you will lose stored data.
For integrated reports only, the Report Designer allows you to do the following:
● Display real-time and historical data on the same report
● Display cumulative data that shows up-to-the-moment data since a
About the Report Wizard 1-3
About the Report Wizard
1Report Wizard is a supplement to Report Designer. The Report Wizard feature delivers user assistance, by way of a wizard, to quickly and easily generate new customized reports. The wizard provides instructional help that guides you through a series of tasks that create a new customized report.
The Report Wizard feature is available only if you have purchased the Report Designer feature. Report Wizard can be accessed only when Report Designer is activated on the CMS server and when you have the appropriate permissions to access Report Designer.
All reports created using Report Wizard have the same designation and accessibility as those created in Report Designer. Thus, reports created by Report Wizard are referred to as Report Designer reports. This means that reports created by Report Wizard will be accessible only by
Contents of This Document 1-4
Contents of This Document
1This book describes what you need to know to create new reports and to edit existing reports through the Report Designer and Report Wizard. The book is organized as follows:
● Chapter 1, Introduction — gives you background information on
the Report Designer application and general information about this book.
● Chapter 2, Using the Report Wizard — gives you background
information on the Report Wizard (features and functionality) and steps you through the creation of a new report.
● Chapter 3, Using the Report Manager — teaches you the basic
procedures you need to know in order to use the Report Manager feature of Supervisor. The procedures included in this chapter are Viewing a Report’s Properties, Copying a Report to the Designer Category, Copying a Designer Report to a File, Copying a Designer Report from a File, Deleting a Report from the Designer Category, and Opening the Report Designer Using the Edit or New Button.
● Chapter 4, Report Designer Basics — teaches you the basic
information that you need to know in order to use the Report Designer. The procedures included in this chapter are Starting the Report Designer, Exiting the Report Designer, Report Designer Menus, Steps Required to Create a New Report, and Steps Required to Edit an Existing Report.
● Chapter 5, Design Mode Basics — teaches you basic procedures
that you will use in the Report Designer design mode. The procedures included in this chapter are Copying an Item and Pasting the Item Into the Same Report, Copying an Item from One Report and Pasting the Item Into Another Report, Cutting an Item from a Report, Deleting an Item from the Report, Using Drag-and-Drop to Arrange Items on the Report, Resizing an Item on the Report, and Selecting Multiple Items on the Report.
● Chapter 6, Edit | Inputs — shows you how to edit the existing input
Contents of This Document 1-5
● Chapter 7, Edit | Queries — shows you how to edit the existing
queries and create new queries for the report you are editing. The sections included in this chapter are Defining Queries for a Report, Creating a New Real-Time or Historical Query, Creating a New Integrated Query, Editing an Existing Query, Copying a Query, and Deleting a Query.
● Chapter 8, Insert | Chart — teaches you to insert a chart on a
report.
● Chapter 9, Insert | Field — teaches you to insert a field on a report. ● Chapter 10, Insert | Table — teaches you to insert a table on a
report.
● Chapter 11, Insert | Text — teaches you to insert text on a report. ● Chapter 12, Format | Chart — gives you general information about
the tabs that you access from the Chart option of the Format menu.
● Chapter 13, Format | Table — gives you general information about
the tabs that you access from the Table option of the Format menu.
● Chapter 14, Format | Field — gives you general information about
the window that you access from the Format option of the Format menu.
● Chapter 15, Format | Text — gives you general information about
the window that you access from the Text option of the Format menu.
● Chapter 16, Error Messages — lists the most common errors that
you will encounter as a result of errors in queries that you create for reports.
● Chapter 17, How CentreVu CMS Stores and Retrieves Data —
gives you general information about how the CMS server stores and retrieves the data that is used in the reports.
● Chapter 18, SQL Query and CMS Database Table Basics —
gives you general information about how INFORMIX* SQL queries work and how the INFORMIX tables that are used in CMS are structured. If you are not familiar with SQL queries, you need to read this chapter before you attempt to create a query for your report.
● Appendix A, Using the Report Designer - Examples — provides
step-by-step examples on how to create and edit a commonly used report with Report Designer.
Conventions Used in This Document 1-6
Conventions Used in This Document
1The following conventions are used in this book:
● The instructions given in this book are based on the assumption that
you are familiar with your computer and the Windows* operating system, including standard Window conventions, such as using the F1 key to activate Help.
● To use this book successfully, you must be familiar with the
Supervisor application and have some knowledge of how CMS reports work.
For instructions on using the Supervisor application, refer to the CentreVu® CMS R3V8 Administration (585-210-910) document. For information on CMS reports, refer to the CentreVu® Supervisor Version 8 Reports document (585-210-929).
● Windows refers to the following operating systems:
— Windows 95†
— Windows NT‡ 4.0.
● Unless the right button is specified, use the left mouse button
whenever you are instructed to click or select an item.
● Menu names, menu items, and window names are shown in initial
capital letters. For example: Choose Save from the File menu.
● Italics are used to reference other documents, to reference file
names, and for trademarks.
● Sections and chapters that are referred to in text are shown in
quotes. For example: See Chapter 1, “Introduction,” for an outline of the information in this book.
● A graphic of each Supervisor window is not included in this book.
Graphics are provided to give you general information about a type of window, or to help clarify a procedure that is being described. The examples in this book are taken from Supervisor running in
Windows 95.
Related Documents 1-7
Related Documents
1The following documents include additional information about the CMS or Supervisor:
● CentreVu® Supervisor Version 8 Installation and Getting Started
(585-210-928)
● CentreVu® CMS Release 3 Version 8 Administration (585-210-910) ● CentreVu® Supervisor Version 8 Reports (585-210-929)
● CentreVu® CMS Release 3 Version 8 Database Items and
About the Report Wizard 2-1
2 Using the Report Wizard
About the Report Wizard
2Report Wizard is a supplement to Report Designer and is available only if you have purchased Report Designer. The Report Wizard feature delivers user assistance, by way of a wizard, to quickly and easily generate new customized reports. The wizard provides instructional help that guides you through a series of tasks that create a new customized report.
The following features are available in the Report Wizard:
● Creating a new report
● Previewing the new report
● Saving the new report
● Running the new report.
All reports created using Report Wizard have the same designation and accessibility as those created in Report Designer. Thus, reports created by Report Wizard are referred to as Report Designer reports. This means that reports created by Report Wizard will be accessible only by CentreVu® Supervisor users.
How the
Report Wizard
Works
2The Report Wizard is based on the completion of report creation tasks. (For a list of the tasks involved in creating a new report, see the “Creating a New Report” section in this chapter.) The report layout you choose will determine the number of tasks you will have to complete to create your report. Report Wizard presents these tasks by way of pages (screens). The title bar of each page contains the following information:
● Step (task) number you are currently working on
● Number of total steps (tasks) required to complete the report
About the Report Wizard 2-2
Each page of the Report Wizard contains command buttons to navigate through the wizard and command buttons that help you define your report. The following table for an explanation of these command buttons.
Command Action
<Back Returns to the previous page. (This command button is disabled on the first page of the Report Wizard.) When you back up to previous pages Report Wizard will retain the values you entered unless you back up to a
previous page and make changes that impact ensuing pages.
Next> Moves to the next page in the sequence, maintaining whatever settings you provided on the previous pages. (This command is replaced with the Finished button on the final page of the wizard.)
Finished Applies your settings or the default settings from all pages and completes the task.
Cancel Discards any selections you have made (only if you have not saved the report), terminates the process, and closes the Report Wizard.
If you saved the report before selecting the Cancel button, Report Wizard closes; however, you will be able to run or edit the report in Report Designer.
Help Provides information about the page.
Data Item Definition
Provides a definition for the selected database item or calculation.
Moves a database item or calculation up in the list of Selected Data Items.
Moves a database item or calculation down in the list of Selected Data Items.
Removes a database item or calculation from the Selected Data Items list.
About the Report Wizard 2-3
General Report
Wizard
Functionality
2The following list provides the general functionality of the Report Wizard:
● Report Wizard provides default choices in each task. You may
change any of the defaults to choices that best meet your needs. Each time you use the Report Wizard to create a new report, the original default choices will be shown.
● Report Wizard can access all database items and standard
calculations. Although you can access all database items and
standard calculations, you cannot create new calculations or link fields together with math functions by way of the Report Wizard. However, Report Designer allows you to create new calculations and link fields together with math functions for reports which you create in the Report Wizard.
● Report Wizard can create a report with charts and tables. With
the Report Wizard you will be able to create a report that contains the following:
— one or two charts,
— one or two tables, or
— one chart and one table.
You will have to use the Report Designer to enter text or fields containing one data item.
● Report Wizard does not display queries and database table
names used to generate a report. If you need to see this type of
information, use Report Designer.
● Report Wizard provides access to database item definitions.
While in the Select Data Items page of the Report Wizard, you will be able to click on a database item or calculation, and then select the Data Item Definition button to view the definition of the database item or calculation which you highlighted.
Edit Item Heading
Provides a method for editing a database item heading.
Preview Captures a screen shot of your report as it is currently defined.
About the Report Wizard 2-4
● Report Wizard does not allow editing of a completed report.
Report Wizard is designed to create new reports only. However, you can edit a completed report in Report Designer.
● Report Wizard does not allow reentry. Report Wizard does not
Starting the Report Wizard 2-5
Starting the Report Wizard
2Report Wizard can be accessed only when Report Designer is activated on the CMS server and when you have the appropriate permissions to access Report Designer.
There are two methods available to start the Report Wizard. These methods are as follows:
● Toolbar button on the Controller
● Report Selector window.
Toolbar Button
2 If you have purchased the Report Designer feature, a toolbar button willbe automatically added to the CentreVu Supervisor Controller window’s toolbar.
Starting the Report Wizard 2-6
Report Selector
Window
2To access the Report Wizard by way of the Report Selector window, do the following:
1. From the Commands menu (located on the CentreVu Supervisor Controller window), select the Reports... menu item. The Select a Report window appears as shown below:
2. Select the New button. The New Report dialog box, as shown below, will appear and ask you if you want to run the Report Wizard.
3. Select Yes to open the Report Wizard.
Creating a New Report 2-7
Creating a New Report
2Creating a New Report 2-8
To begin the creation of a new report, select the Next> button. This will advance you to the Select a Report Type page of the wizard. The Select a Report Type page is the first page of the wizard. Go to the next section, “Selecting a Report Type Page,” in this chapter.
Selecting a
Report Type
Page
2Selecting a report type is the first task in creating a new report. The report type determines whether the data in the report is real-time, integrated, or historical. For example, if you select a real-time report, you will not be able to specify historical data in the report. The following list provides information about each type of report:
● Real-Time—Reports that refresh in real time.
Real-time reports are reports that display current ACD call activity on agents, splits/skills, trunks, trunk groups, vectors, and vector directory numbers (VDNs) for the current interval (15, 30, or 60 minutes). Current intrahour interval real-time reports are periodically updated as data changes during the interval.
● Integrated—Reports that refresh in real-time and show information
Creating a New Report 2-9
● Historical—Reports that give information tabulated over a period of
time. Historical reports display past ACD data for various agent, split/skill, trunk, trunk group, vector or VDN activities. You must select a historical report if you want to include the following data:
— Exceptions
— Call Work Code
— Agent Trace
— Call Record.
The default for report type is always Real-Time.
To select a report type other than the default, do the following from the Select a Report Type page:
1. Click on the radio button to the left of the report type you want to use.
Creating a New Report 2-10
Selecting a
Report Layout
Page
2Selecting a report layout is the second task in creating a new report. The layout determines how your data will be represented in the report. Report layouts are in the form of charts, tables, or both. Charts provide a
graphical representation of data, and tables provide data in columns and rows. Each chart or table in the layout is referred to as a section. A report layout can contain one or two sections. See the following table for a description of the different types of report layouts available to you in the Report Wizard.
Each section of a report layout must be defined. Defining a section includes the following tasks:
● Selecting a data group (accomplished through the Select a Data Group page).
● Selecting data group items (accomplished through the Select Data Items page).
● Selecting a format for the chart or table in the section (accomplished through the Select the Chart Format page or on the Select the Table Format page).
● Previewing the section (accomplished through the Preview page) Optional.
To select a report layout, do the following:
1. Click on the image that represents the layout you want for your new report. Text describing the selected layout will appear on the lower portion of the page under the Selected Layout field.
If you specified a report layout that contains one section (for example, a single table), go to Step 2 now.
Charts Tables Combination
Single chart (one section)
—Default—
Single table (one section)
Table and chart side by side (two sections)
Two charts side by side (two sections)
Two tables side by side (two sections)
Chart and table side by side (two sections)
Two charts: one on top and one on bottom (two sections)
Creating a New Report 2-11
If you specified a report layout that contains more than one section (for example, one table and one chart), the Selection Layout page of the wizard appears as shown on page 11. This page provides the following information:
● Section you are about to define—a section that appears to be pressed with an arrow pointing to it.
● Section you have not defined—a section that appears not to be pressed, without an arrow.
Creating a New Report 2-12
If you specified a report layout that contains one section, the Selection Layout page will not appear. Instead, the Select a Data Group page will appear as shown on page 12.
2. Select Next> to begin defining the report layout section(s). The Select a Data Group page appears as shown below. Go to the next section, “Defining a Report Layout Section(s),” in this chapter.
To redefine a previous section, select the <Back button.
Creating a New Report 2-13
Defining a
Report Layout
Section(s)
2Defining a report layout section(s) consists of the following tasks:
● Selecting a data group
● Selecting data items
● Selecting the chart or table format
● Previewing the work already done on the report (optional).
Selecting a Data
Group Page
2Creating a New Report 2-14
The data groups available are placed in a tree view structure. There can be up to three levels of data, the last level containing the individual data groups. From this tree view structure, you will select an individual data group for the section you are defining. A description of the different levels is as follows:
● First Level—the highest classification level of data. For example, the highest classification levels of data for a real-time table are Agent, Split/Skills (multiple), Trunk Group, VDN(single), VDNs (multiple), and Vectors.
● Second Level—a breakdown of the first classification levels of data. For example, the second levels of data for the Split/Skills (multiple) category are Multi-ACD, Top Agent Skills Information, Expected Wait Time at each priority, Number of Agents in AUX Work States, Performance, Type of Agents Staffed, and No Pre-selection. Individual data groups are contained under this level of data also.
Creating a New Report 2-15
Categories of data and sub-categories of data can be expanded
(represented with a “+” sign) and collapsed (represented with a “-” sign). By default, when the Select a Data Group page of the wizard appears, one category will be expanded with one data group selected. The default is based on the information (report type and report layout) which you provided to the wizard previously.
To choose a data group, do the following:
1. Expand the categories of data until you reach the individual data groups. (Individual data groups cannot be expanded, they are the lowest category of data.) At this point you have not yet selected the actual individual data group, you have just narrowed your selection of a specific category of data. The Next> button will be disabled until you select a data group—go to Step 2.
2. Under the first, second, or third level of data, click on the data group you want to use for the section you are defining. The data group is highlighted and the Next> button is enabled.
You are not required to preselect data for your report. Each category of data will include a category called No Pre-selection. If you choose the No Pre-selection option, no data items and calculations will be listed in the Selected Data Items list view on the Select Data Items page of the wizard.You will need to manually select the data items you want to use. See the “Selecting Data Items Page” section in this chapter for more information about the list views.
Creating a New Report 2-16
Selecting Data
Items Page
2The Select Data Items page is where you finalize the actual data (data items and calculations) that will be displayed in your report. Data items are specific types of data stored in one of the CMS databases.
The data group you chose earlier is used to populate the following list views in the Select Data Items page:
● Available Data Items list view—contains all the data items associated with the data group. This list allows you to add data items to the Selected Data Items list view.
● Selected Data Items list view—contains predefined database items and calculations from the Available Data Items list that will be used in your report.
If you remove a calculation from the Available Data Items list, you will have to back up to the Select a Data Group page and reselect the data group to have the calculation appear in the list again.
Creating a New Report 2-17
Both list views contain the following three elements:
● Icon—if the data type is alphanumeric or has a graphical representation. Synonyms that are defined for data items are in parenthesis.
● Item Heading—default heading for the database item or calculation. The item heading is the heading used in standard CMS reports.
● Data Item—database item or calculation (internal name).
From the Select Data Items page, you can do the following:
● Filter data group items that appears in the Available Data Items list view.
● Sort data group items in the Item Heading or Database Items columns of the list views.
● Add data group items to the Selected Data Items list view.
● Access definitions for data group items.
● Remove data group items from the Selected Data Items list view.
● Reposition (move up or down) data group items in the Selected Data Items list view.
● Edit item headings to create custom report headings.
Filtering Data Group
Items
2Creating a New Report 2-18
To filter data group items, do the following:
● In the Display Data Group items that contain text box, enter the characters of the data items that you want Report Wizard to display. For example, if you want to list only those data group items that contain the text “logonsk,” then you would need to enter “logonsk.”
● To redisplay all data group items available to the data group, delete all text in the Display Data Group items that contain text box.
Report Wizard disables the Next> button whenever the “Display Data Group items that contain” text box has focus.
Sorting Data Group
Items
2You can sort the data group items by clicking on the Item Heading column or the Data Item column in the Available Data Items list view. All data group items will be sorted alphabetically.
Adding Data Group
Items to the Selected
Data Items List View
2You may want to add more data group items to your report than what is already preselected in the Selected Data Items list view. You can add any data group item(s) listed in the Available Data Items list view to the Selected Data Items list view by doing one of the following:
● Dragging and dropping the selected data group item(s) onto the Selected Data Items list view. With this method, you can drop a data group item(s) anywhere on the list.
● Clicking on the data group item(s), and then selecting the Add button. Report Wizard enables the Add button only when a data group item(s) is selected in the Available Data Items list view. With this method, a data group item(s) is added to the bottom of the list.
● Double-clicking on the selected data group item(s) from the Available Data Items list view. With this method, a data group item(s) is added to the bottom of the list.
Creating a New Report 2-19
Accessing Definitions
for a Data Group Item
2Report Wizard provides definitions for all the data group items listed in both list views. To see a definition for a specific data group item, do the following:
1. Click on the data group item for which you want a definition.
2. Select the Data Item Definition button located under the Available Data Items list view.
Report Wizard enables the Data Item Definition button only when you select a single data item or calculation.
Removing Data Group
Items from the
Selected Data Items
List View
2You may want to remove a data group item(s) that Report Wizard
preselected for your report. You can remove any data group item(s) listed in the Selected Data Items list view by doing one of the following:
● Dragging and dropping the selected data group item(s) onto the Available Data Items list view.
● Clicking on the data group item(s), and then selecting the remove button. Report Wizard enables the remove button only when a data group item(s) is selected in the Selected Data Items list view.
● Double-clicking on the selected data group item(s) in the Selected Data Items list view.
● Clicking on the data group item(s) in the Selected Data Items view list, and then pressing the ALT+left arrow key on your keyboard.
When you remove a data group item(s), ensuing data group items are shifted up accordingly.
Creating a New Report 2-20
Repositioning (Moving
Up or Down) Data
Group Items in the
Selected Data Items
List View
2Report Wizard allows you to reorganize the list of data group items in the Selected Data Items list view by moving them up or down. With this feature, you can dictate the order the database group items will appear in the report. You can reorganize data group items through the following methods:
● Clicking on the data group item(s), and then selecting the up button to move data group item(s) up or by selecting the down button to move the data group item(s) down. Report Wizard enables the up and down button only when a data group item(s) is selected in the Selected Data Items list view.
● Clicking on the data group item(s) in the Selected Data Items view list, and then pressing the ALT+up arrow key to move data group item(s) up or pressing the ALT+down arrow key to move the data group item(s).
Editing Item Headings
to Create Custom
Report Headings
2Report Wizard allows you to change the Item Heading of any data item in the Selected Data Items list view. You may want to change data item heading to a more meaningful name to use as your custom report heading. You can change the data item heading by clicking on the specific data item heading, and then selecting the Edit Item Heading button located below the Selected Data Items list view.
When you have finished selecting and manipulating database items for a specific section, the next task for that section is to define its appearance. Selecting the Next> button from the Select Data Items page will advance you to the correct page to format either the table or chart you are
Creating a New Report 2-21
Selecting the
Table Format
2From the Select Table Format page in the wizard, you define the
characteristics of your table layout. The default is a table in row order with grid lines.
The following types of table layouts are available to you:
● Row oriented table with grid lines
● Row oriented table without grid lines
● Column oriented table with grid lines
Creating a New Report 2-22
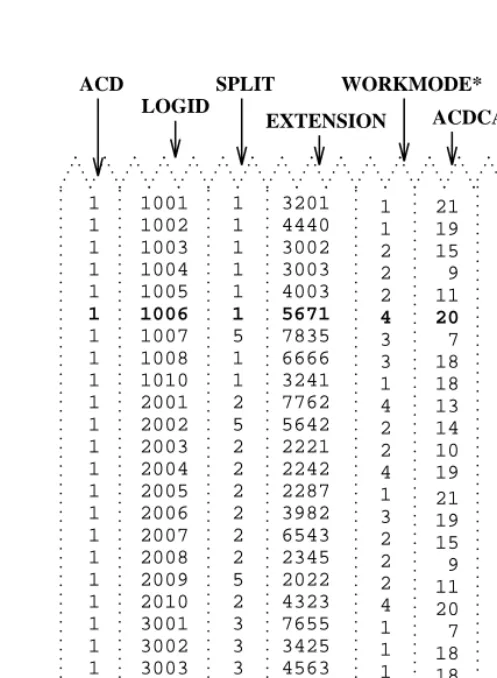
Example of a
row-oriented report
2Creating a New Report 2-23
To choose a format for your table, do the following:
1. Select the Fill Table by Row radio button if you want your report to have a row format, or select the Fill Table by Column radio button if you want your report to have a column format.
2. Select the Display Grid Lines check box if you want grid lines to separate the data on your report.
3. Select Next> to advance to the next page of the wizard. The Preview page appears. Go to the next section, “Previewing the Report,” on
page 25 in this chapter.
Selecting the Chart
Format
2Creating a New Report 2-24
The following chart formats are available to you:
To format your chart, do the following:
1. Select the Show Value radio button if you want to display your data as a numeric value, or click on the Show Percentage radio button if you want to display your data as a percentage.
2. Select the Display Legend check box if you want to display a legend on your report. The legend is a description of the data items
contained in the chart and is displayed in the right corner of the chart.
2D Vertical Bar Chart
3D Horizontal Bar Chart
2D Stacked Area Bar Chart
2D Horizontal Bar Chart
3D Vertical Stacked Bar Chart
2D Pie Bar Chart
2D Vertical Stacked Bar Chart
3D Horizontal Stacked Bar Chart
3D Vertical Bar Chart
2D Horizontal Stacked Bar Chart
3D Line Chart 3D Pie Chart
2D Line Bar Chart 3D Stacked Area Chart
Creating a New Report 2-25
3. Select the Display Data Labels check box if you want to show the data labels on your report. Report Wizard will display the data labels as either values or percentages (depending on what you have chosen in Step 1) and will be displayed above point.
4. Select the Use First data item as chart title check box if you want to use the first data item as your title.
5. Click on the graphic that best represents the chart format you want to use for your report.
6. Select the Next> button to advance to the next page of the wizard. The Preview page appears. Go to the next section, “Previewing the Report,” in this chapter.
Previewing the
Report
2The Preview page of the wizard allows you to preview what you have defined for your report, exit the preview, and then either use the <Back button to modify the report section or use the Next> button to advance to the next page of the wizard. A previewed version of a report contains real data for each completed section; however, if the report is designated as real-time then there will be no refresh of data. The only option while in a previewed version of a report is to exit the preview
Two-Section Report
2 When you preview the first section of the report, you will be prompted toCreating a New Report 2-26
Previewing the Report
2 To preview your report, click on the Preview button. Report Wizard willdisplay everything you have defined for your report up to this point.
Exiting the Preview of
the Report
2To exit the previewed version of your report section, click the Exit button or the Close button in the title bar. When you exit the previewed version of your report section, Report Wizard returns you to the Preview page.
Backing Up to
Previous Page
2While still in the Preview page of the wizard you can modify your report section by selecting the <Back button. Continuing to select the <Back button brings you through the various tasks involved in defining a section.
Moving Forward to
Next Page
2If you do not want to modify your report section, select the Next> button to advance. If you still have undefined report sections, Report Wizard will display the Selection Layout page. From the Selection Layout page you will begin to define your next report section. Select the Next> button to advance to the next page of the report wizard (go to the “Defining a Report Layout Section[s] on page 13 in this chapter for information on defining report layouts).
If you have defined all report sections then Report Wizard will display the Change Input Captions page. Go to the next section, “Changing Input Captions,” in this chapter.
Changing Input
Captions
2When you are finished defining all report sections, the Change Input Captions page appears. This page of the wizard allows you to change the input captions that will appear in the Report Input window for your new report.
The number of entries displayed in the Change Input Captions page will depend on the data group you assigned to each section of your report. From this page, you can change only the input captions and not the inputs that will appear in your report.
To change the input caption(s), do the following:
1. Highlight the input caption you want to change.
2. Type the new input caption.
Creating a New Report 2-27
4. Select the Next> button to advance to the next page. The Save Report page appears. Go to the next section, “Saving the Report,” in this chapter.
Saving the
Report
2Creating a New Report 2-28
To save your report, do the following:
1. Enter the name of your report in the Report Name text box. When entering a name to save your new designer category report (global or private), you will be presented with one of the following three scenarios:
● There is no existing designer category report with the name you have selected for your new report. In this case, Report Wizard will save the report with the name you have selected.
● There is an existing designer category report with the same name that you have selected for your new report; however, you are the owner of this report. In this case, you will get a
message warning you that you are about to overwrite an existing report. You can either overwrite the existing report or select a different name for your new report.
● There is an existing designer category report with the same name that you have selected for your new report; however, you are not the owner of this report. In this case, you will get a message stating that you cannot overwrite the existing report. You will have to select a different name for your new report.
If you do not enter a report name your report will not be saved when you advance to the Finish page of the wizard. Neglecting to save your report in either the Save Report page or the Finish page will discard your report.
2. If you want your report to be available to everyone, click on the Everyone radio button. If you want your report to be available only to you, click on the Only Me radio button. The following provides information about each choice:
● Everyone radio button (default)—provides global access to the
report. By selecting the Everyone radio button, you give other users the following capabilities:
— Other users can run the report
— Other users can copy the report design when designing their own custom report in Report Designer.
The CMS user permission structure is still applicable.
Creating a New Report 2-29
3. Select the Next> button to advance to the next page. The Finish page appears. Go to the next section, “Finishing the Report,” in this chapter.
Finishing the
Report
2When all the required tasks are completed to create a report, you will have to determine whether you want to run the report, edit the report through Report Designer, or exit without doing anything (enabled for saved report only).
Running the
Report
2When you run your report from the Finish page of the Report Wizard, it will be run with the appropriate inputs, will access the CMS database, and will produce real data. You will be running a live report.
Creating a New Report 2-30
To run your report, do the following:
1. From the Run Report for ACD combo box, select the ACD.
2. Click on the Run Report radio button, and then select the Finish button.
Editing Your Report
2 When you choose to edit your report from the Finish page of the ReportWizard, the Report Designer starts. All edits to your report are now done through the Report Designer. You can also edit your report using the Report Wizard by selecting the <Back buttons on the various pages of the wizard.
To edit your report, do the following:
1. From the Run Report for ACD combo box, select the ACD.
2. Click on the Edit Report in Report Designer radio button, and then select the Finish button.
Exiting Report
Wizard
2To exit Report Wizard without running your report or editing your report, click on the Run or Edit report at a later time radio button (this option will be disabled if you have not entered a report name for your report), and then select the Finish button. You can also select the Cancel button.
Introduction 3-1
3 Using the Report Manager
Introduction
3This chapter teaches you how to use the report manager feature of the Supervisor application. The sections of the chapter are as follows:
● About Report Manager
● Viewing Report Properties
● Copying a Report to the Designer Category
● Copying a Designer Report to a File
● Copying a Designer Report from a File
● Deleting a Report from the Custom or Designer Category
About the Report Manager 3-2
About the Report Manager
3The report manager is the feature of the Supervisor application that allows you to view report properties, copy reports, and access the Report Designer to edit reports or create new reports.
The report manager is incorporated into the Reports Selector window, as shown below:
You can use the Properties, Copy, and Edit buttons on the Report Selector window to manage the standard CMS and Supervisor reports, and to Copy reports to the Designer category for editing. You can use the
New button to create a new Designer report from scratch. You can use
the Delete button to delete reports from the Designer category (standard CMS, CMS Custom, and standard Supervisor reports cannot be deleted).
For information on using the Add Bookmark button, see the CentreVu® CMS R3V8 Administration (585-210-910) document
Viewing or Changing a Report’s Properties 3-3
Viewing or Changing a Report’s Properties
3The Report Manager gives you the ability to view report properties, such as the report name, description, owner, type, folder, category, and scope (Everyone or Only Me), and the folder the report is stored in.
To view a report’s properties, complete the following steps:
1. Open the Report Selector window.
2. Select the report for which you want to view properties.
3. Click the Properties button.
The Properties window for the report appears as shown below:
From the Properties window, you can change the name, description, owner, and scope of a report.
4. To change the Name, Description, or Owner of a report, place the cursor in the appropriate field and make your edits. To change the scope, or who the Report is Available to, of a report, select either the Everyone or Only Me radio button. When you are done making your changes, select the OK button to save the changes.
Copying a Report to the Designer Category 3-4
Copying a Report to the Designer Category
3Using the Report Manager, you can copy a report from any category (Agent, Other, Queue/Agent, Split/Skill, Trunk/Trunk Group, VDN, Vector, Custom, or Designer) and folder (Real-Time, Historical, or Integrated) into the Designer category of any folder.
Reports that are created or edited using the Report Designer can only be accessed from the Supervisor interface to the CMS server. Therefore, if you edit a CMS Custom Report using the Report Designer, the changes to that report will not be available when the report is run from the Terminal Emulator or another terminal interface to the CMS.
To copy a report, complete the following steps:
1. Open the Report Selector window.
2. Select the report that you want to copy.
3. Click the Copy button.
The Copy Report window appears. This window allows you to select where you are copying the report to (the Designer category, a PC file, or from a PC file to the CMS server).
4. Select the To Designer Category radio button.
5. Select the OK button.
Copying a Report to the Designer Category 3-5
To define the properties information for a copied report, complete the following steps:
6. Enter a name for your report in the Name field. The name can have up to 40 characters, including blanks. Because the name you give your report should be unique, you may want to look at existing report names before entering a name for your report.
7. Move the cursor to the Description field and enter a description of the report. The description can have up to 100 characters, including blanks. It is not required that you enter a report description.
Do not use the \ (backslash), ; (semicolon), ’ (grave accent), ~
(tilde), “ (double quote), | (pipe), * (asterisk), or ? (question mark) characters in your description of the report.
8. Move the cursor to the Folder field. Use the pull-down list to select Real-Time, Historical, or Integrated. The report will be stored in the Designer category of the folder you select here.
When you edit the report you will access the database for the folder you select here. If you select Real-Time, you will not be able to access the Historical database tables to define queries for the report. If you select Historical, you will not be able to access the Real-Time database tables to define queries for the report. However, if you select Integrated, you will be able to access both the Real-Time and Historical databases to define queries for the report.
You must select the Historical or Integrated folder if you want to include the following:
● Exceptions data
● Agent trace data
● Call record data.
9. Select the Everyone radio button to make the report accessible to all CMS users who have the appropriate permissions, or select the
Only Me radio button to make the report accessible only to yourself
It is a good idea initially to make your reports available only to yourself until they have been debugged and run successfully. This prevents the possibility of other users running reports that you have saved but not yet tested.
Assigning “Everyone” access to the report allows other users to run the report and to copy the report to create new designer reports.
Copying a Report to the Designer Category 3-6
No other CMS user other than a user with CMS administration permissions can modify a report design you create, regardless of whether the report is accessible by all or only by you. A user with CMS administration permissions always has the ability to modify your report design, even if you make it available only to yourself.
10. Select OK to save the report properties.
Copying a Designer Report to a File 3-7
Copying a Designer Report to a File
3You can use the Report Manager Copy button to copy any designer report that you create to a file, either on diskette, on your hard drive, or on a network drive. You can use this feature to easily transport designer reports from one PC to another.
If a report was created by Lucent Technologies Professional Services, only a user with CMS services permissions can copy the report.
To copy a report, complete the following steps:
1. Open the Report Selector window.
2. Select the Designer Category
3. Select the designer report that you want to copy.
4. Click the Copy button.
The Copy Report window displays with the To a PC File option enabled. This window allows you to select where you are copying the report to (the Designer category, a PC file, or from a PC file to the CMS server).
5. Select the To a PC File radio button.
6. Select the OK button.
The Save Report to PC File window appears as shown below:
Copying a Designer Report to a File 3-8
7. Select the File name and Folder to which you want to save the report.
You can copy the report to any drive to which you have access, including the floppy (usually a:\) drive on your PC.
You can save the report to a network drive by selecting the Network button, which allows you to access the network drives that you have permissions for.
8. Select the OK button.
9. The file is saved and, upon successful completion of the save, a confir